The git repo: https://github.com/JinjunXiong/divhacks
Required tasks:
- You’ll first need to generate the EASY or HARD labels for each digits based on the 21 ML algorithms prediction values. To do so, you need to calculate the percentage of times the prediction is correct, i.e., PC = (# of correct predictions) / 21. You will also choose a threshold value (T) to convert that PC number into an EASY or HARD label. For example, let’s say we pick the threshold to be T = 50%, then if there are more cases of a digit are predicted correct than wrong, we can mark that digit as an “EASY” label. Otherwise, that image is marked as a “HARD” label. (You will later experiment with different threshold values.) You will need to generate the EASY or HARD labels for both the training dataset and the test dataset.
I wrote some python to read in the csv files and calculate the labels with a hardcoded threshold of 0.5, and output the PC as well as EASY/HARD label to another csv file.
They are test_label.csv and train_label.csv.
- Explore the dataset and report your findings using either data or plots to answer the following question: among 0 – 9, which digits are easier to predict than others? What could be the reasons in your opinion?
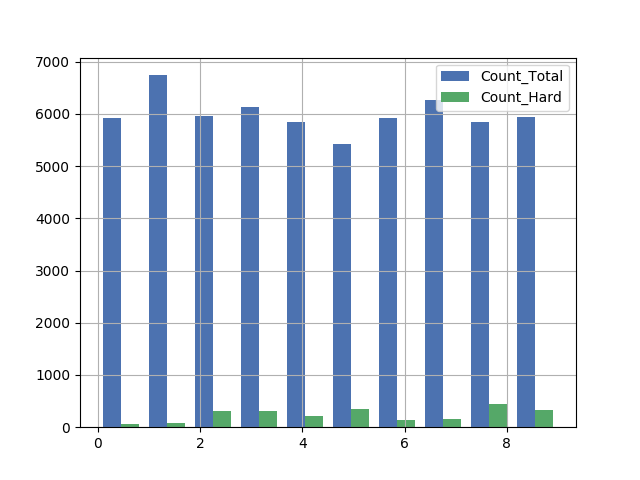
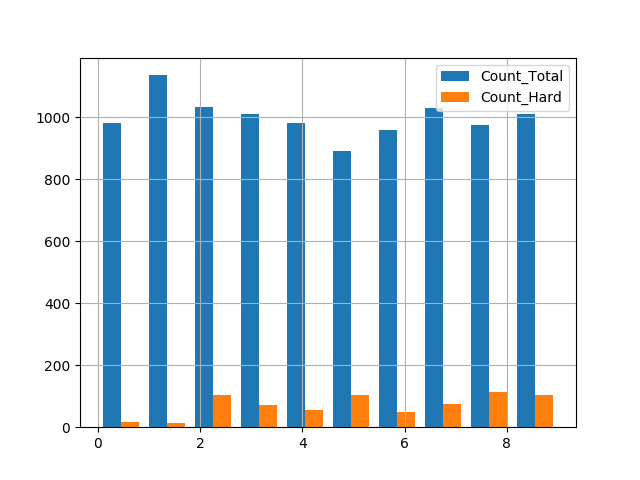
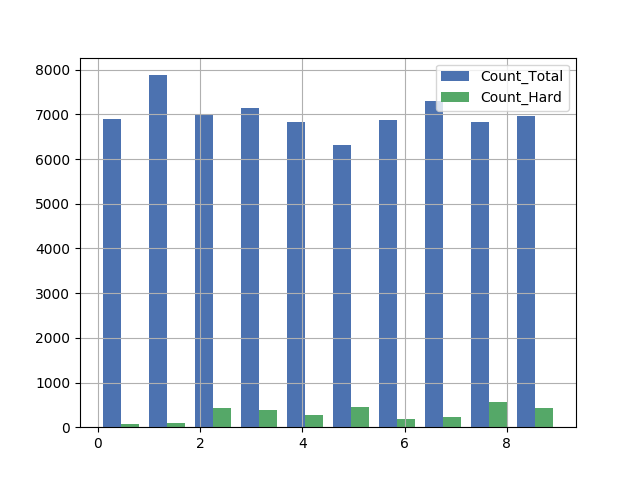
I counted the number of HARD labels and the total for each digit, and plot them in a histogram. It seems that for the training set, the hardest is 8, while the easiest is 0; for the test set, the hardest is 5, while the easiest is 1.
If we look at the argsort() result, for training: [0 1 6 7 4 3 2 9 5 8]
for testing: [1 0 6 4 3 7 2 9 8 5]
The order is from easiest to hardest.
So it seems that in these data sets, 1, 0, 6 are consistently easier to predict, while 2, 9, 5, 8 are consistently harder to predict.
One possibly reason for that could be the easiness of strokes, or the simpleness of shapes. There could be many ways to write digits, and when there are more twists in a digit, the # of ways also increase.
- Design and implement a binary classifier (EASY or HARD) for all MNIST training data using the above so-obtained labeled data -- while using the 10K test data for testing. Please report your training and test accuracy. Please remember to set aside some the validation data from your training data to tune your classifier as needed (a.k.a cross validation). Please do NOT use your test data set to tune your classifier. You should only report your final results using the test data set, and use that test data set ONCE. If you're hazy about the differences between training, validationand test datasets and their purpose for machine learning, please ask one of the technical mentors for clarification, or read at least this Overstack article.
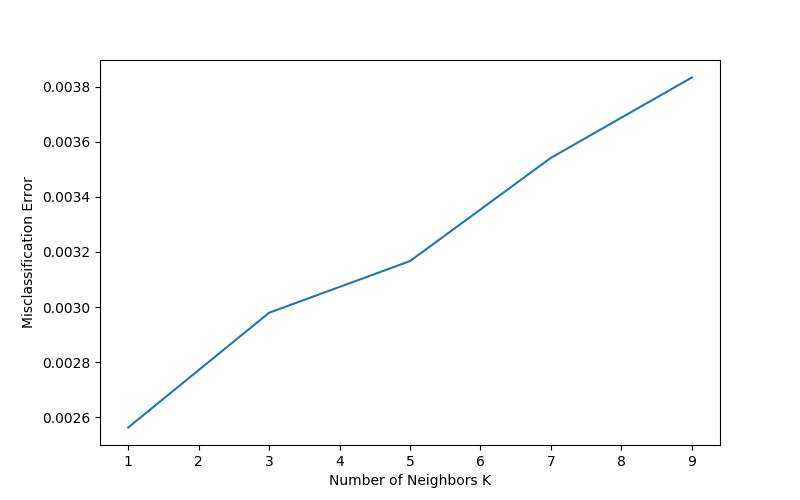
Nearest neighbor is one of my favorite classification algorithms, so I just used the KNN from scikit learn and cross validated to get that the optimal number of neighbors is 1.
With k=1,
Training accuracy: 1.0
Test accuracy: 0.9907.
I'm a little surprised that k is actually 1 for this data set. I want to think more about this.
It's called mnist_tasks.py. Note that you need to have matplotlib, numpy, scipy and sklearn installed. Go to the main() method and uncomment the parts that you want to run. Then do:
python3 mnist_tasks.py
https://kevinzakka.github.io/2016/07/13/k-nearest-neighbor/ http://scikit-learn.org/stable/documentation.html


