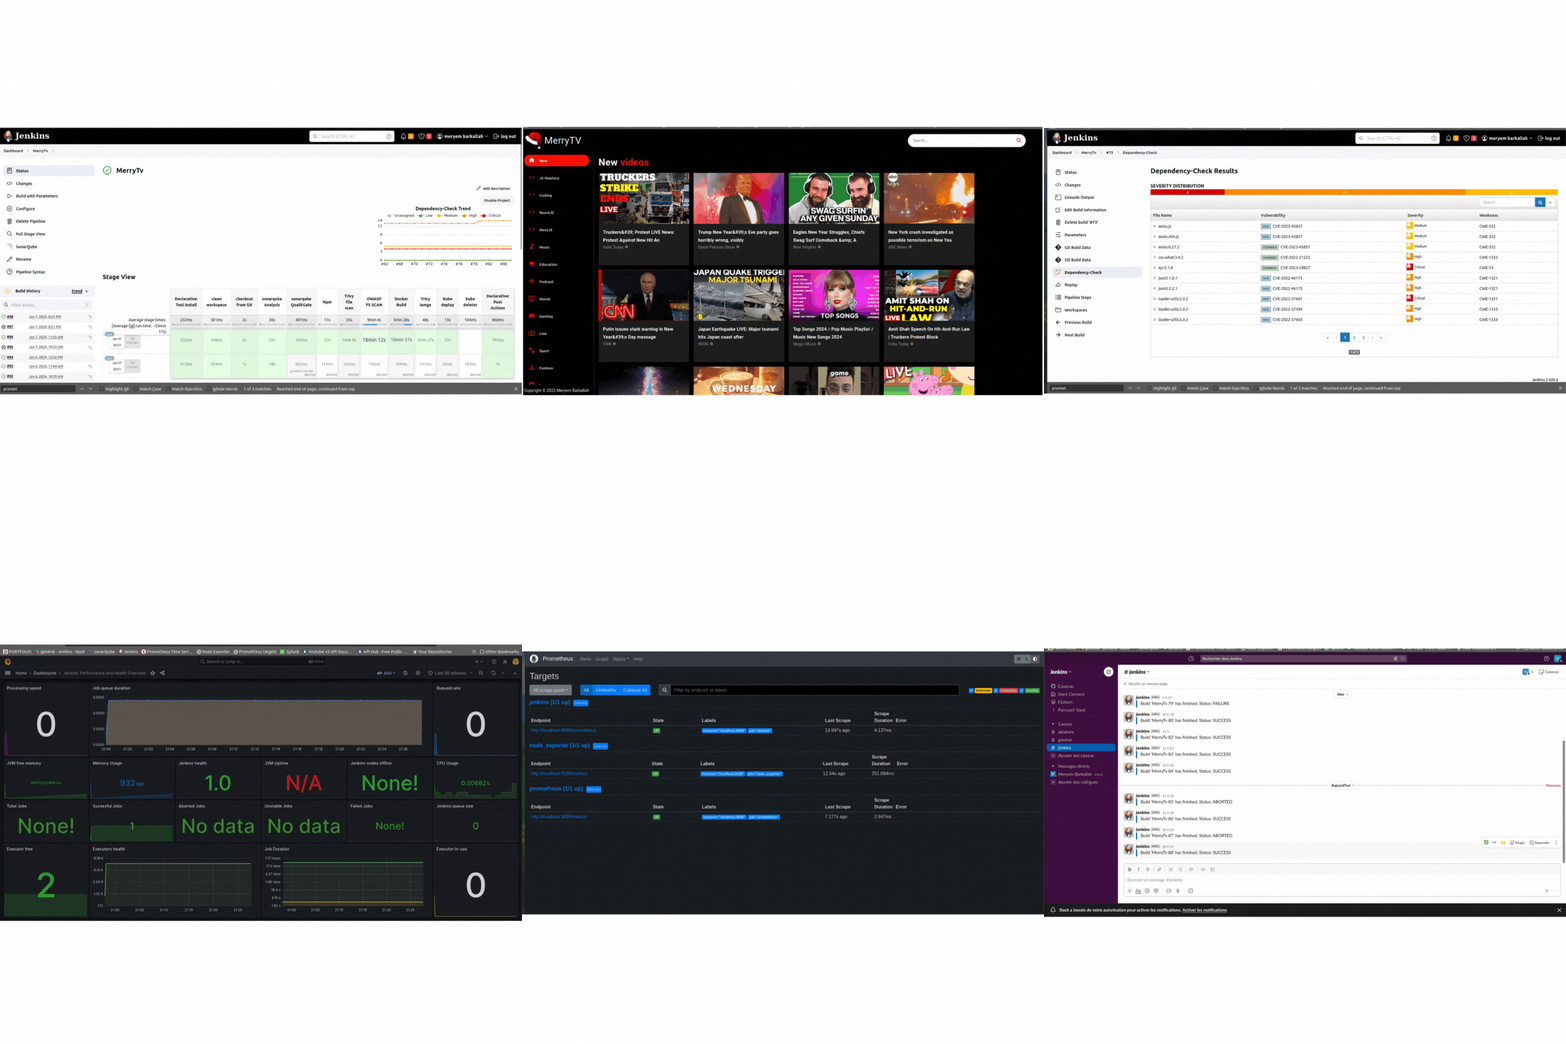
MerryTV is a DevOps school project that integrates various tools and technologies to streamline the development and deployment process. 🛠️💻
Jenkins is employed as the automation server, providing a robust platform for building, deploying, and automating projects.
Docker facilitates seamless containerization, ensuring consistency across different environments and simplifying deployment.
Trivy is integrated to enhance container security by scanning Docker images for vulnerabilities.
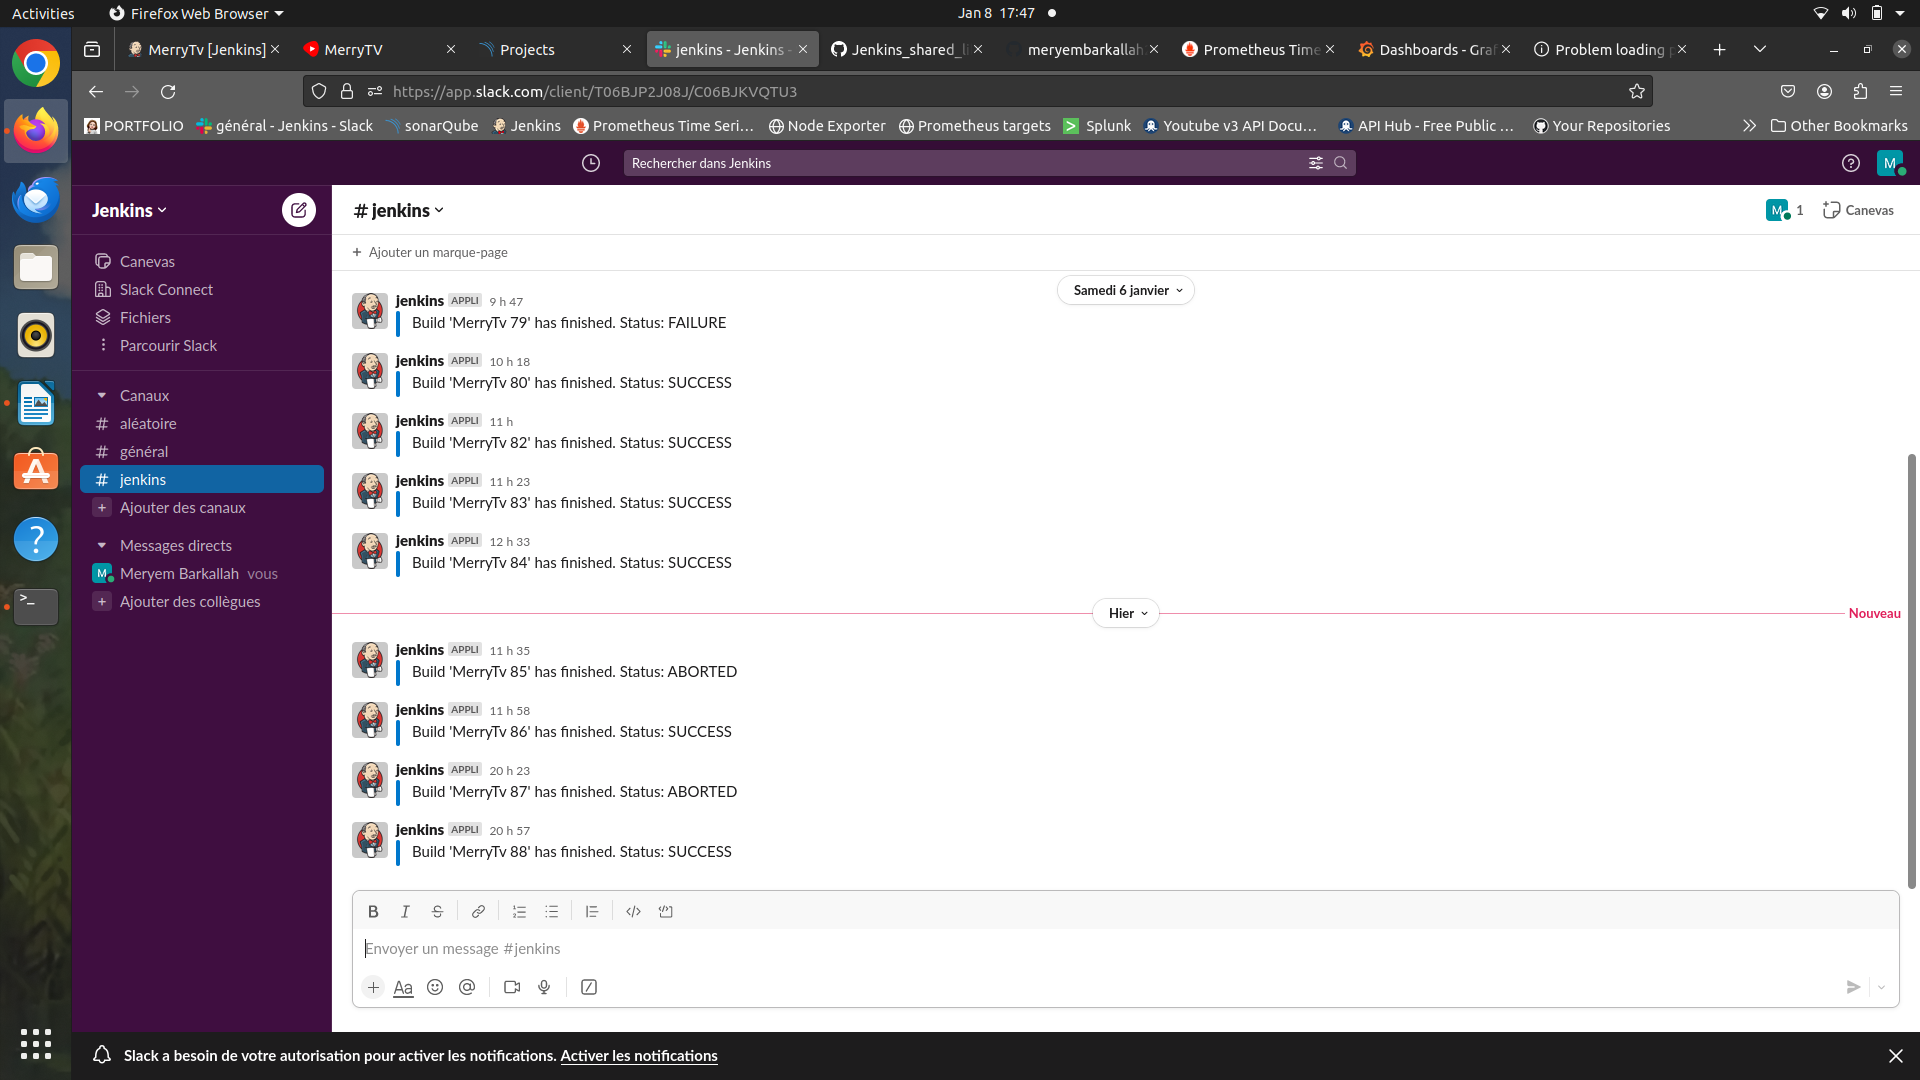
Slack is employed for effective communication and real-time notifications. Jenkins CI app integration ensures immediate updates.
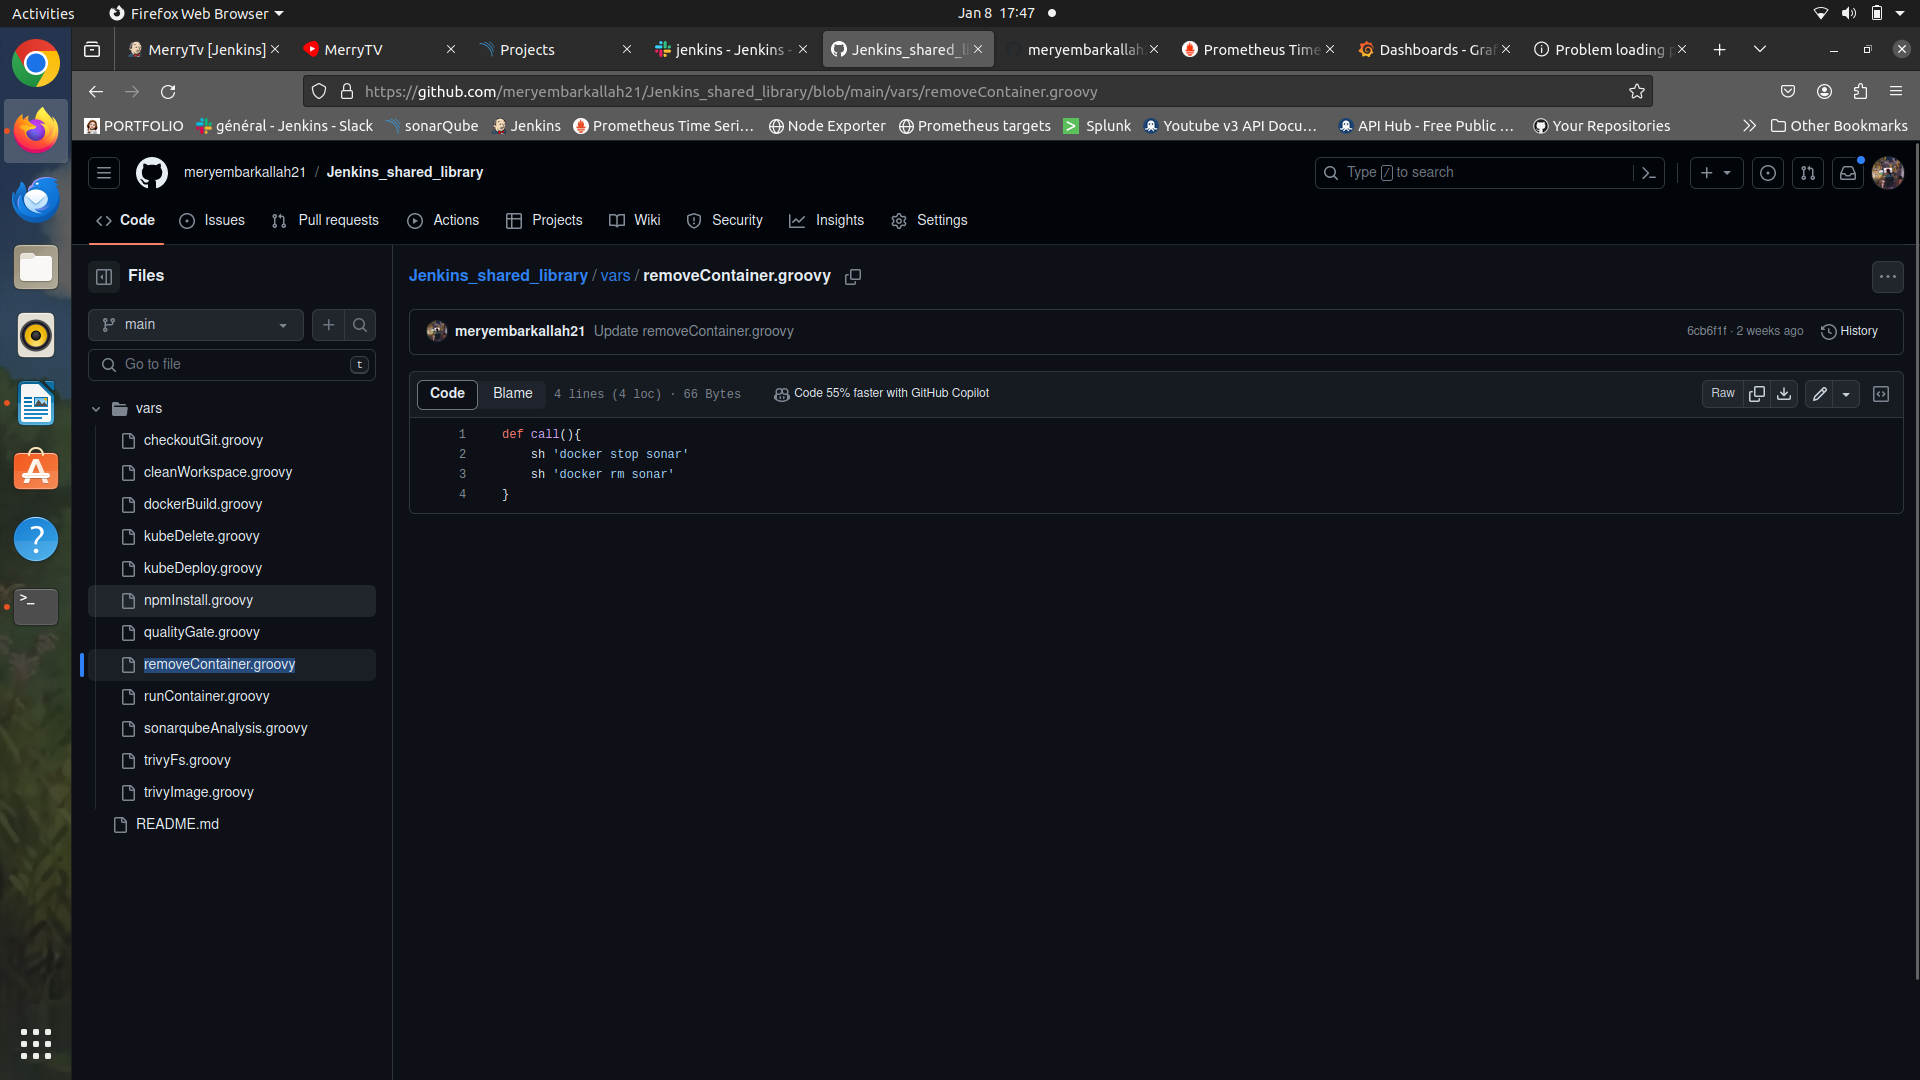
The Jenkins Shared Library contains essential scripts for various tasks, enhancing reusability and maintaining a consistent pipeline structure. Key scripts include:
checkoutGit.groovycleanWorkspace.groovydockerBuild.groovykubeDelete.groovykubeDeploy.groovynpmInstall.groovyqualityGate.groovyremoveContainer.groovyrunContainer.groovysonarqubeAnalysis.groovytrivyFs.groovytrivyImage.groovy
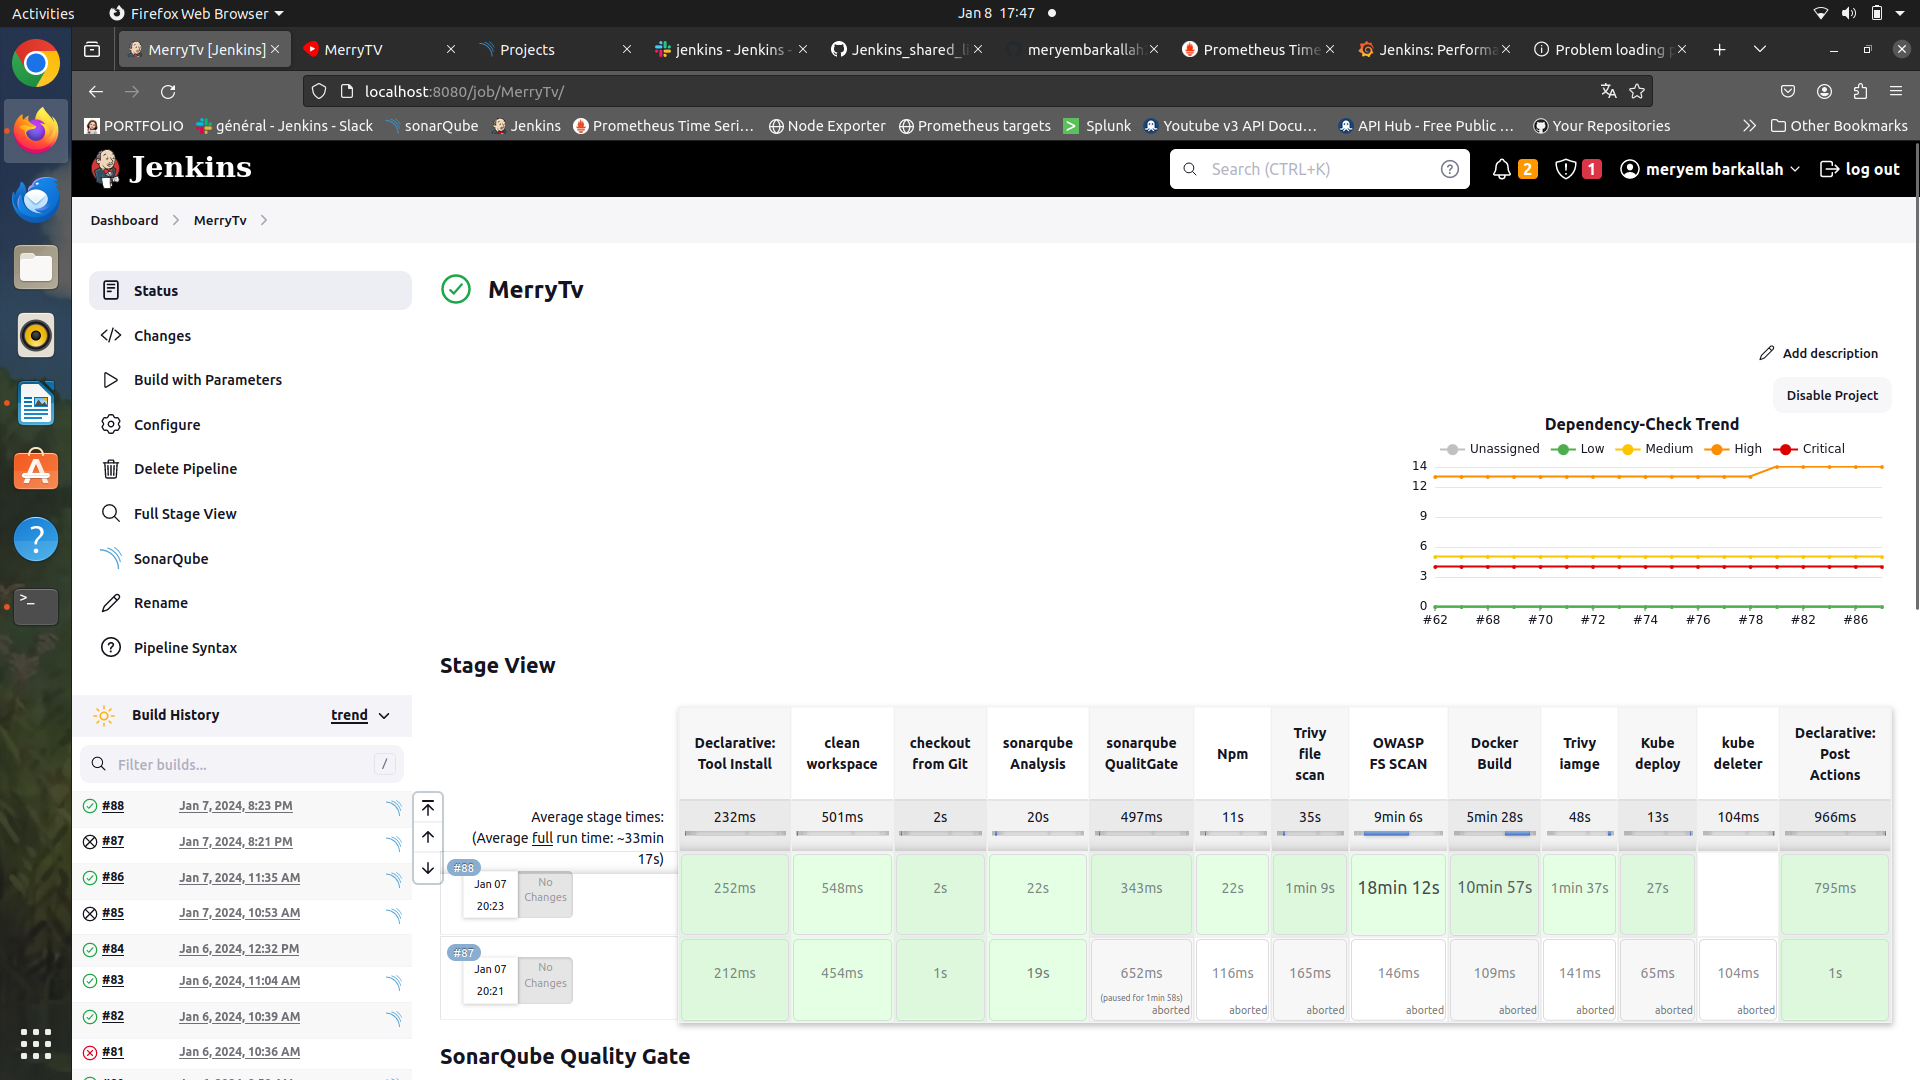
The Jenkins pipeline is structured to automate builds and deployments. It starts by triggering a job, utilizing a shared library stored in GitHub for reusability. The pipeline includes stages for installing plugins, configuring tools, integrating SonarQube for code quality checks, and adding custom stages for a tailored workflow.
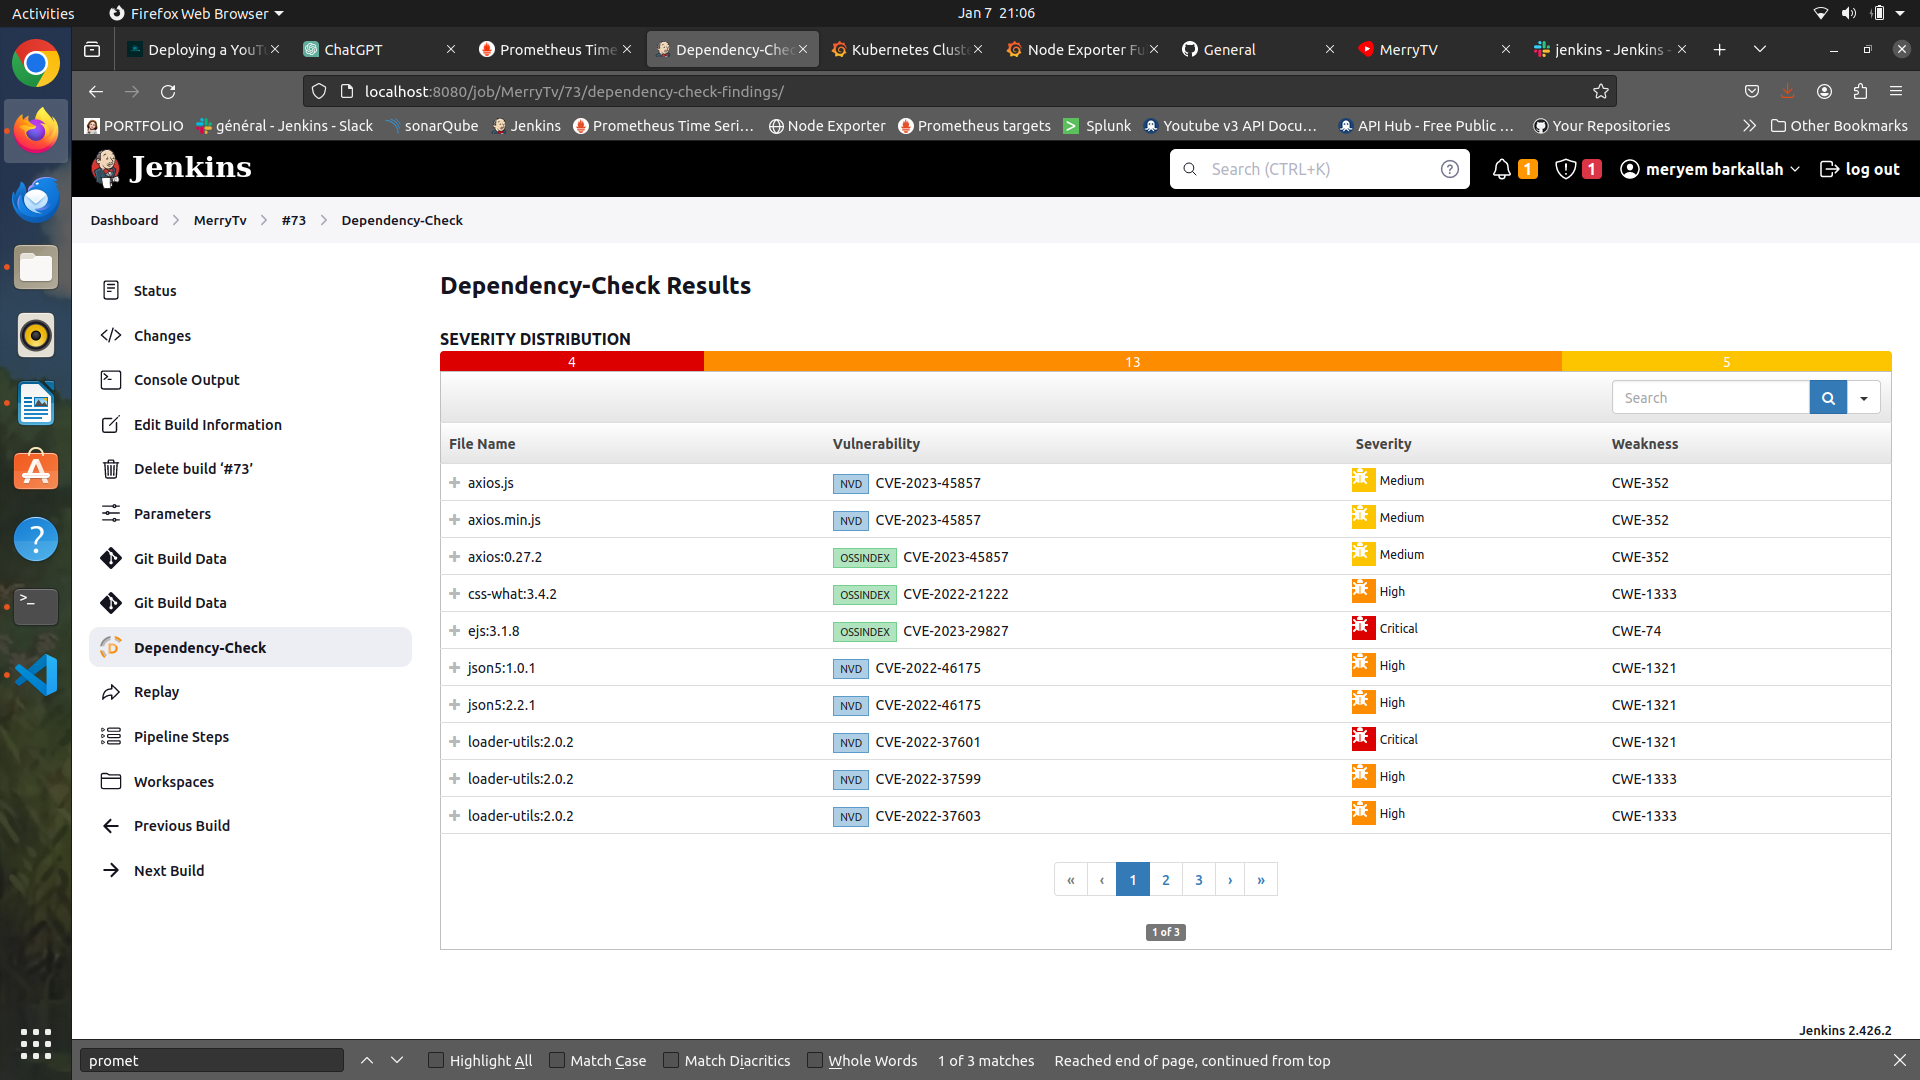
- OWASP Dependency Check is implemented to identify vulnerabilities in project dependencies.
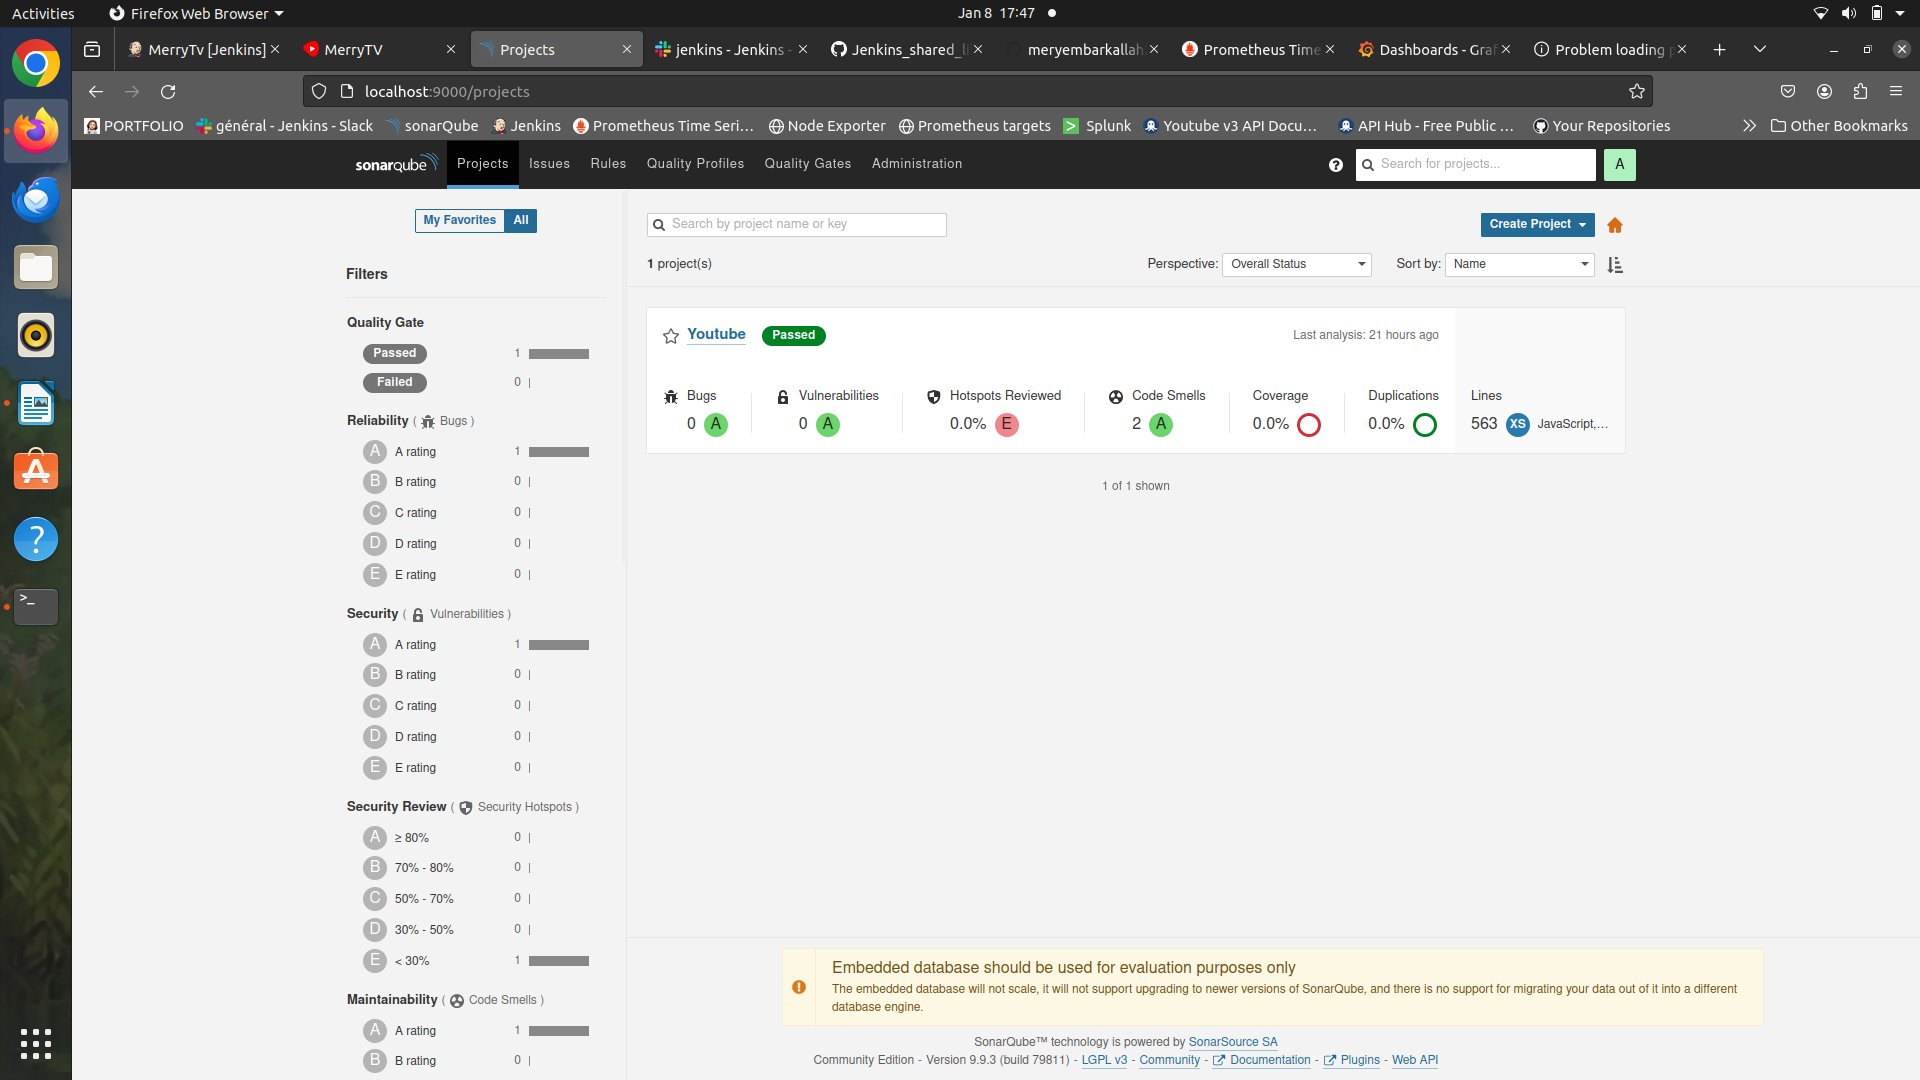
- SonarQube is integrated for continuous code quality checks.
Automated Docker image builds and push to a container registry are achieved, along with secure API interactions using an API key from Rapid API.
-
Helm for Kubernetes Application Management: Utilize Helm to simplify the management and deployment of applications on Kubernetes.
-
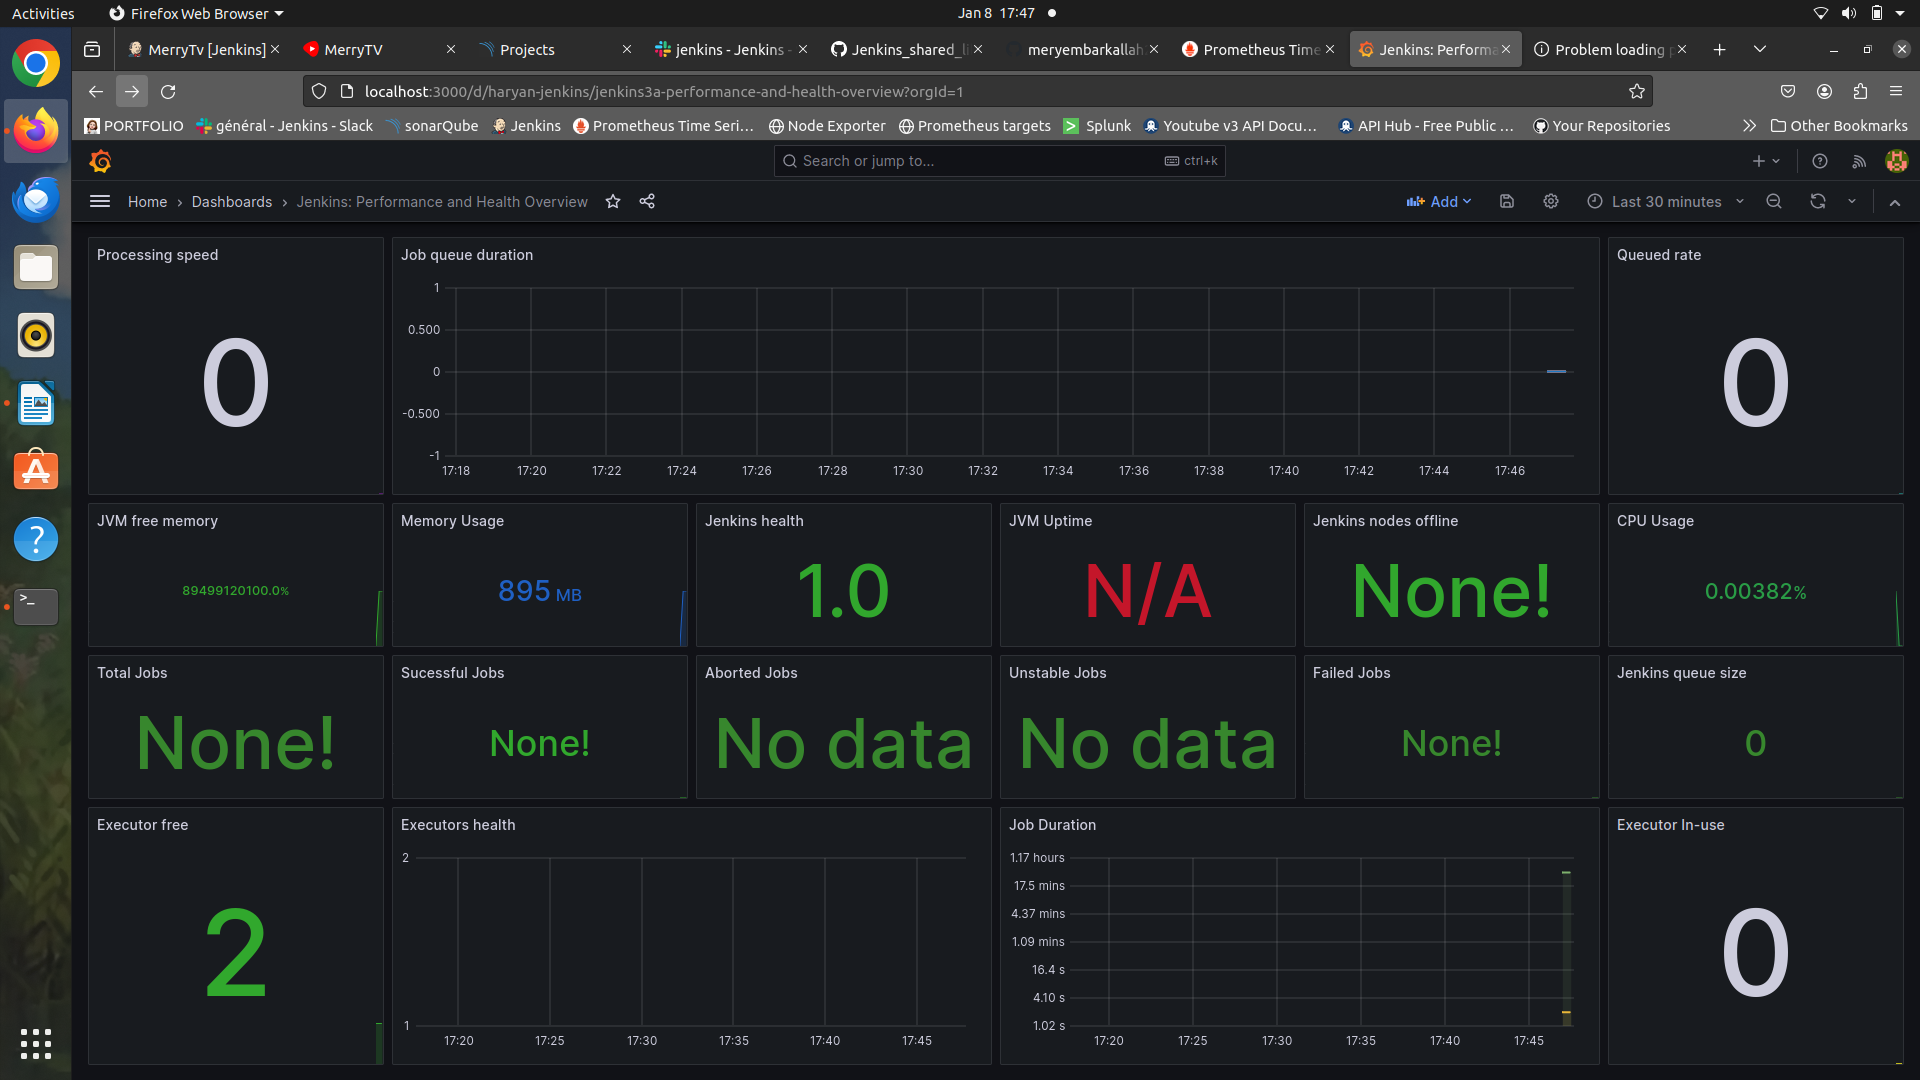
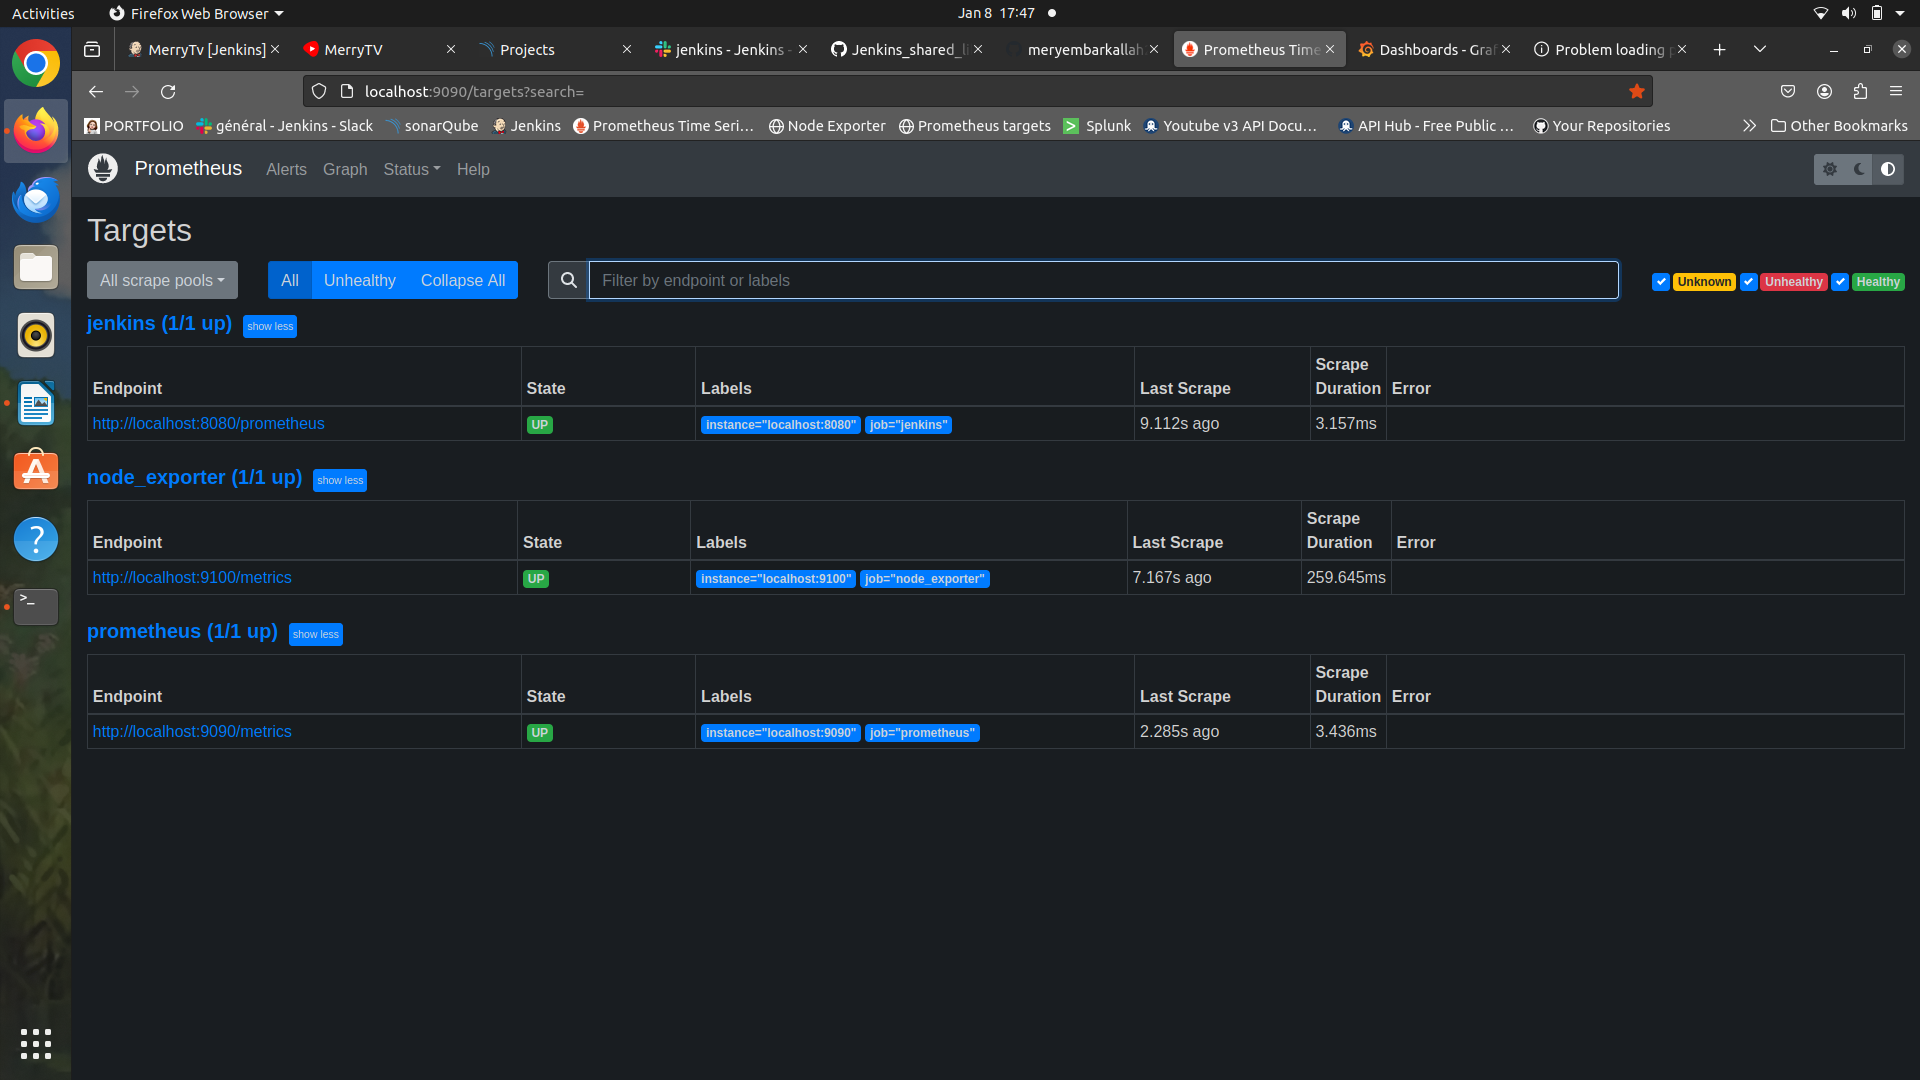
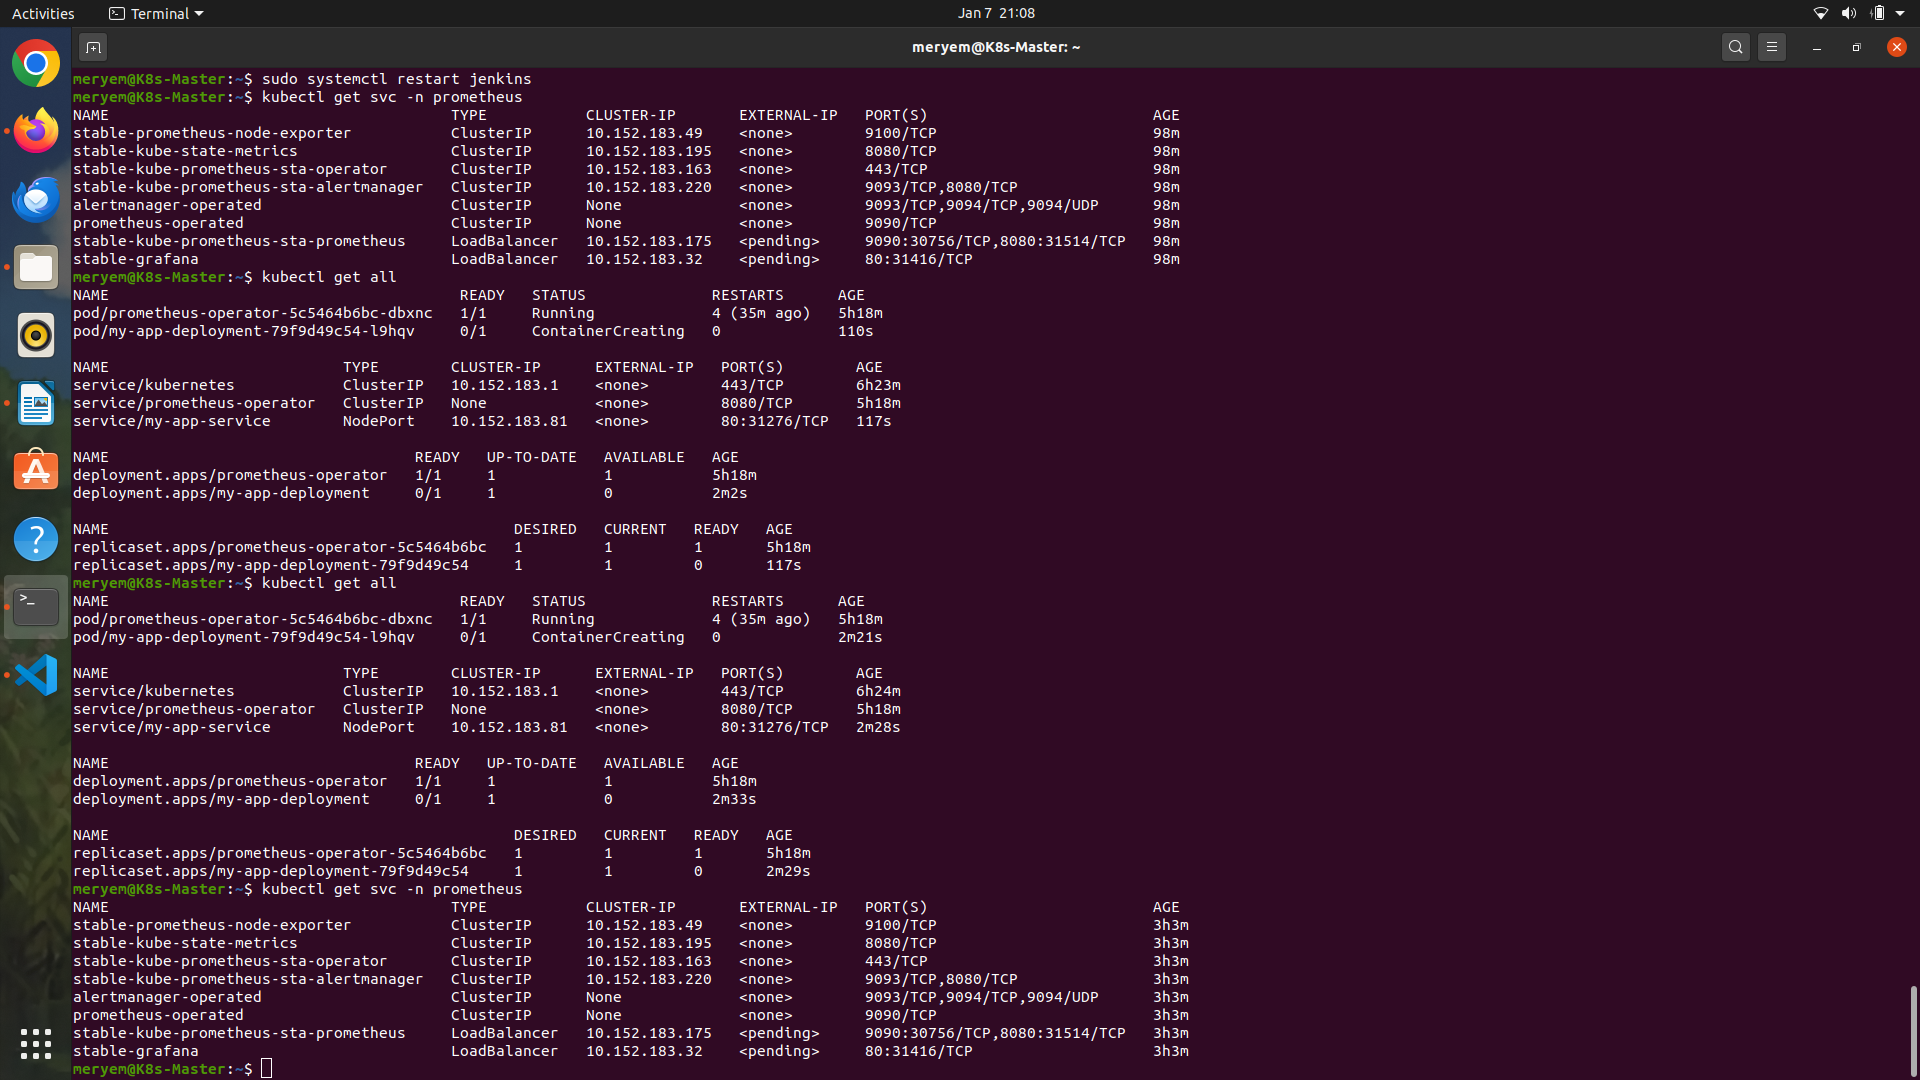
Prometheus for Monitoring: Implement Prometheus for robust monitoring, collecting and processing real-time metrics.
-
Grafana for Visualization: Leverage Grafana to create interactive and customizable dashboards, providing optimal visualization of Prometheus metrics.
-
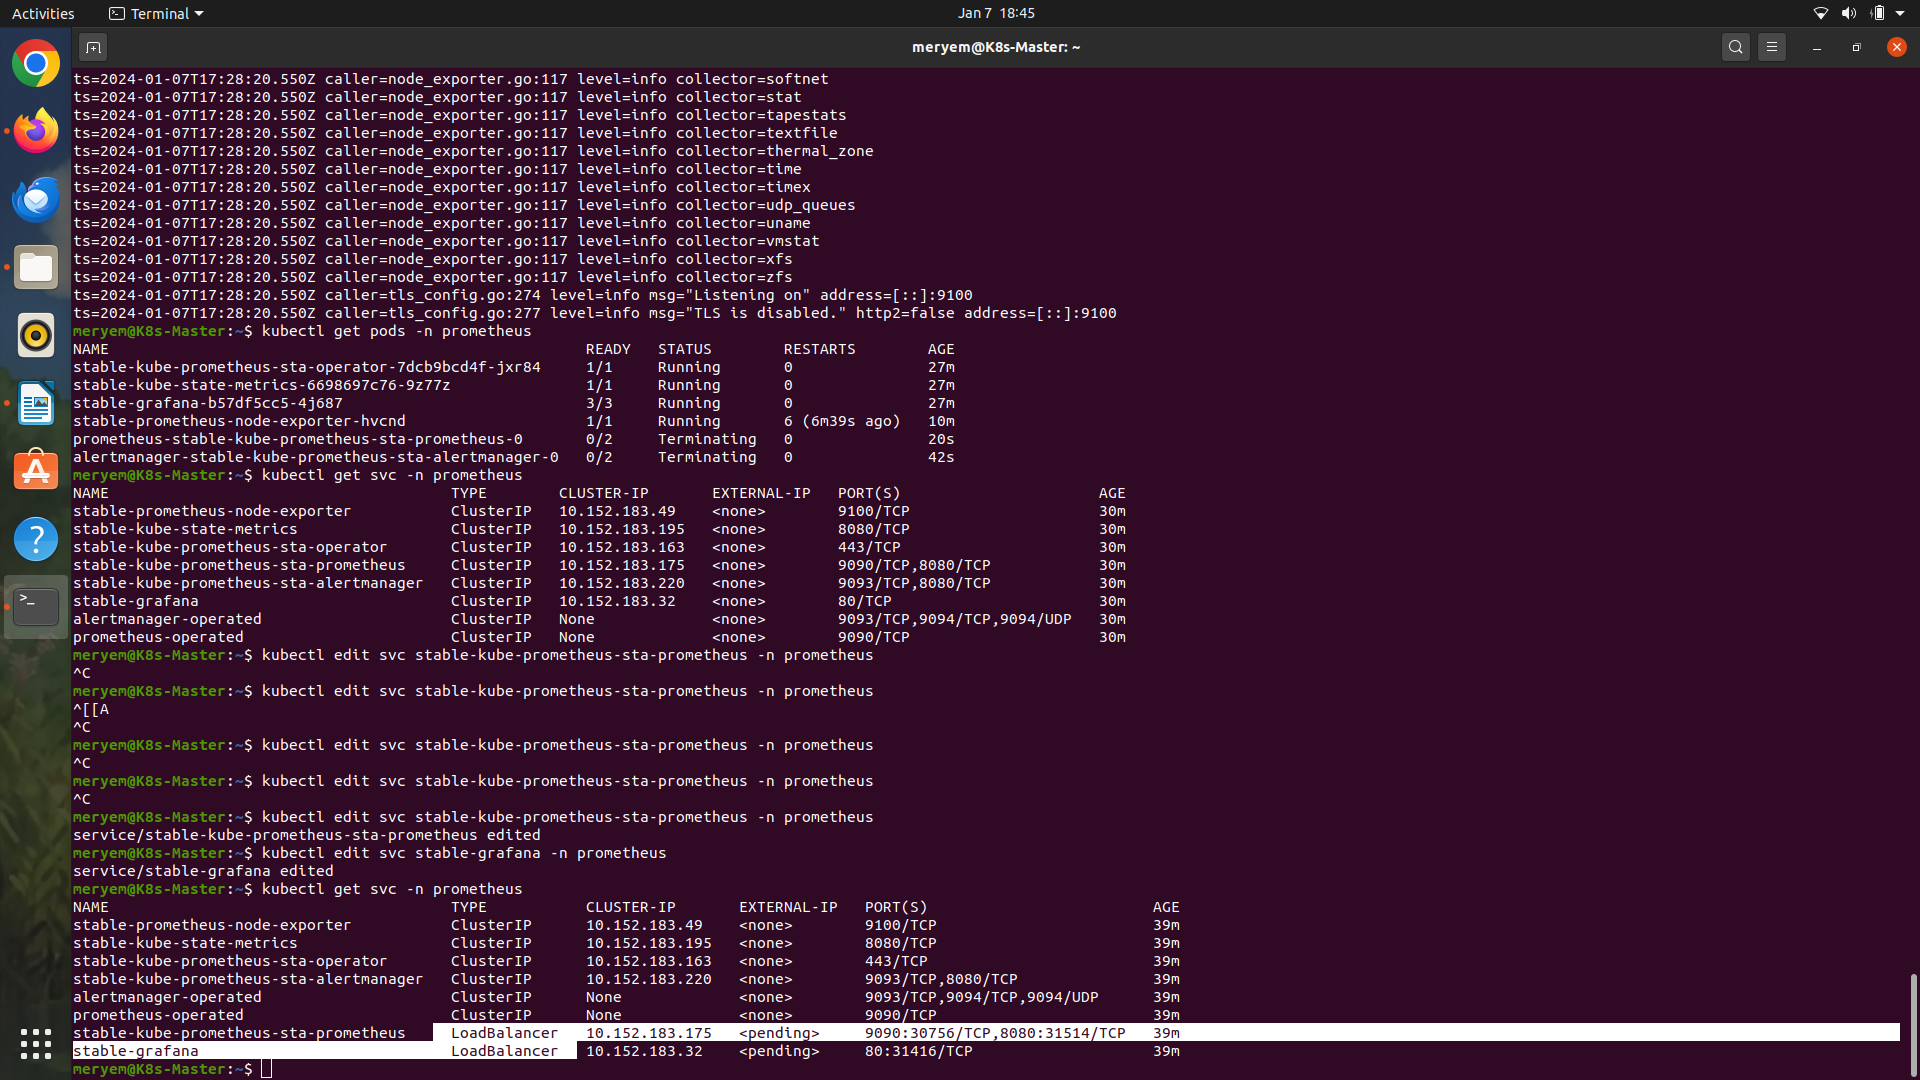
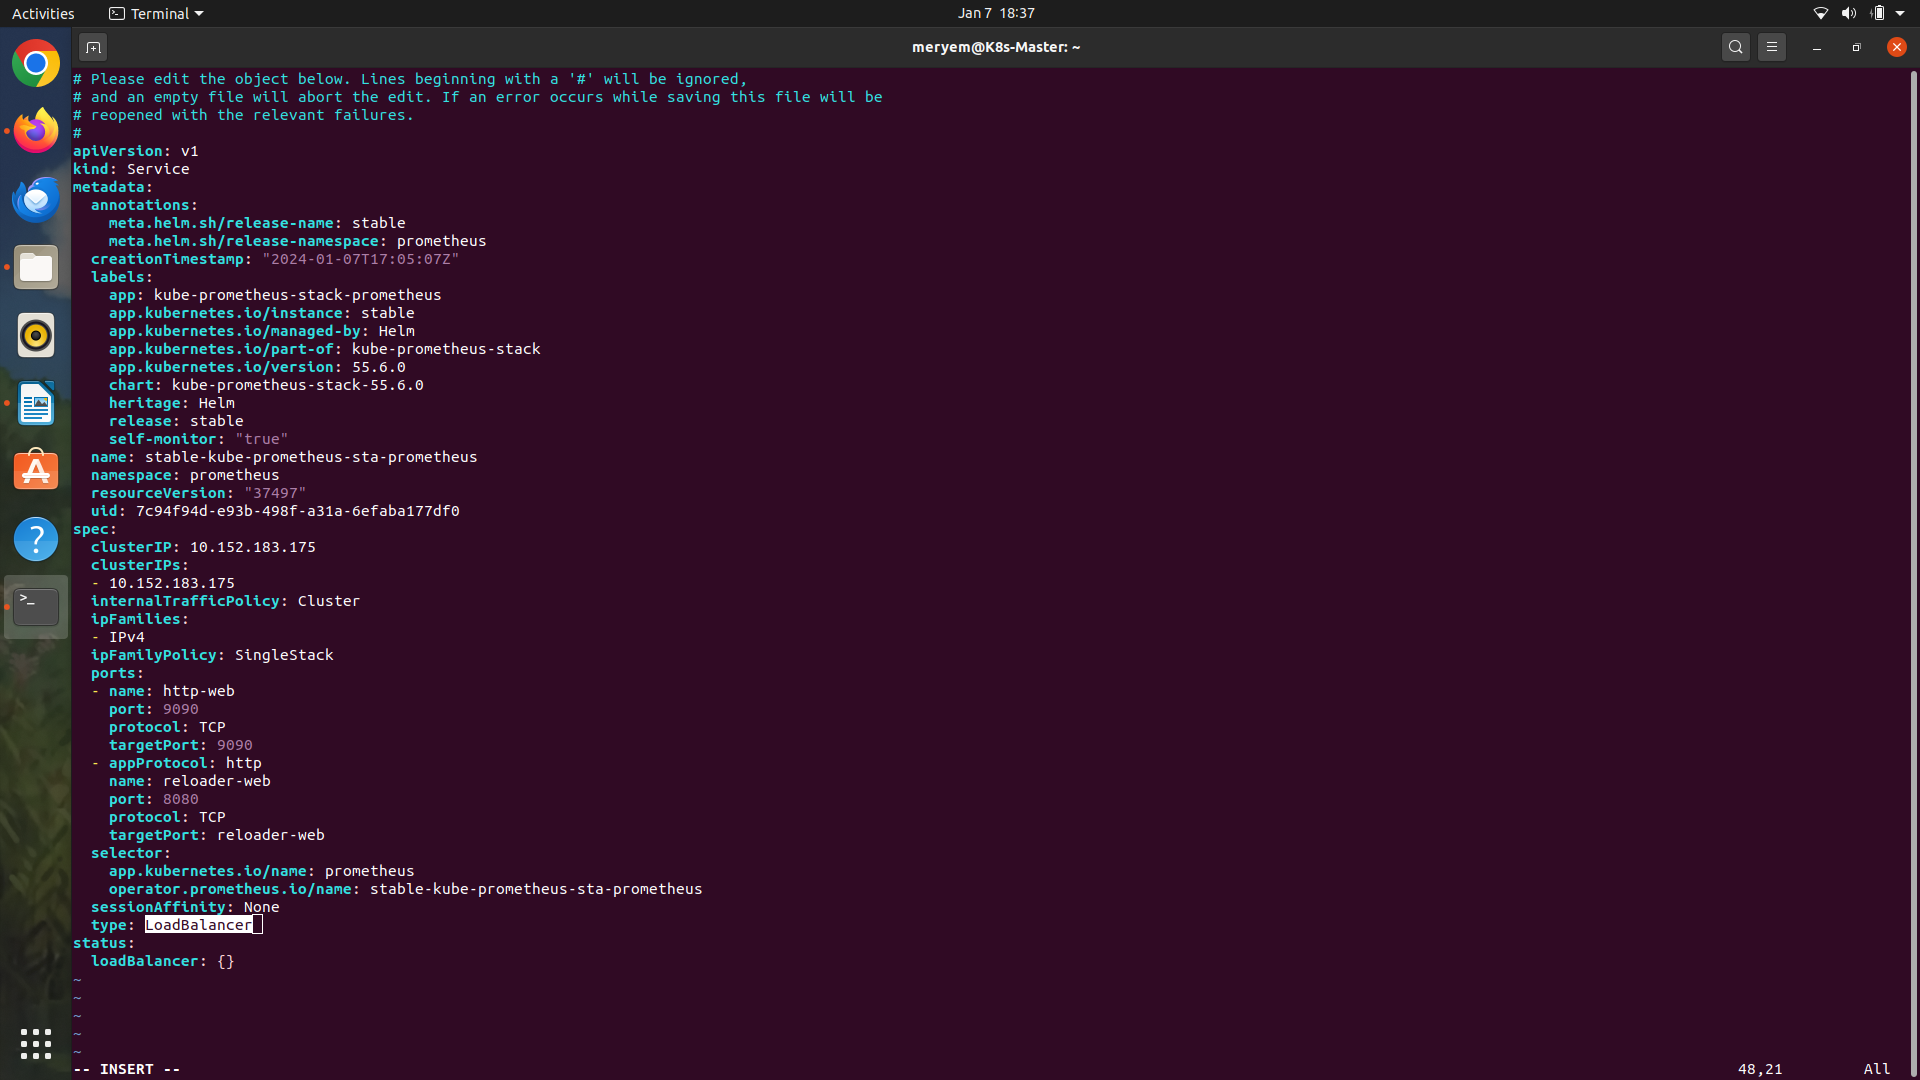
Customizing Prometheus Service: Tailor the Prometheus service configuration to ensure optimal performance for collecting and storing metrics.
-
Customizing Grafana Service: Fine-tune Grafana service settings to meet specific visualization requirements.
-
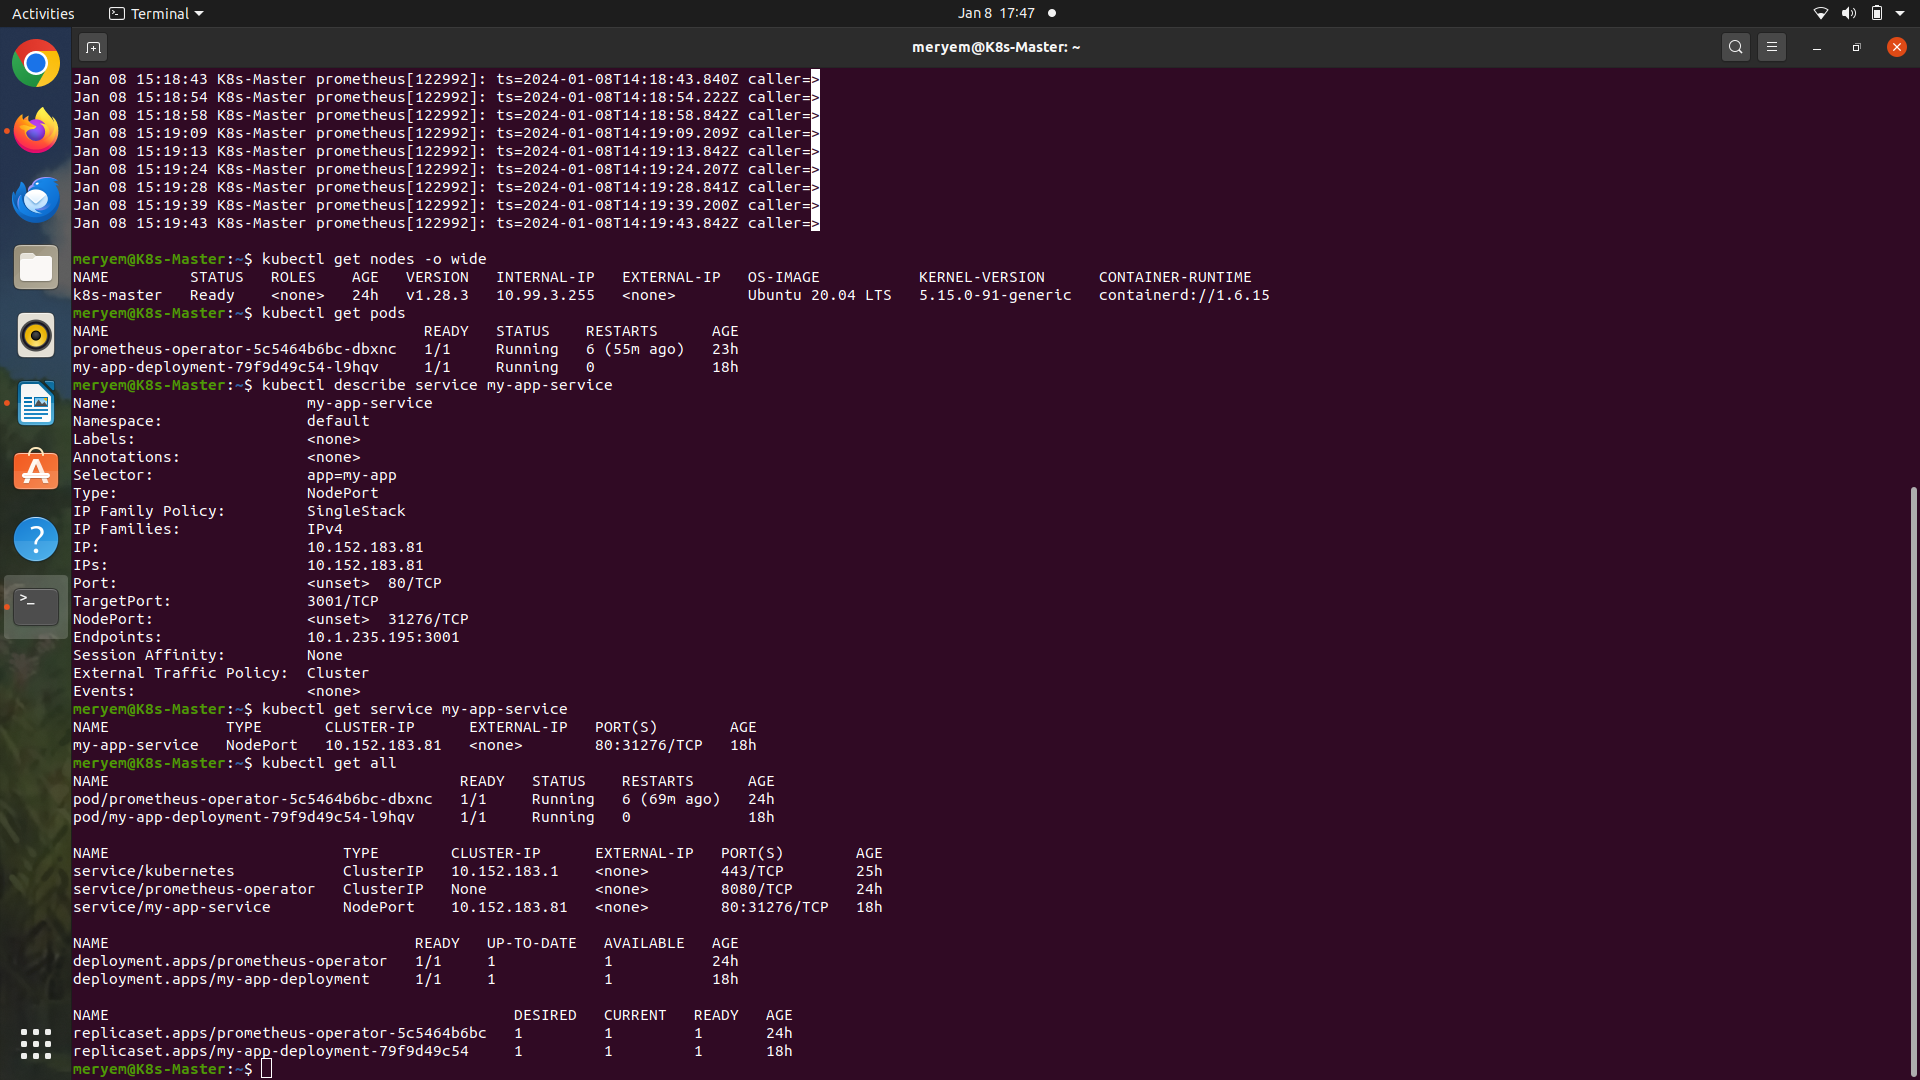
Kubernetes Deployment: Deploy applications to Kubernetes, ensuring scalability and efficient container management.
