RNASeq Analysis for Coastal Acidification, Sewage Effluent, and Multiple Stressors on Eastern Oyster Larvae -- The Puritz Lab of Marine Evolutionary Ecology
The Rational Behind Studying Multiple Stressors
Over 50% of the population of the United States of America and over 60% of the population of the world live in coastal areas (NOAA 2011; Vitousek 1997), and technological advances and the rampant resource demands of growing human populations have led to massive alteration and exploitation of coastal water ecosystems (USCOP 2004; POC 2003), particularly in areas with higher human population densities (Halpern et al. 2008). Despite an overwhelming recognition and focus on multiple stressors across the fields of marine science for the past 25 years, the cumulative impact of multiple human stressors still remains relatively unknown (Crain et al. 2008, 2009, Griffen et al. 2016). Past reviews of the interactions and impacts of multiple stressors have failed to identify common patterns or unifying concepts across studies (Crain et al. 2008, Griffen et al. 2016). Griffen et al. (2016) suggest that this failure is due to most studies investigating multiples stressors focusing on “phenomenological” effects of multiple stressors (such as mortality or growth) without investigating the underlying mechanisms for these responses (such as protein expression or energy budgets).
Coastal Acidification
For coastal and estuarine systems, atmospheric CO2 plays only a minor role in regulating overall pH dynamics (see Borgesa and Gypensb 2010, Provoost et al. 2010, Cai et al. 2011, Hofmann et al. 2011), and the most widespread driver of coastal carbonate chemistry is CO2 generated from microbial and macrofaunal respiration. Nutrient inputs from rivers and atmospheric deposition drive primary production which, in turn, stimulates respiration and acidification. The tight coupling between nutrient inputs and primary production makes the carbonate chemistry of coastal waters particularly sensitive to human activity. The anthropogenic acidification of coastal waters, or “coastal acidification” (CA) is driven largely by eutrophication, or excess nutrient loading.
Sewage Effluent
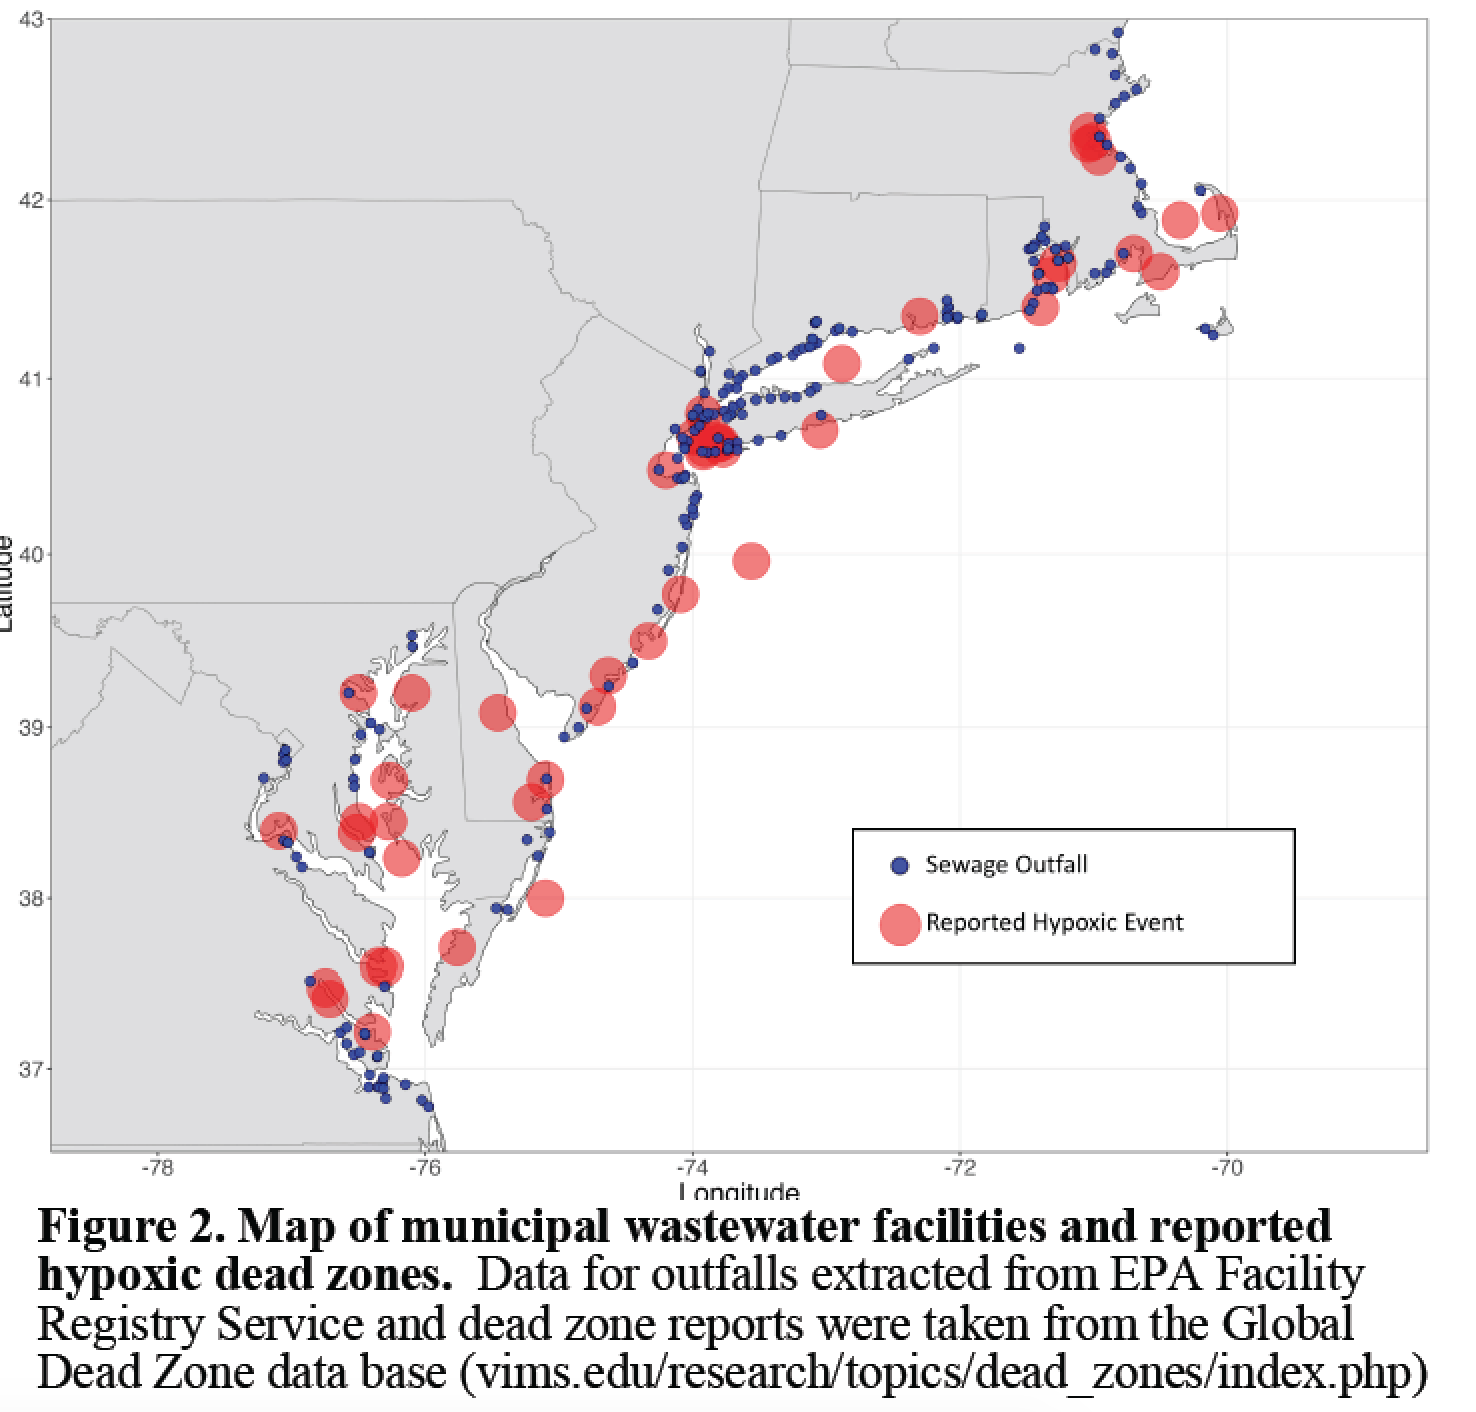
One of the largest inputs of nutrients into coastal ecosystems is sewage effluent discharged from municipal wastewater treatment facilities. The sheer volume is staggering. For example, in Massachusetts, over 2.98 billion liters of treated sewage effluent enter local water ways (MIIC 2007) every dry day, with Massachusetts Water Resources Authority averaging 1.4 billion liters being discharged from the Deer Island Waste Water Treatment Plant daily. Narragansett Bay, RI has over 768 million liters discharged daily (Narragansett Bay Estuary Program 2017), and Long Island Sound has over 3.8 billion liters discharged everyday.
Recent work by Wallace et al. (2014) provided the first evidence that wastewater effluent from sewage treatment plants is a point source of acidification in coastal and estuarine waters. The authors found that estuarine water with in several kilometers of sewage outfall sites hat pCO2 levels near or above 1000 μatm, and found that surface waters near sewage effluent had nearly the same low pH and high pCO2 levels commonly found in bottoms waters during the summer and fall.
Experimental Design and Treatments
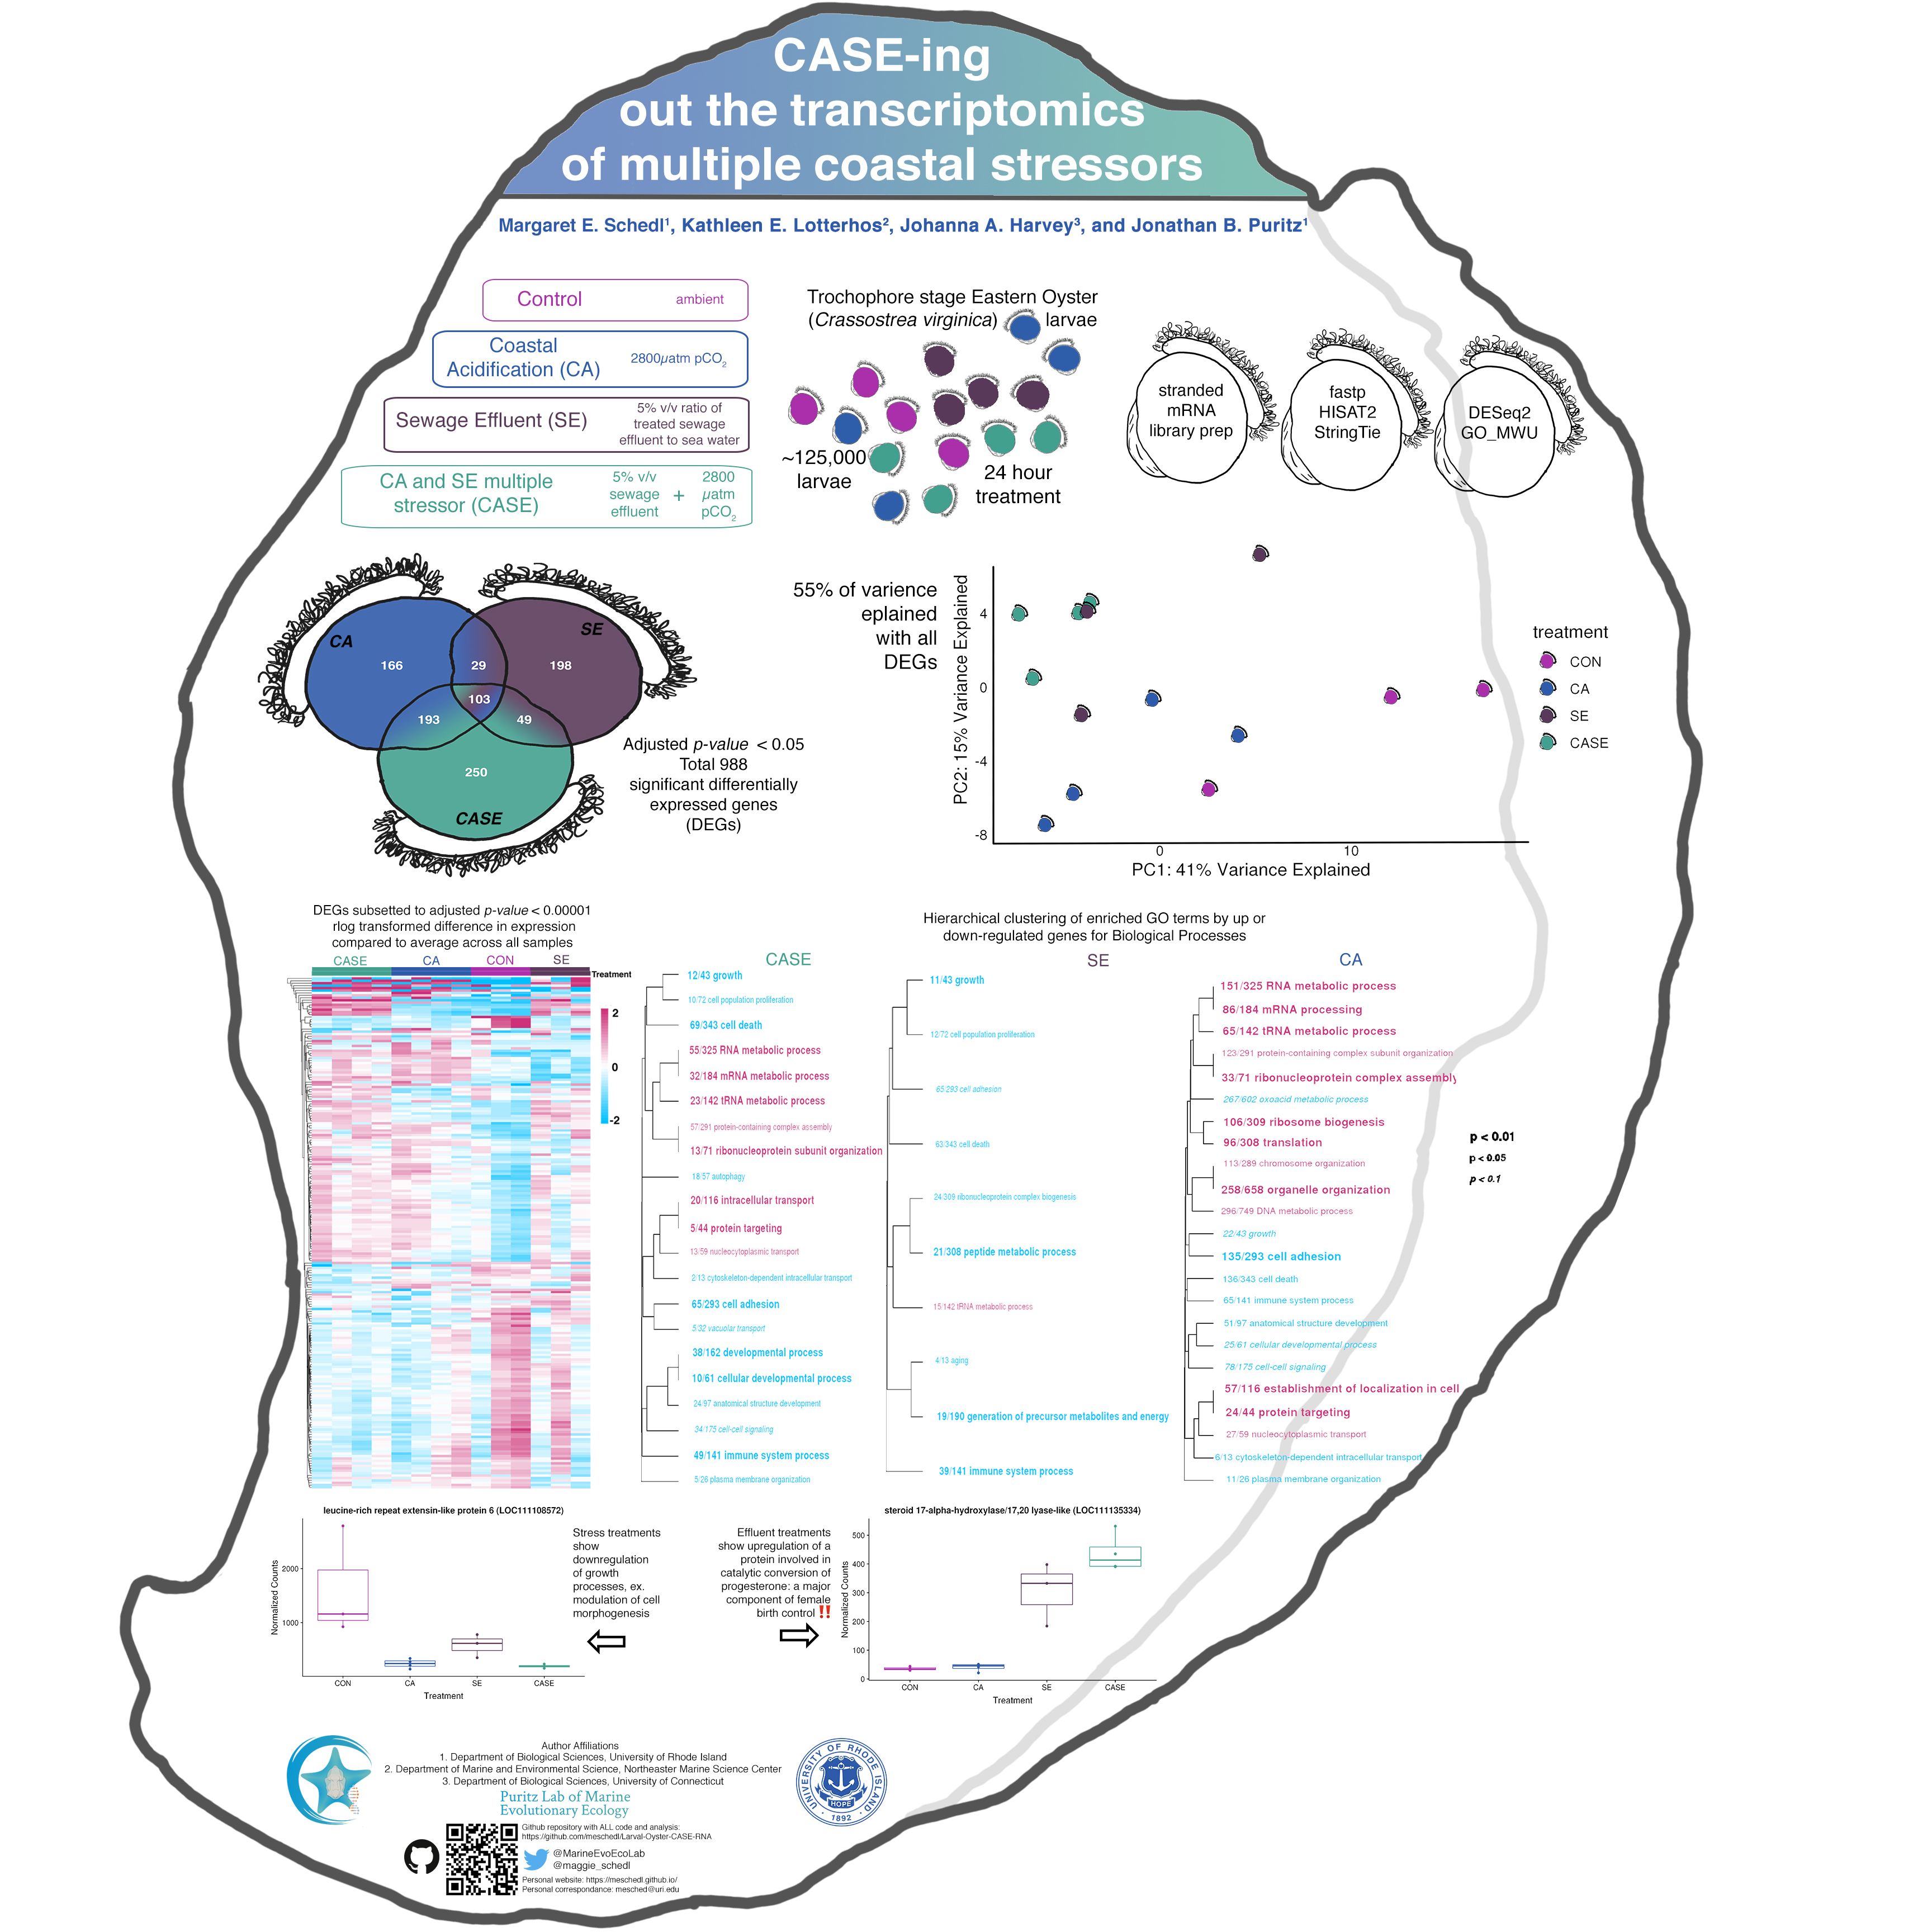
During the summer of 2017, exposure trials were conducted using larvae from the eastern oyster (Crassostrea virginica). Wild adult broodstock were collected from Ipswich, MA and Barnstable, MA, and brought into the lab and conditioned for several weeks. Oysters were spawned via thermal induction and eggs from 7 females were fertilized with sperm 11 males. Larvae were kept in ambient, filtered sea water for 16 hours to ensure all embryos had developed to the trochophore larval stage. After 16 hours, larvae were counted and approximately ~125,000 larvae were transferred to twelve 1 L glass mesocosms and four replicate 100,000 larvae subsamples were flash frozen. Ambient water was adjusted to 100 mL and larvae were allowed to acclimate for 1 hour. After acclimation, one of four treatments were randomly assigned to each mesocosm (4 per treatment): CON-Control conditions, CA- Coastal Acidification treatment of ~2800 µatm pCO2 sea water, SE- Sewage Effluent treatment of 5% volume to volume ratio of treated sewage effluent to sea water, CASE- Coastal Acidification and Sewage Effluent treatment of 5% volume to volume ratio of treated sewage effluent to sea water ~2800 µatm pCO2.
The larvae were then filtered out of their experimental bottles and flash frozen to preserve the DNA and RNA. For this project RNA extracted from 1 replicate block of CA, CON, SE, and CASE treatments (14 samples, 4 CA, 3 SE, 3 CON, and 4 CASE) were prepped with the KAPA Biosystems Stranded mRNA Seq kit and sequenced with one Full HiSeq lane from Novogene.
Steps of Analysis:
- Looking at read counts
- QC, visualization, and trimming of reads
- Using HISAT2 to align reads to the Eastern Oyster genome
- Using StringTie to assemble alignments to transcripts with the Eastern Oyster annotation file
- Converting StringTie output into a transcript count matrix for DESeq2
- Using DESeq2 to visualize data and look at log2 fold changes in expression levels between the treatments and control
- Rank-based Gene Ontology analysis of gene expression data with GO_MWU
Quick Navagation
- Read QC, trimming, alignment, and transcript assembly are in the CASE-RNASeq-Analysis.md file.
- Outputs from those programs are in the outputs folder.
- StringTie output file conversion into gene count matrixes for DESeq2 is with prepDE.py, this script is from here.
- Differential expression analysis is in the DESeq2_CASE_RNA.md along with all code for making figures.
- Preparation of p-values for GO_MWU is in the Signed-Neg-Log-Pvalue.R script.
- Preparation of results files and GO terms with the GO_MWU_Prep.md markdown.
- Other scripts for GO_MWU are also in the scripts folder, and are available from the source here
- GO_MWR.R including the files from this analysis.
Poster from the Evolution Meeting 2019

