This fork contains following changes:
- Updated Grafana to version 6.0.0
- StatsD is configurable when container is started for the first time through these environment variables:
STATSD_FLUSH_INTERVAL(Default: 10000)STATSD_GRAPHITE_PREFIX(Default:stats)STATSD_GRAPHITE_PREFIX_COUNTER(Default:counters)STATSD_GRAPHITE_PREFIX_TIMER(Default:timers)STATSD_GRAPHITE_PREFIX_GAUGE(Default:gauges)STATSD_GRAPHITE_PREFIX_SET(Default:sets)STATSD_DELETE_GAUGES(Default:false)STATSD_DELETE_TIMERS(Default:false)STATSD_DELETE_SETS(Default:false)STATSD_DELETE_COUNTERS(Default:false)
- Grafana dashboards and datasources directories are now volumes so we can specify them in startup time rather than build time
- Dashboards and datasources are imported into Grafana only if the dashboard/datasource with that specific identifier does not already exist. Otherwise it is just ignored.
- Plugins can be installed to Grafana using environmental variable
GRAFANA_PLUGINSwhere you supply colon separated list of plugin names that you would supply tografana-cli plugin install. - Retention of Graphite data is set to
1m:7dinstead of10s:7d.
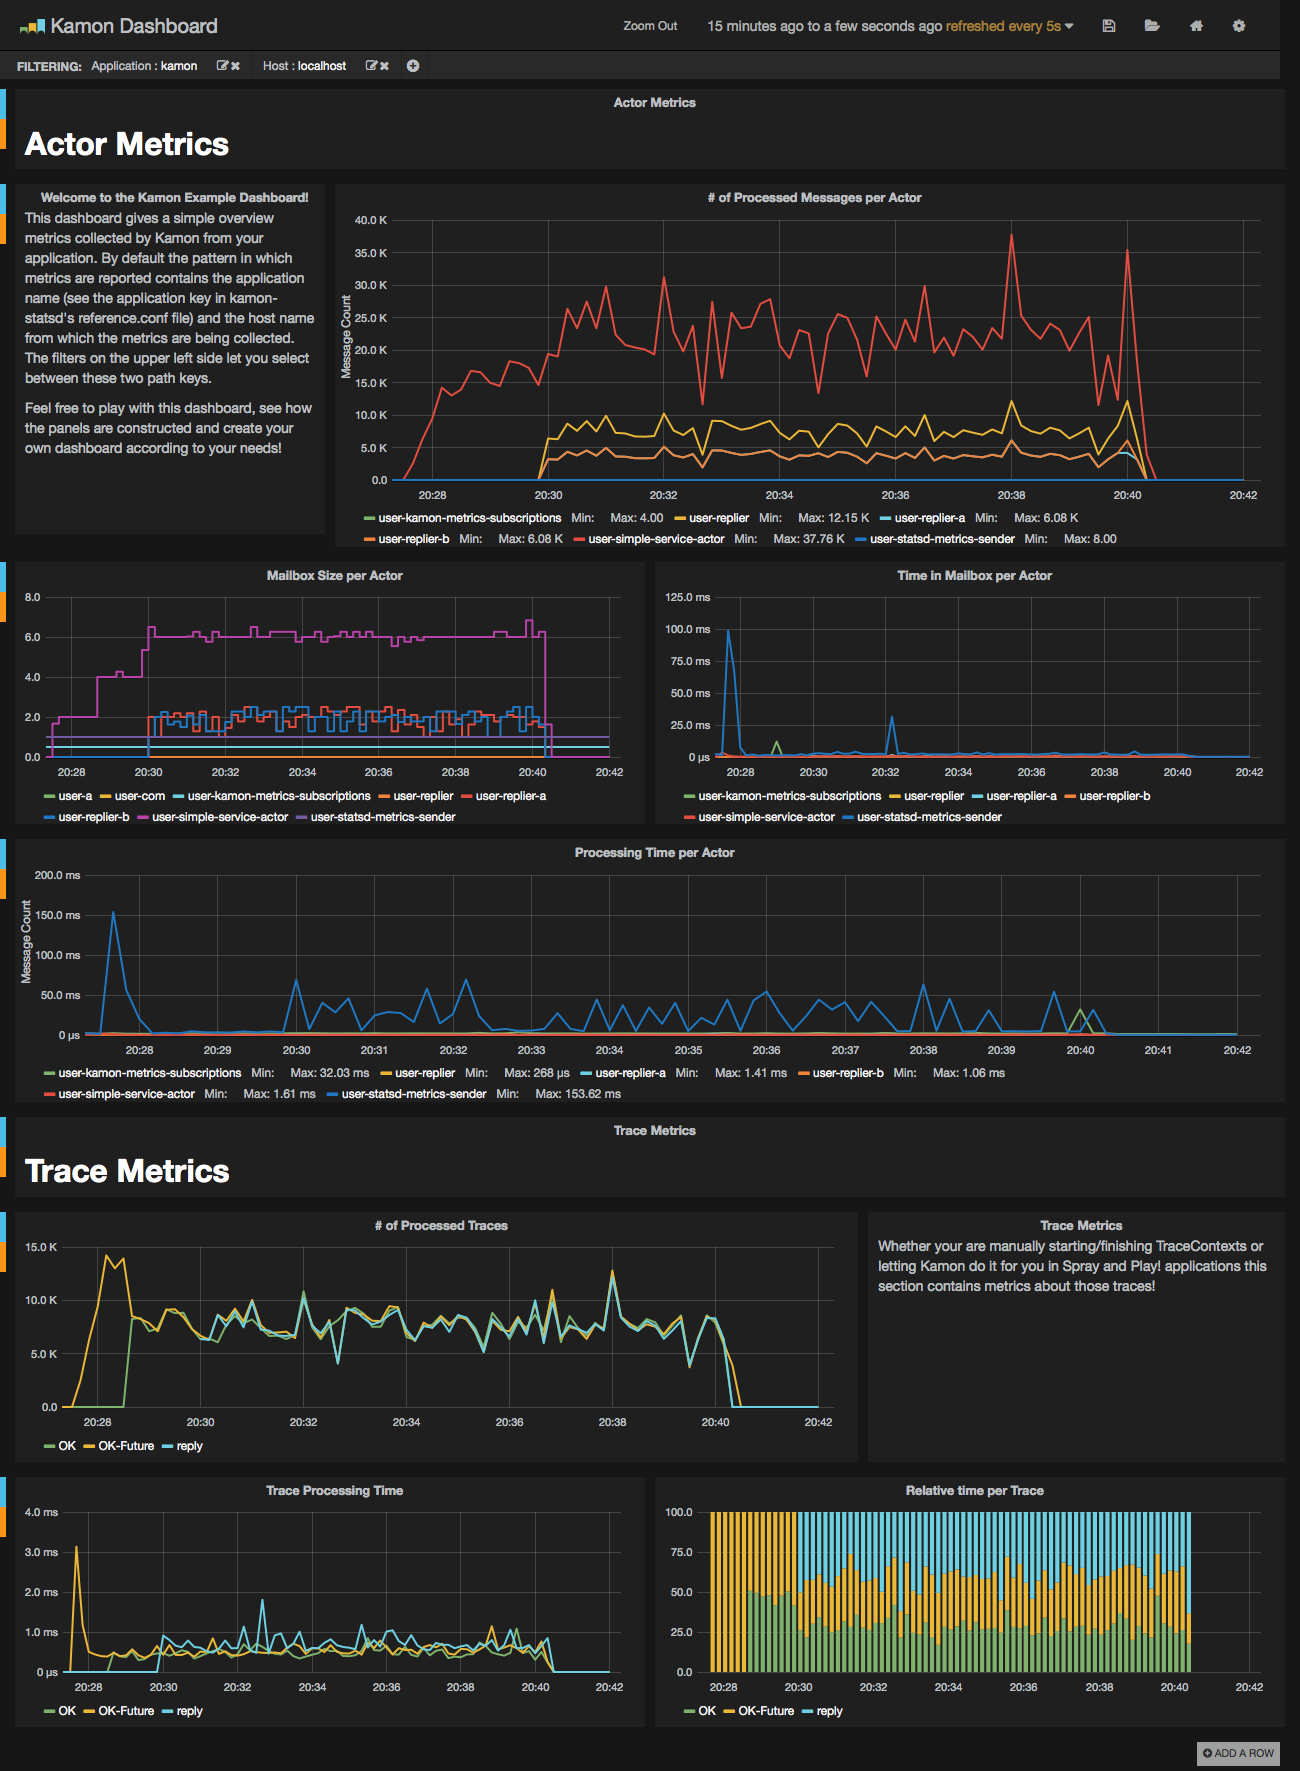
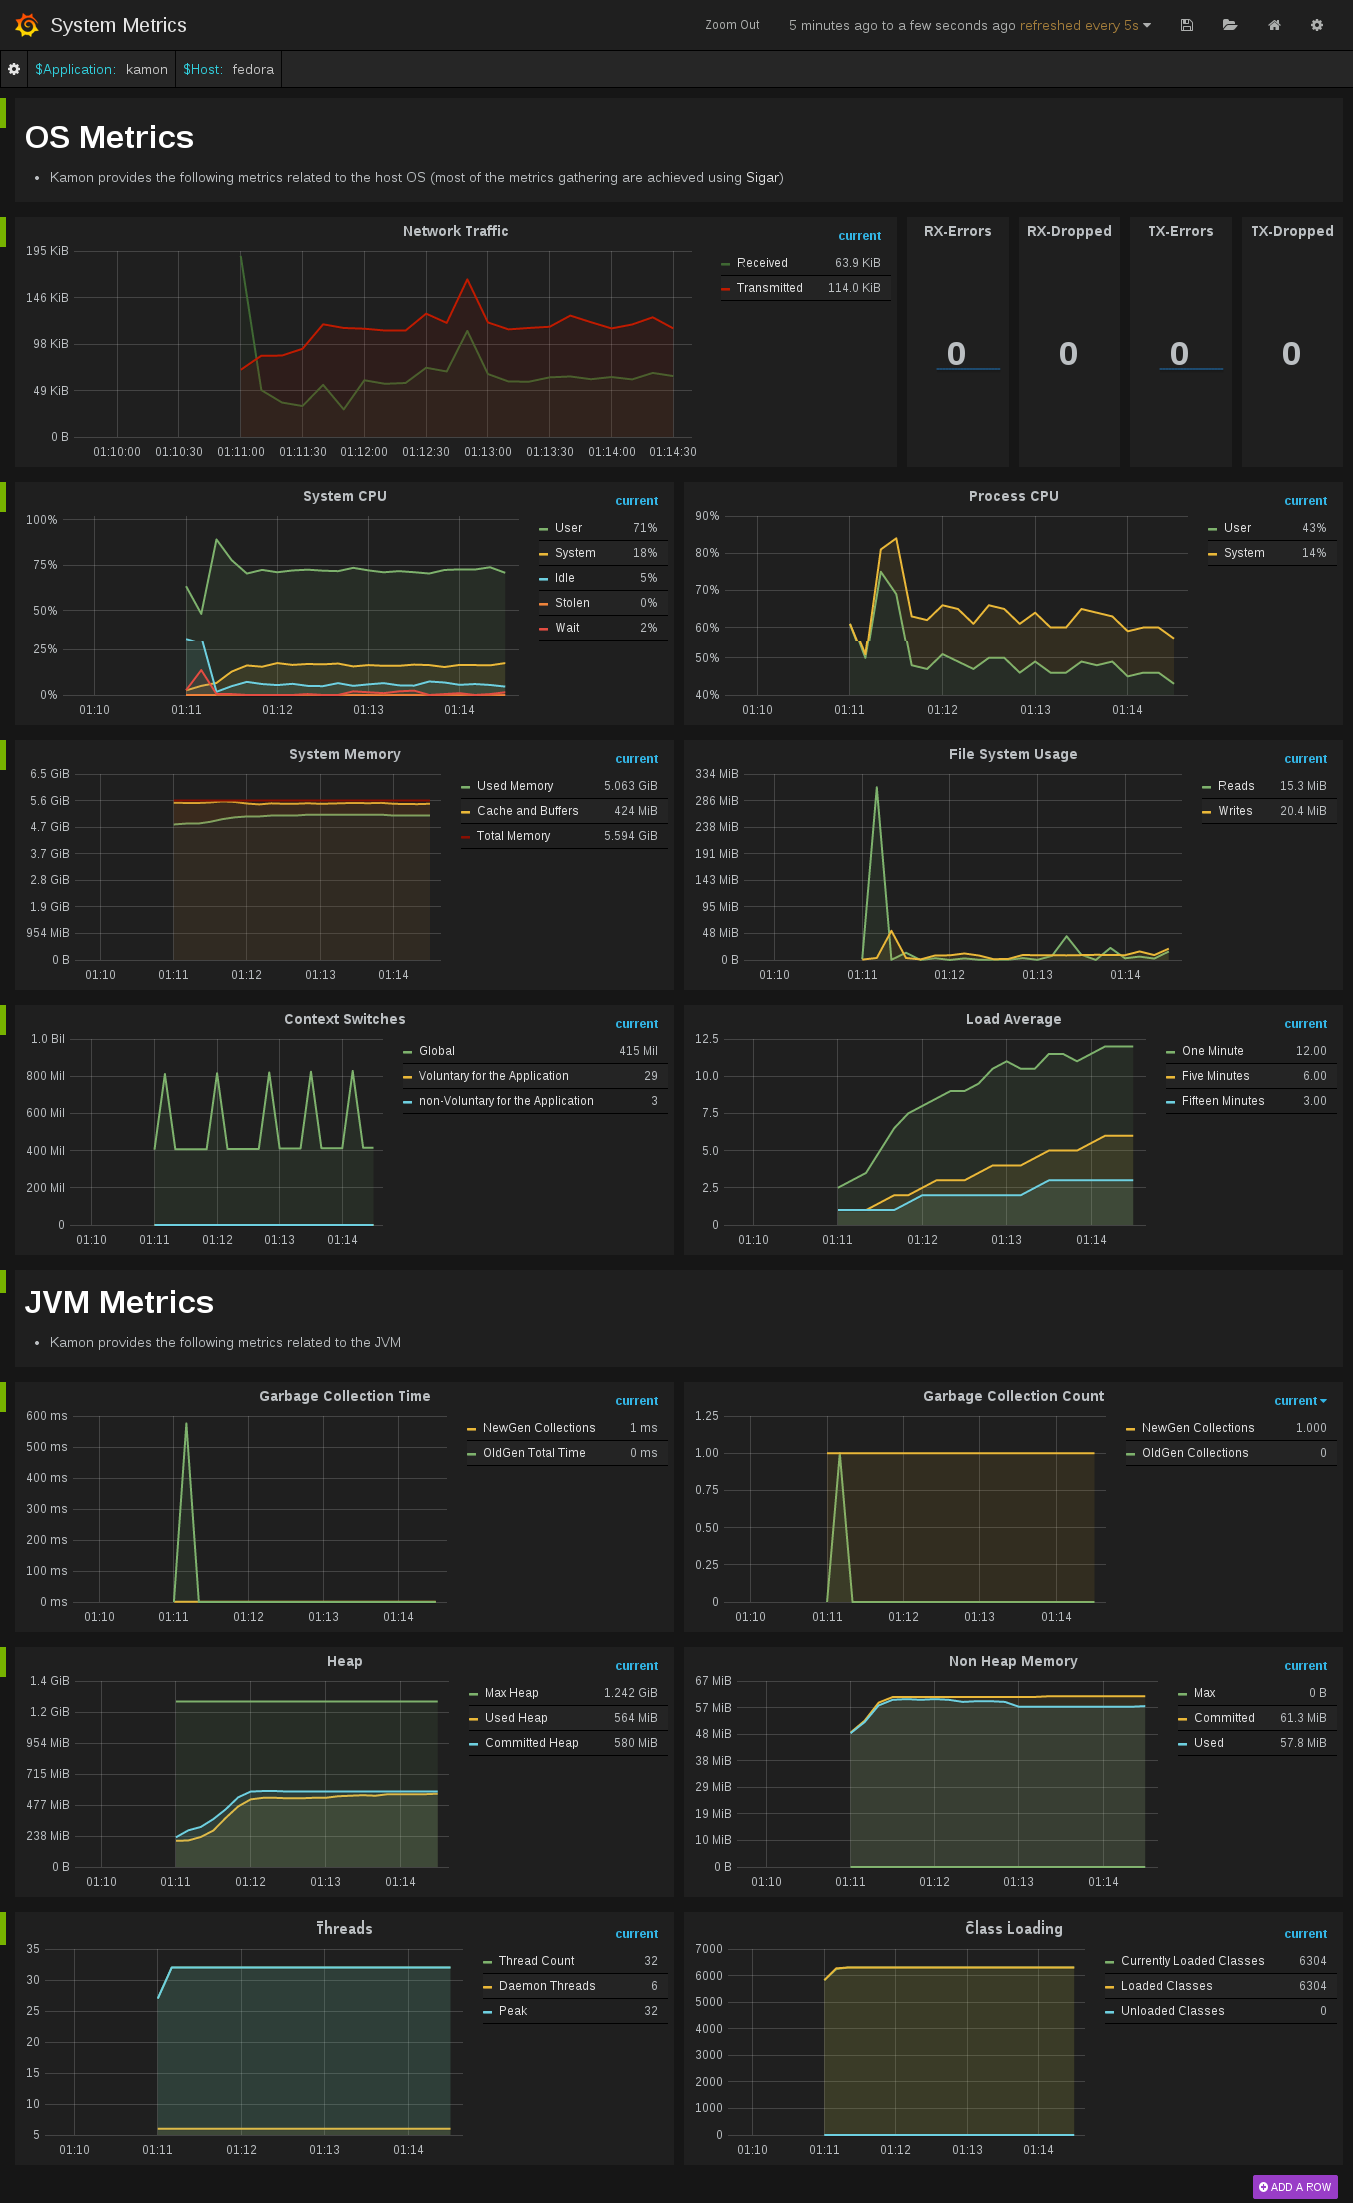
This image contains a sensible default configuration of StatsD, Graphite and Grafana, and comes bundled with a example dashboard that gives you the basic metrics currently collected by Kamon for both Actors and Traces. There are two ways for using this image:
This image is published under Kamon's repository on the Docker Hub and all you
need as a prerequisite is having docker, docker-compose, and make installed on your machine. The container exposes the following ports:
80: the Grafana web interface.81: the Graphite web port2003: the Graphite data port8125: the StatsD port.8126: the StatsD administrative port.
To start a container with this image you just need to run the following command:
$ make upTo stop the container
$ make downTo run container's shell
$ make shellTo view the container log
$ make tailIf you already have services running on your host that are using any of these ports, you may wish to map the container
ports to whatever you want by changing left side number in the --publish parameters. You can omit ports you do not plan to use. Find more details about mapping ports in the Docker documentation on Binding container ports to the host and Legacy container links.
The Dockerfile and supporting configuration files are available in our Github repository. This comes specially handy if you want to change any of the StatsD, Graphite or Grafana settings, or simply if you want to know how the image was built.
Once your container is running all you need to do is:
- open your browser pointing to http://localhost:80 (or another port if you changed it)
- Docker with VirtualBox on macOS: use
docker-machine ipinstead oflocalhost
- Docker with VirtualBox on macOS: use
- login with the default username (admin) and password (admin)
- open existing dashboard (or create a new one) and select 'Local Graphite' datasource
- play with the dashboard at your wish...
When running make up, directories are created on your host and mounted into the Docker container, allowing graphite and grafana to persist data and settings between runs of the container.
We hope that you have a lot of fun with this image and that it serves it's purpose of making your life easier. This should give you an idea of how the dashboard looks like when receiving data from one of our toy applications: