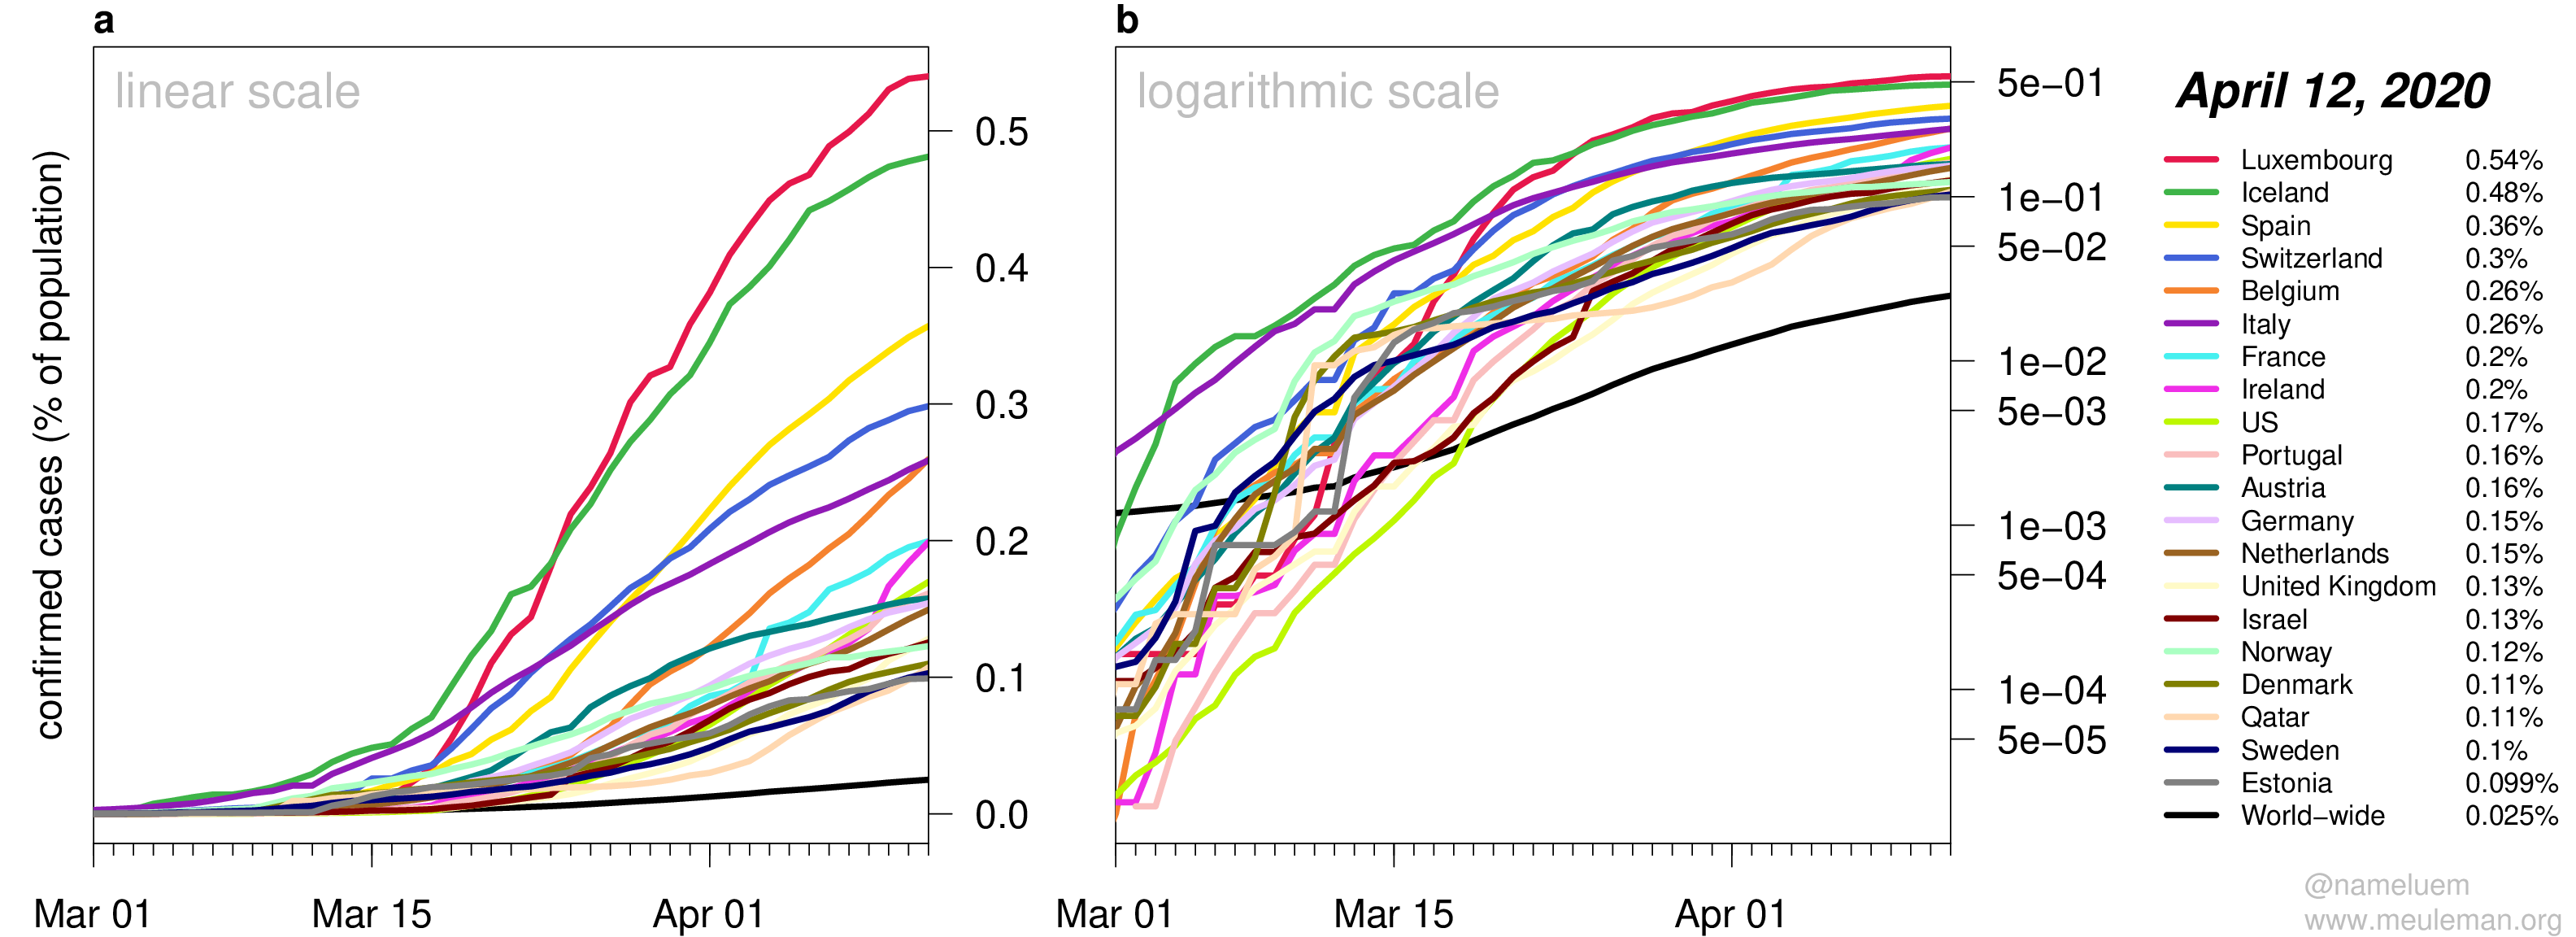
I was interested in seeing what percentage of the population is (confirmed to be) affected by the COVID-19 coronavirus, and how these case numbers are growing over time for individual regions and countries.
Figures get updated daily as long as data remain available (h/t @JHUSystems).
More information here: https://www.meuleman.org/project/chasingcorona/
DISCLAIMER: I am not a virologist or epidemiologist – I realize there are many caveats to interpreting these data.
We do not nearly have enough data to make precise estimates, in particular because of the relatively small number of tests performed in most countries.
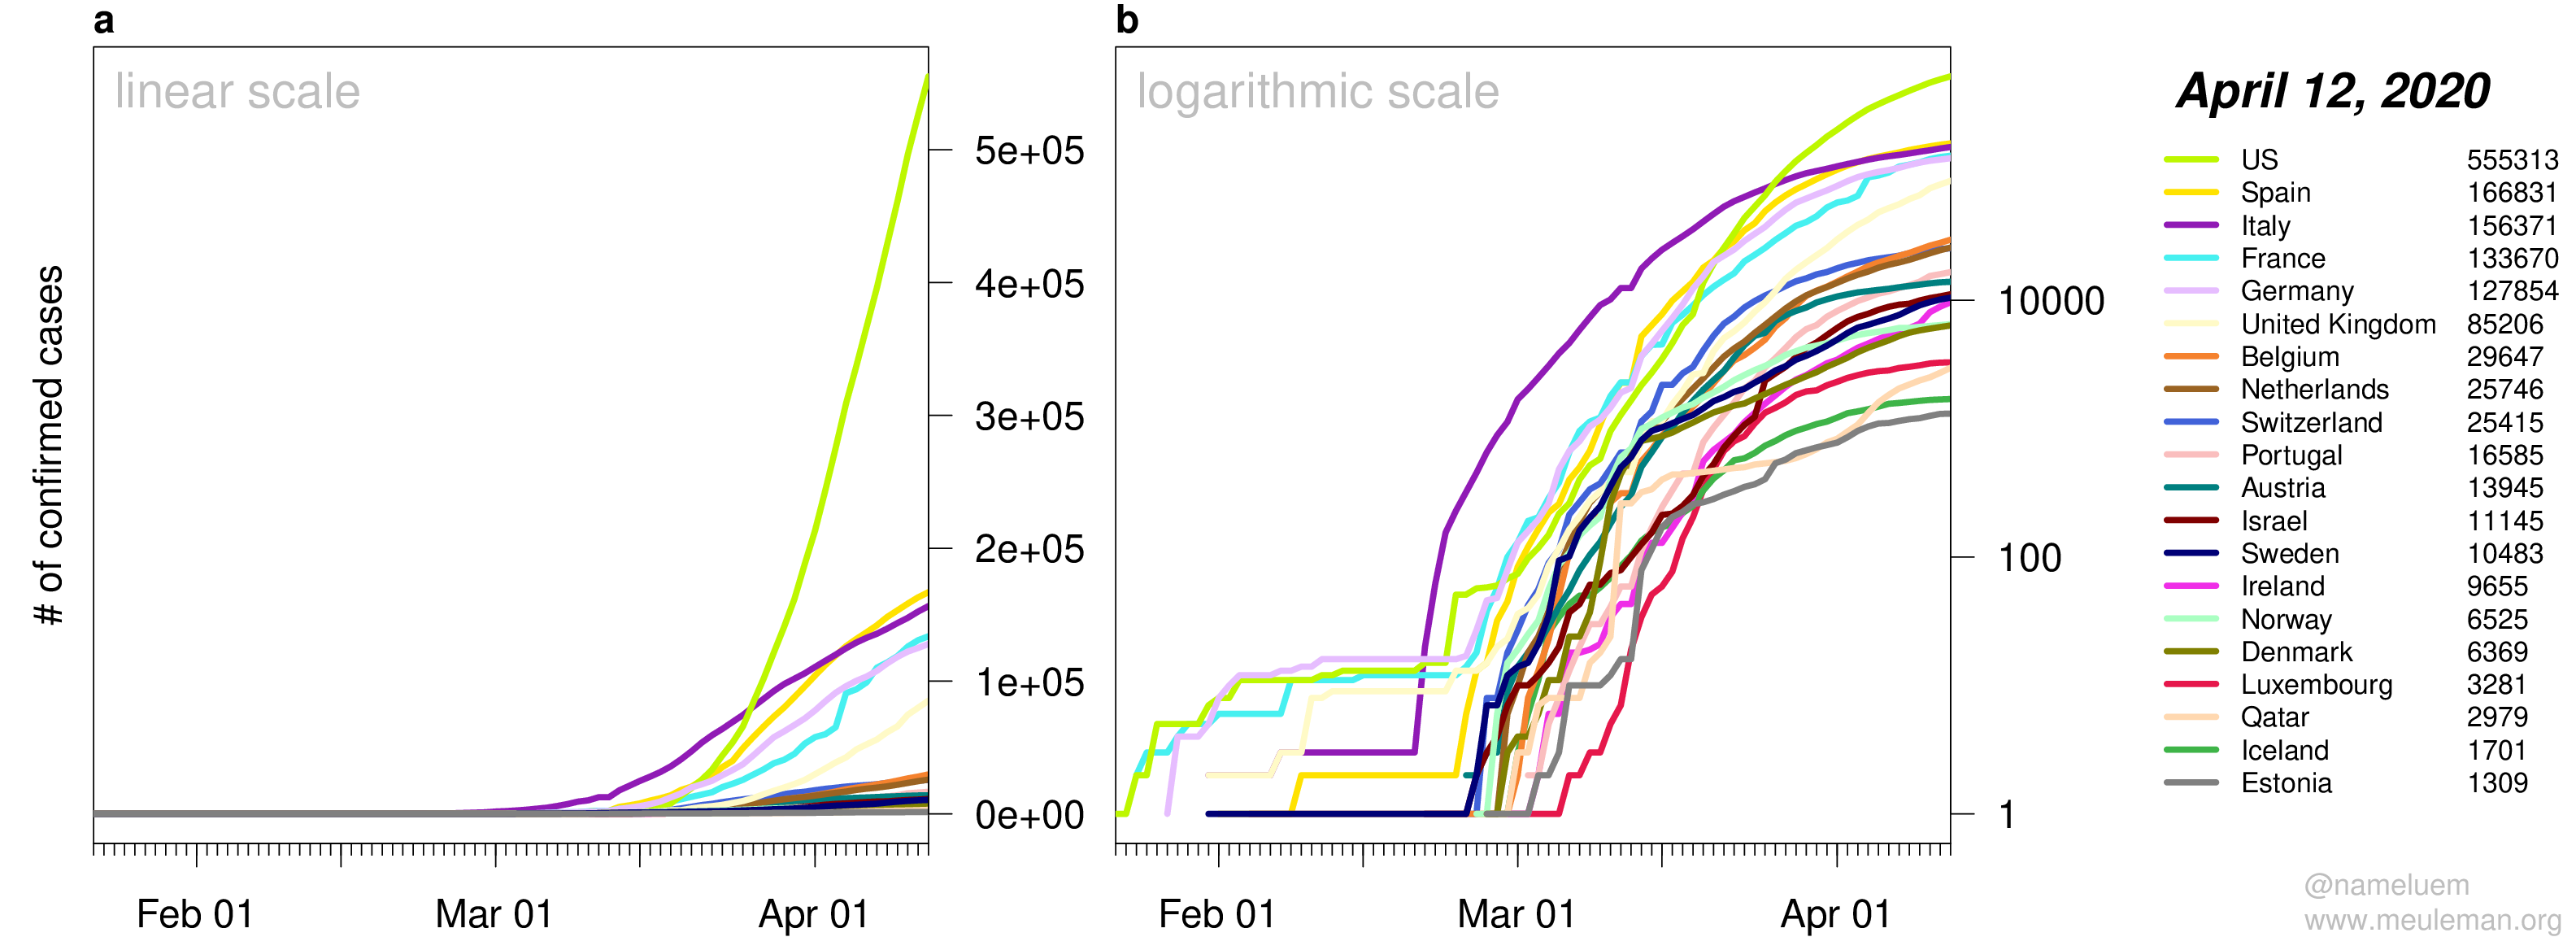
This is essentially the Johns Hopkins University per-country data for "confirmed cases", divided by the per-country 2018 population counts, as estimated and provided by the World Bank. Shown are the top 20 countries in terms of percent population confirmed to be COVID-19 cases.
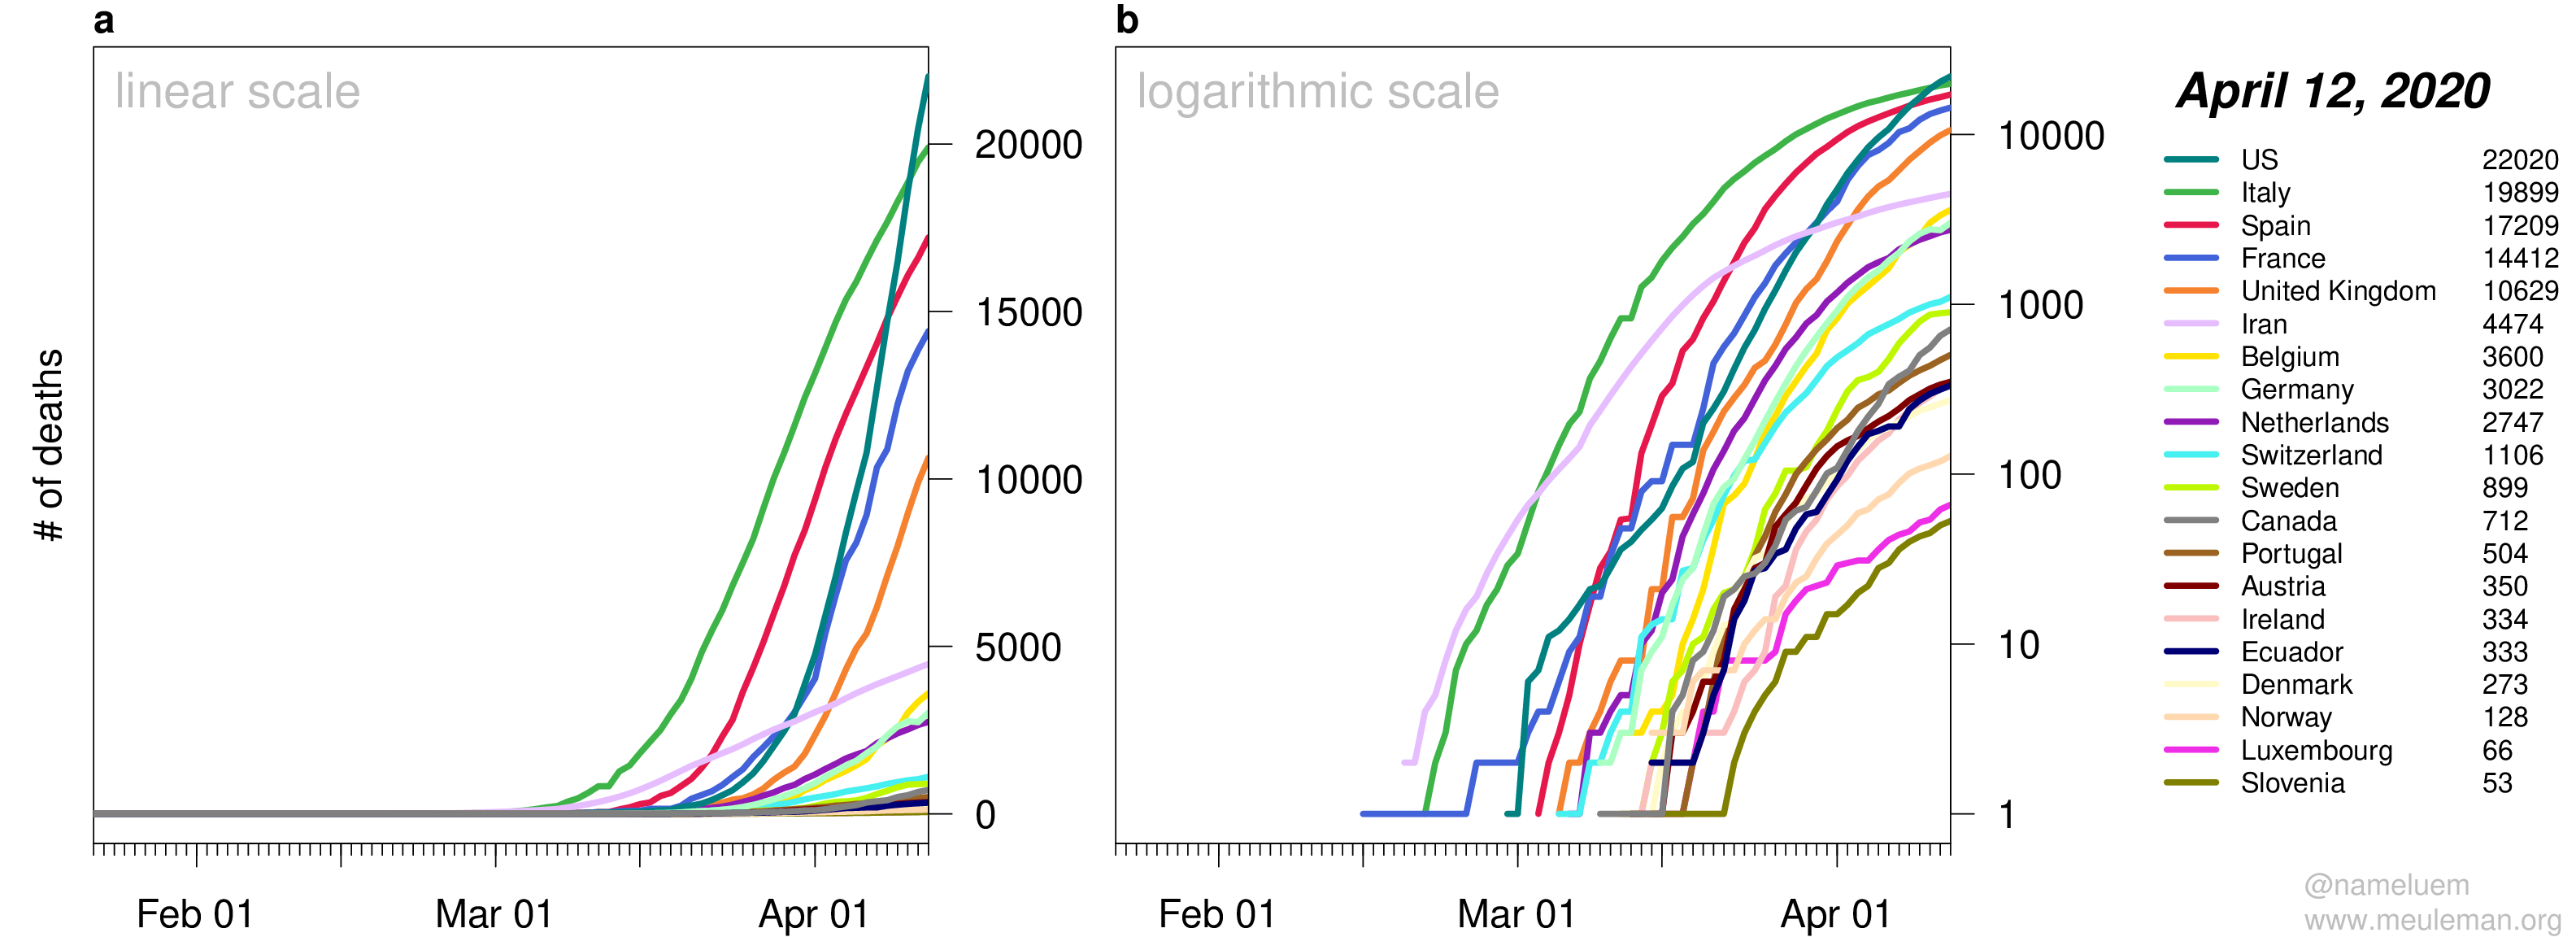
Data are shown on a linear and a logarithmic scale, because of the observed exponential growth of confirmed cases.
The slope of the exponential curves tells us something about how fast the virus spreads.
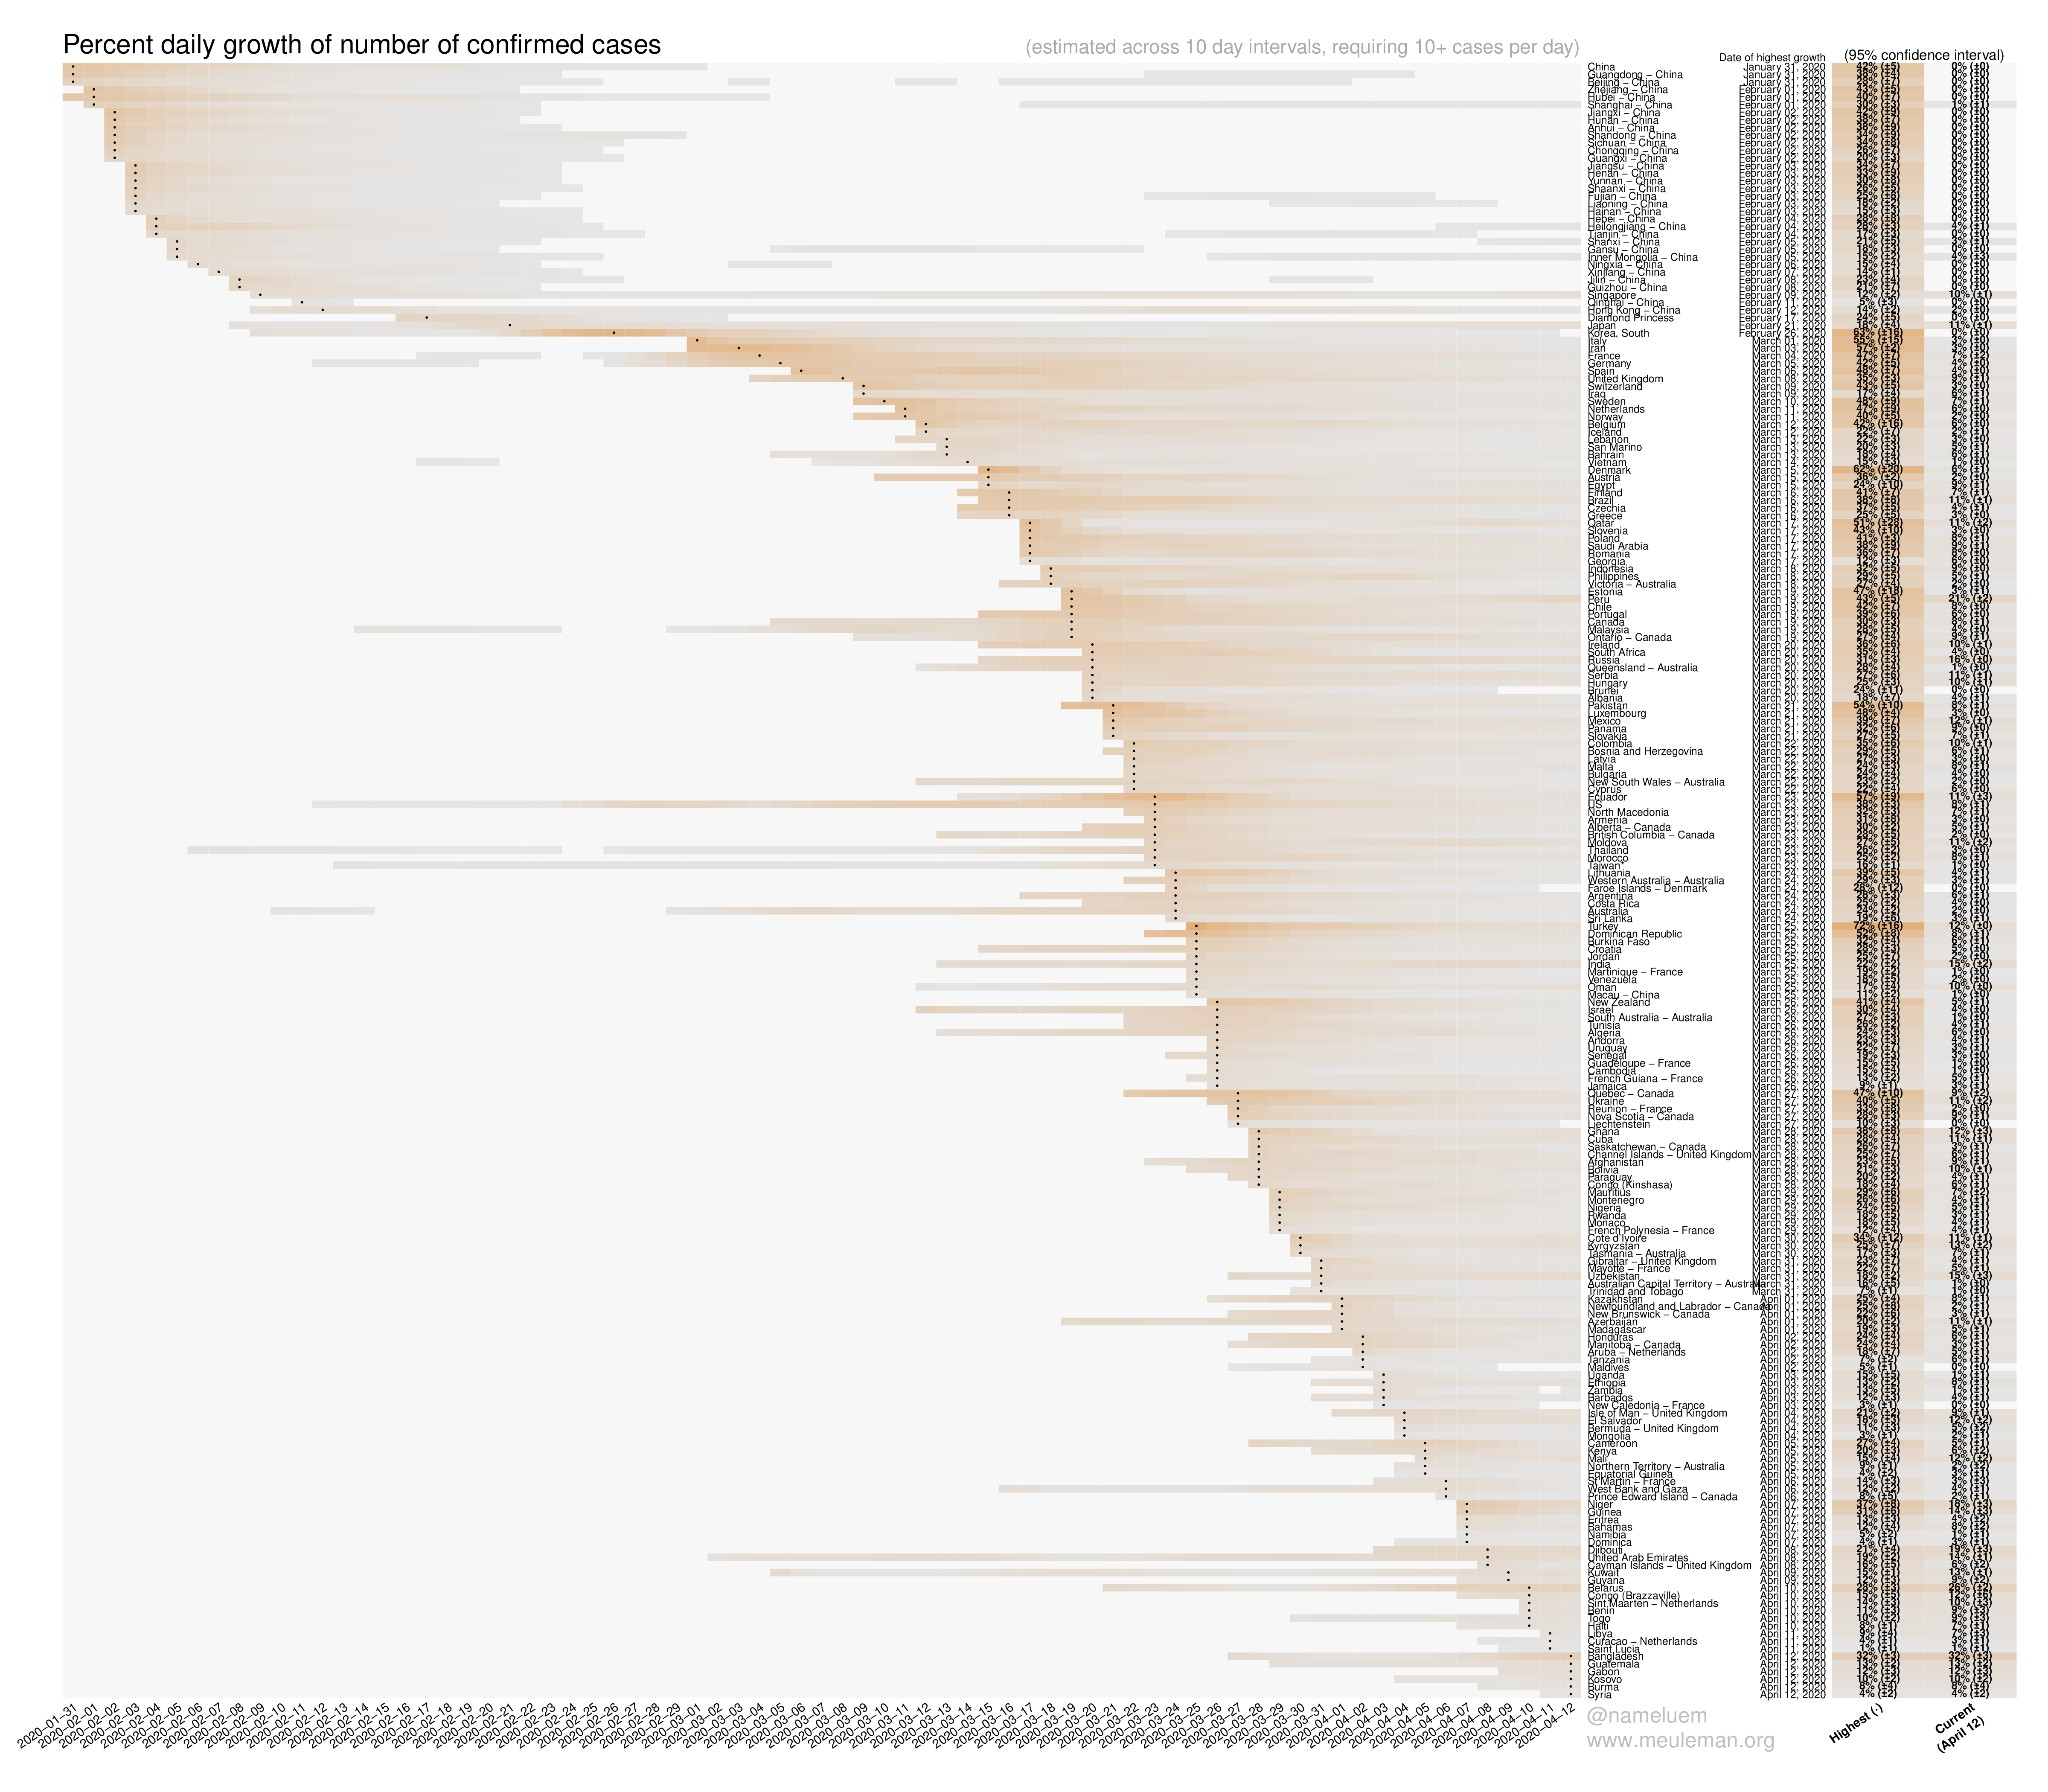
These rates can be expressed in terms of daily percent new cases, based on the number of confirmed cases over the course of the 10 previous days:
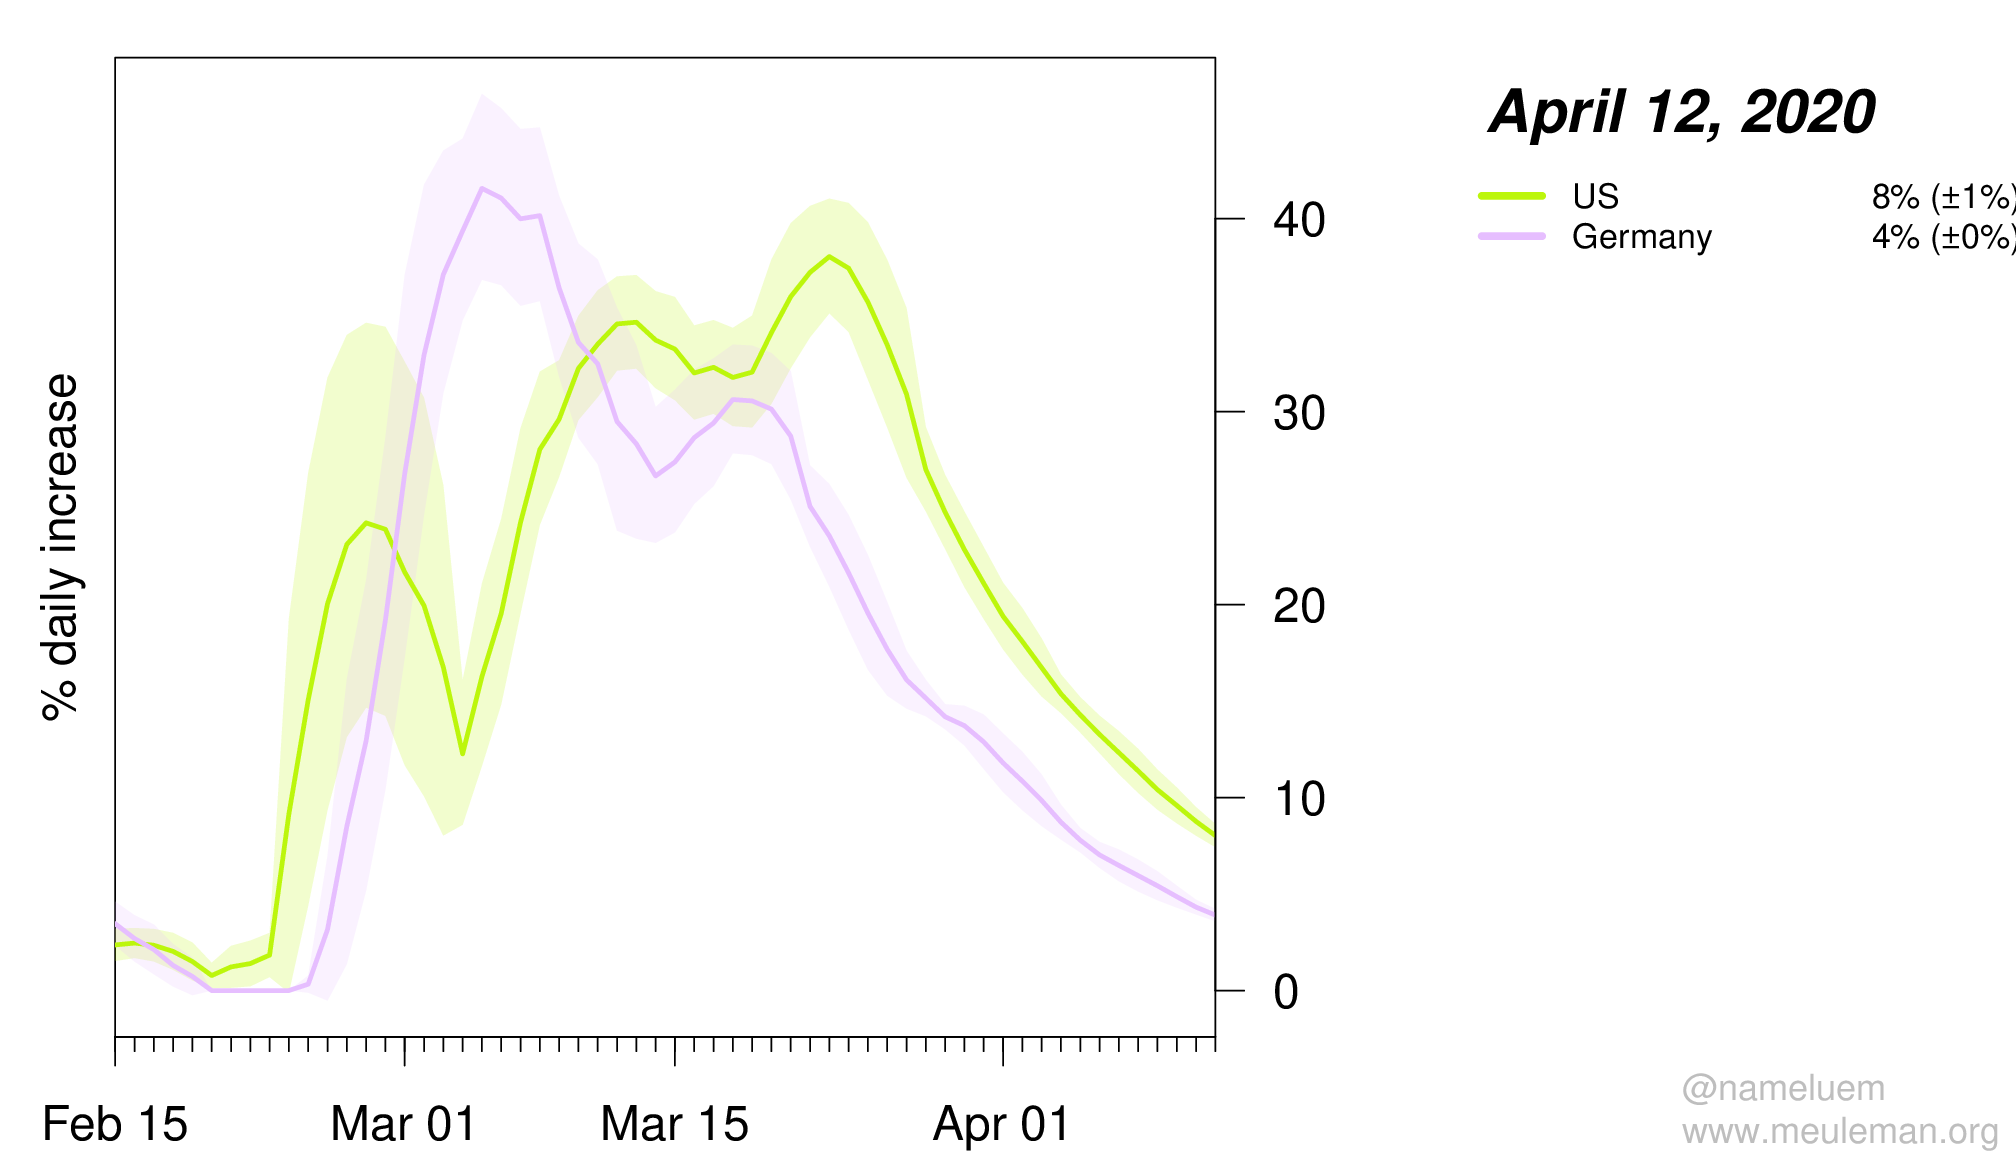 Data shown for selected example countries from the top 20 list above.
Percentages on the right are 10-day average daily growth rates for the most recent date indicated and include 95% confidence interval ranges.
This growth over time can be further generalized across all countries and regions with sufficient data points, as such:
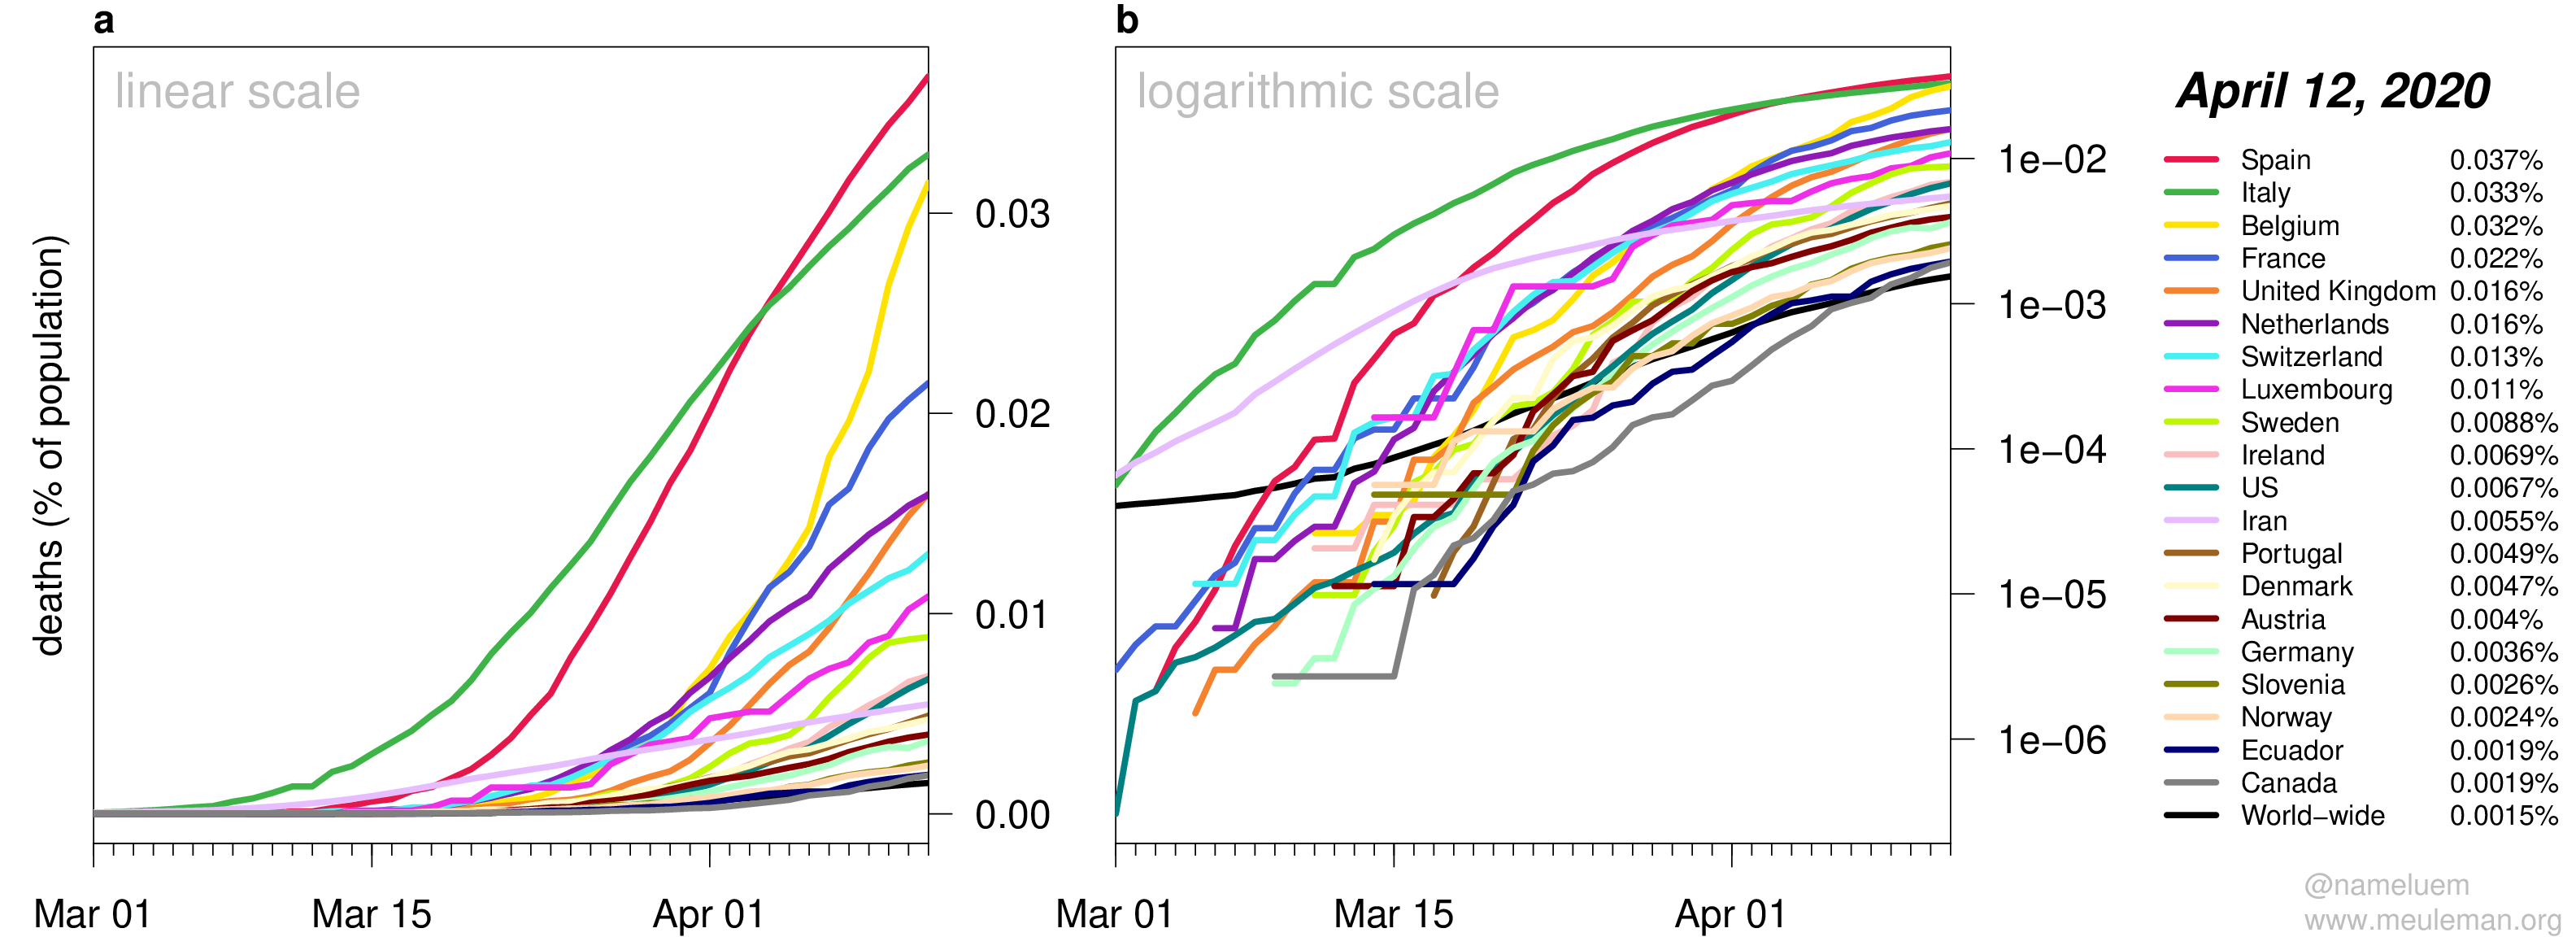
Shown are the top 20 countries in terms of percent of population died from COVID-19.
Data are shown on a linear and a logarithmic scale, because of the observed exponential growth of the number of deaths.
Number of confirmed cases (for the matching top20 %population confirmed cases countries shown above)
Number of deaths (for the matching top20 %population confirmed cases countries shown above)
