dbHive offers an interactive dashboard to visualize the performance of one or more PostgreSQL databases. By providing easily accessible information about the health and activity of a database, dbHive enables developers to make informed decisions that optimize the way they store their data.
- Fork and clone this repository to your machine.
- Navigate to the project directory and install dependencies.
npm install
- Enter the following command to start up dbHive.
npm start
- Navigate to http://localhost:3000.
- Create an account on the sign up page.
- Connect your database and get started!
- Fork and clone this repository to your machine.
- Navigate to the project directory. Either build the image or pull the latest from DockerHub:
docker build -t dbhive/main-prod .
or
docker pull dbhive/main-prod
- In the terminal, enter the following command:
docker-compose -f docker-compose-prod.yml up
- Navigate to http://localhost:3000.
- Create an account on the sign up page.
- Connect your database and get started!
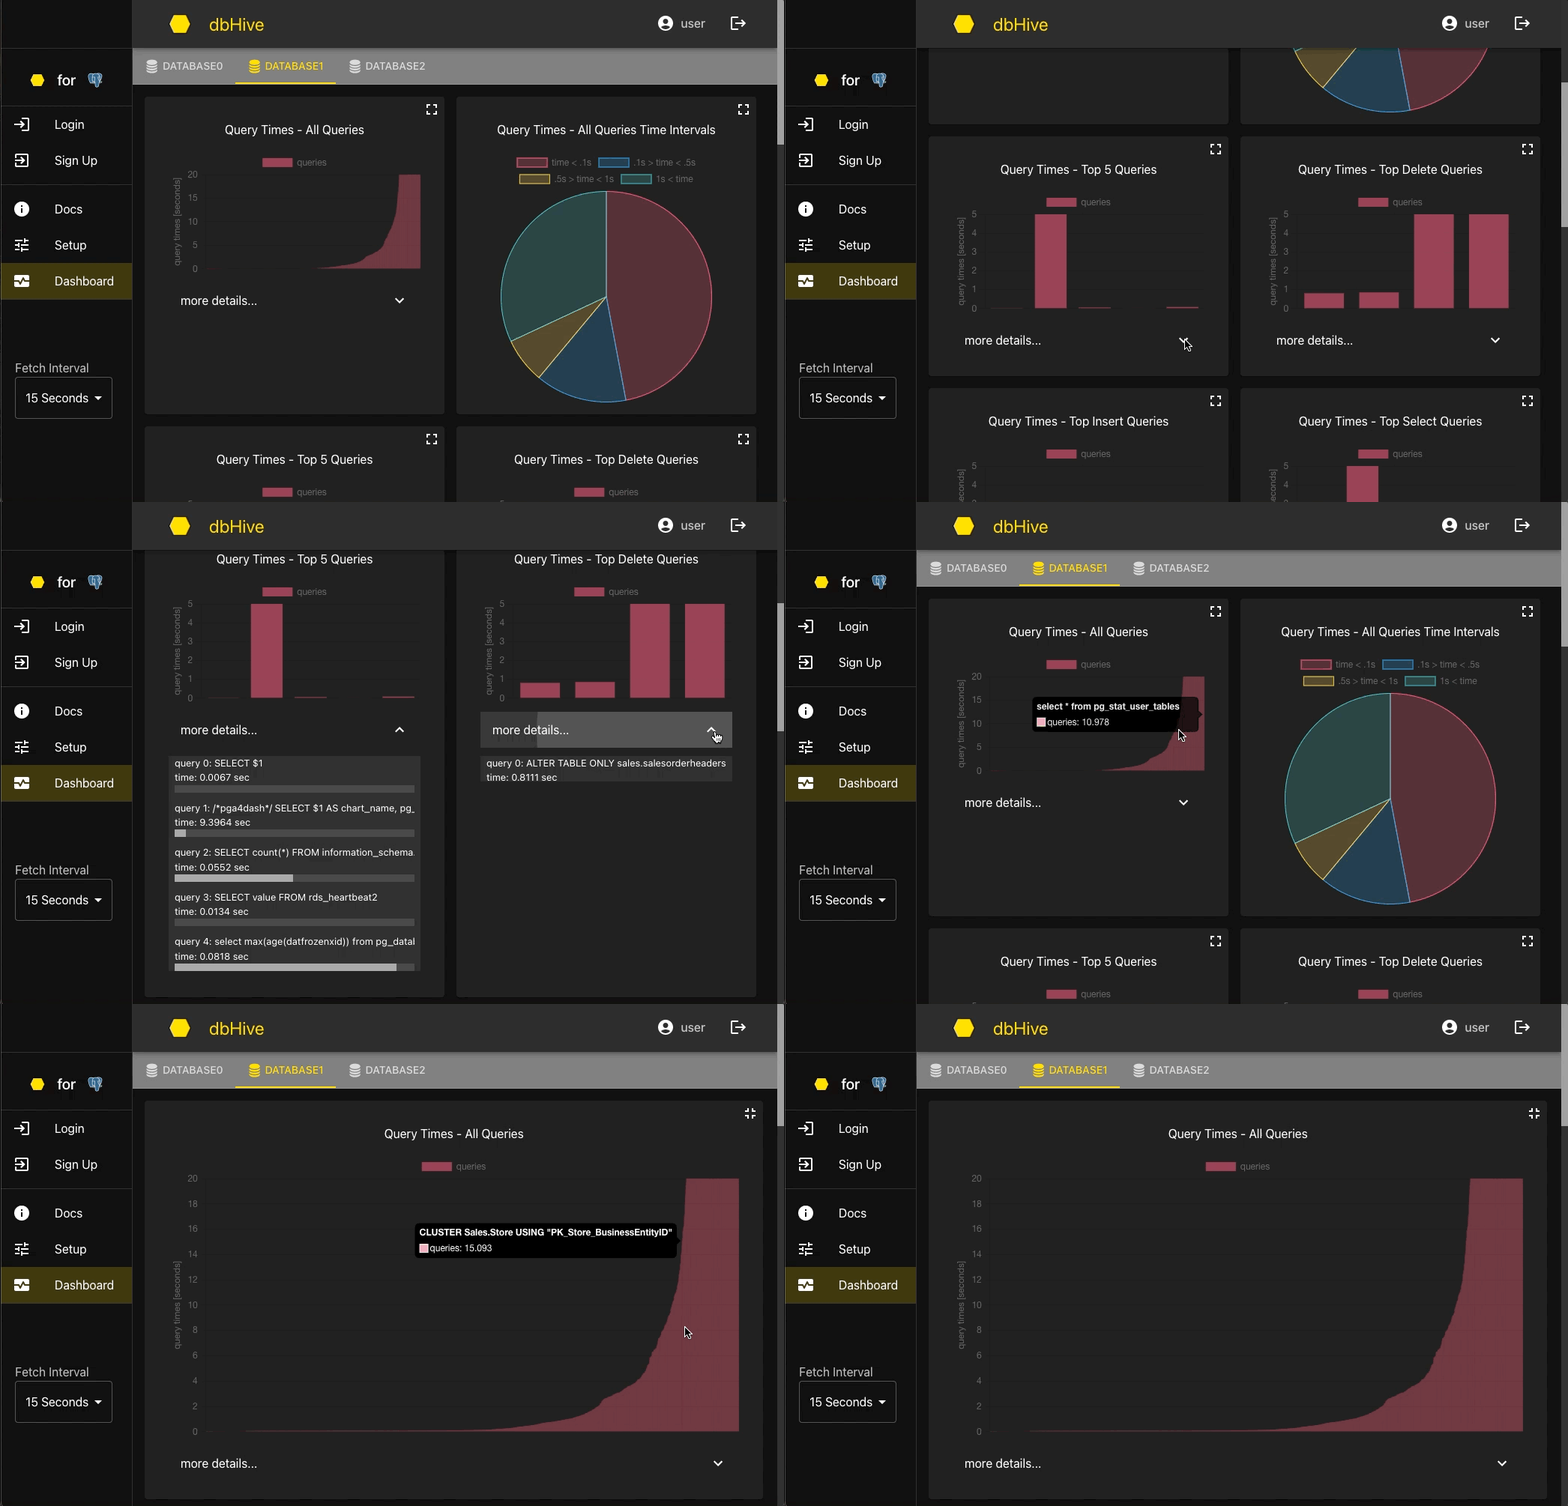
Get a broad sense of database performance by viewing average query times across the database, as well as averages for specific types of SQL queries. Pinpoint the slowest queries to gain insight for database improvement.
To analyze common and recurring database activity, view charts on the most frequent queries within and across all query types.
At a glance, gather other vital information, including:
- conflicts
- deadlocks
- rolled back transactions
- cache hit ratio
- block hits
- and more
Maintain privacy and security with dbHive's required secure login. All database information and metrics are protected with encrypted accounts.
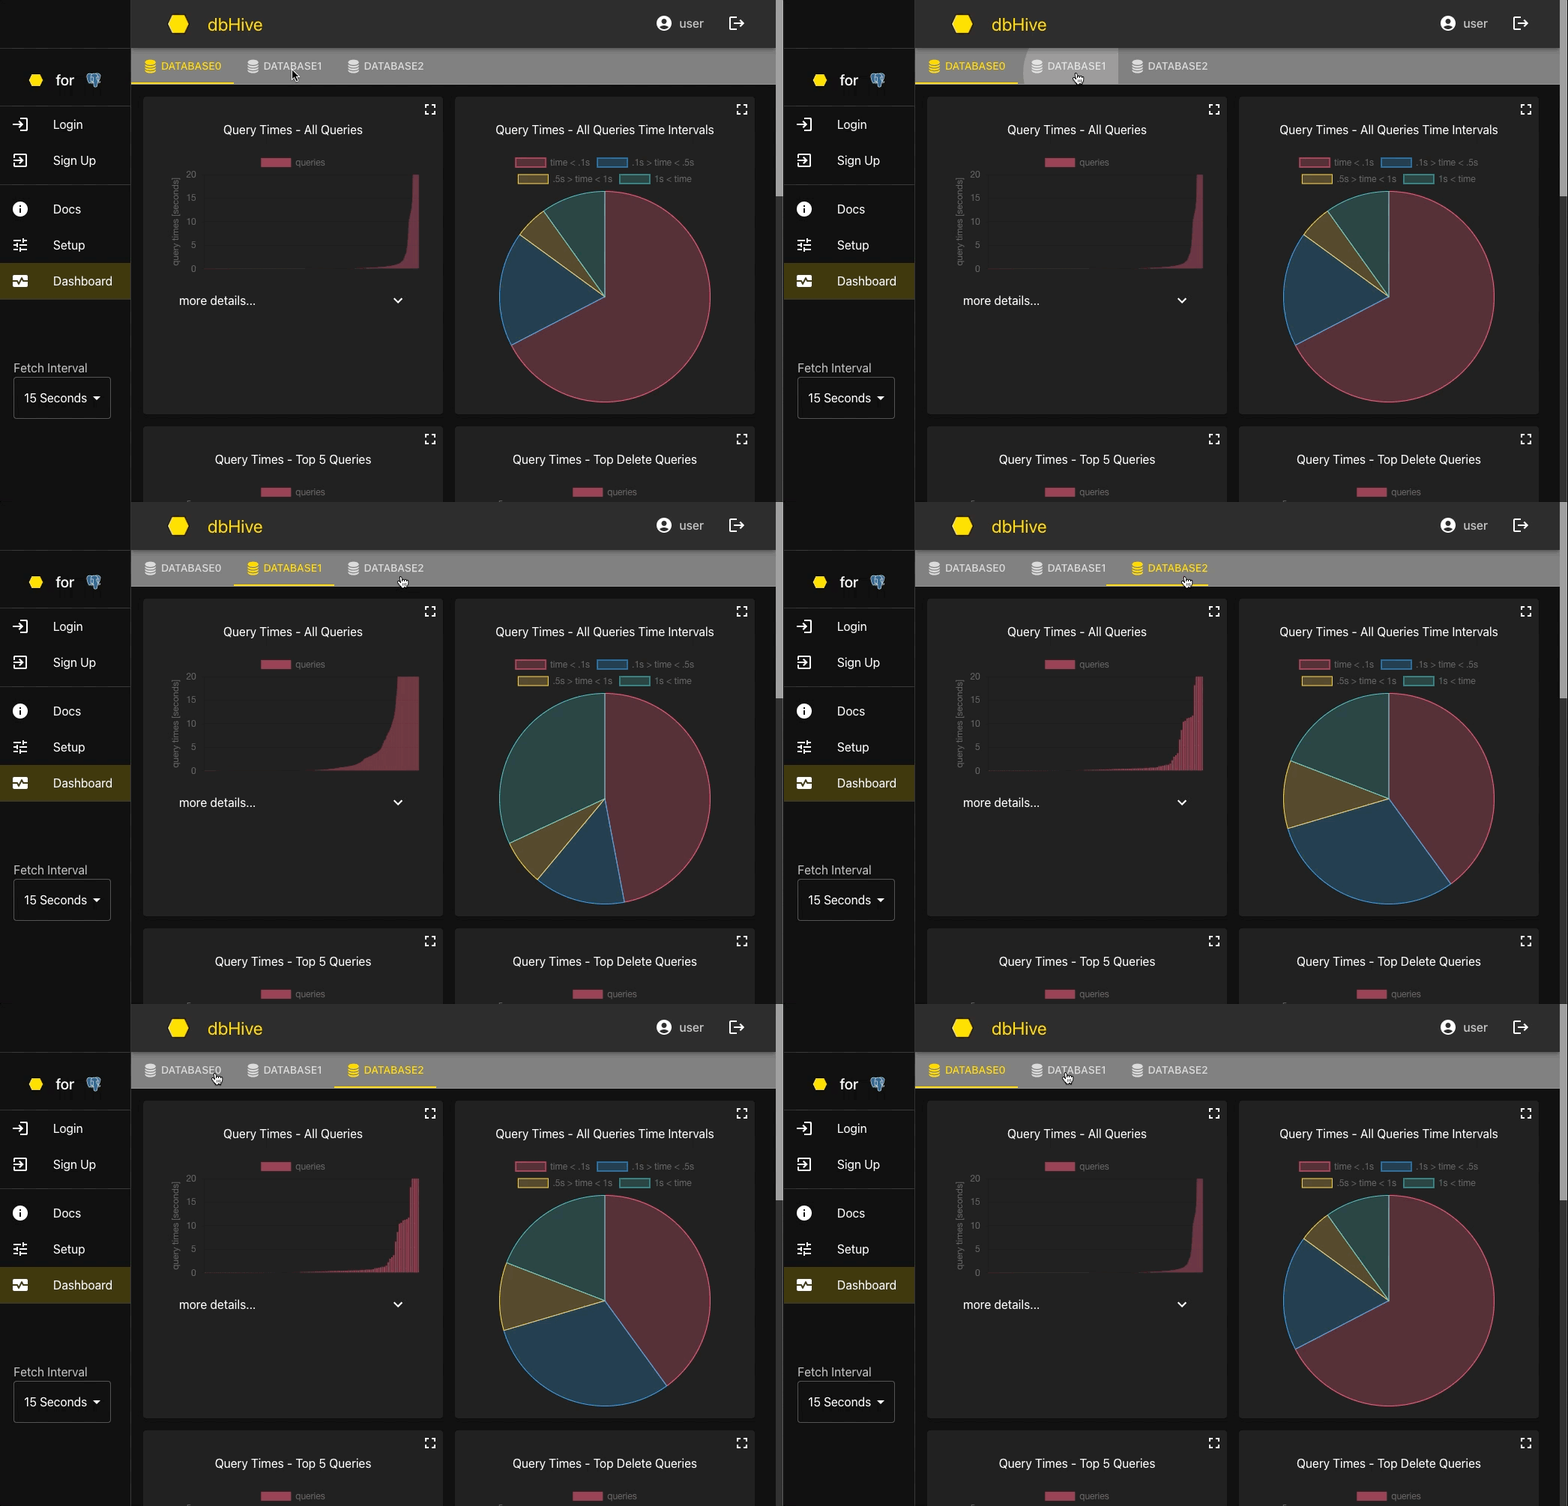
Easily access all databases and metrics within one place with the ability to toggle between multiple database dashboards.
Use dropdowns to view more details on a given metric. Expand graphs to fill the screen. Adjust the fetch interval, the frequency at which the dashboard is updated with the latest metrics.
Navigate to the Setup page and remove a database when it is no longer in use, keeping your dashboard clean.
dbHive application accounts can be removed by manually accessing IndexedDB and deleting entries. All data stored on the user is securely encrypted, and no encryption secrets are stored.
If certain database metrics are shown as unavailable in the dashboard, database user permissions may need to be elevated. Necessary user permissions and admin privileges can vary depending on the database hosting service used. For issues with application accounts, it is recommended to remove problematic users. Follow the directions in the "Remove application users" section of this readme.
Read our contribution guide for more information on how to contribute to dbHive.
If you would like to participate in developing new features, the app can be launched in development mode:
npm run dev
or
docker build -t dbhive/main-dev -f Dockerfile-dev .
docker-compose -f docker-compose-dev-hot.yml up
- Search Feature: Add a search bar to the dashboard that allows users to find data by keywords.
- Expansion to Other Databases: Make dbHive available for other databases besides PostgreSQL.
- Comparing Schemas: Allow users to compare the performance of alternate database schemas alongside their current schemas.
- Additional Customization: Give users more power to customize graphs and dashboard arrangement.


