Jitsi = Open source project for secure video conferencing solutions.
Jitsi Video Bridge = Video router for WebRTC.
- REST
- XMPP MUC
- Ensure that Docker and Docker-Compose are installed.
How to Install Docker and How to Install Docker-Compose - This repo clone
$ git clone https://github.com/mfts/docker-jitsi-meet-monitoring.git - Start docker-compose
$ docker-compose up -d - Open Grafana at http: // localhost: 3000
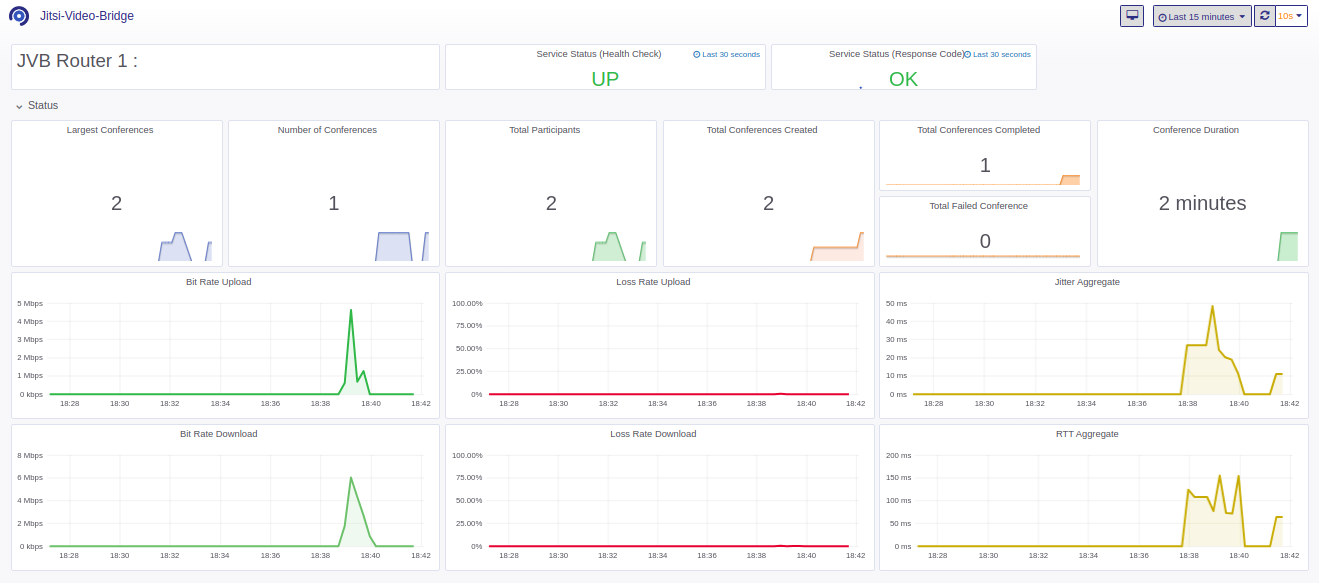
- Create a data source to InfluxDB
The username and password can be seen in the.envfile - Import the Dashboard from the file
fixtures/grafana-dashboard.json - Configuring Jitsi Video Bridge (JVB)
videobridge/configfile# extra options to pass to the JVB daemon JVB_OPTS = "- apis = rest"videobridge/sip-communicator.propertiesfile# Additional Configuration org.jitsi.videobridge.rest.private.jetty.port = 8080 org.jitsi.videobridge.ENABLE_STATISTICS = true org.jitsi.videobridge.STATISTICS_TRANSPORT = colibri
- Change the telegraph configuration according to the JVB component you want to monitor
Example:... ## List of urls to query. urls = ["http://meet.example.com:8080/about/health"] ... ## URL of each server in the service's cluster urls = [ "http://meet.example.com:8080/colibri/stats", ] ...
- InfluxData
- Grafana Labs
- Jitsi
