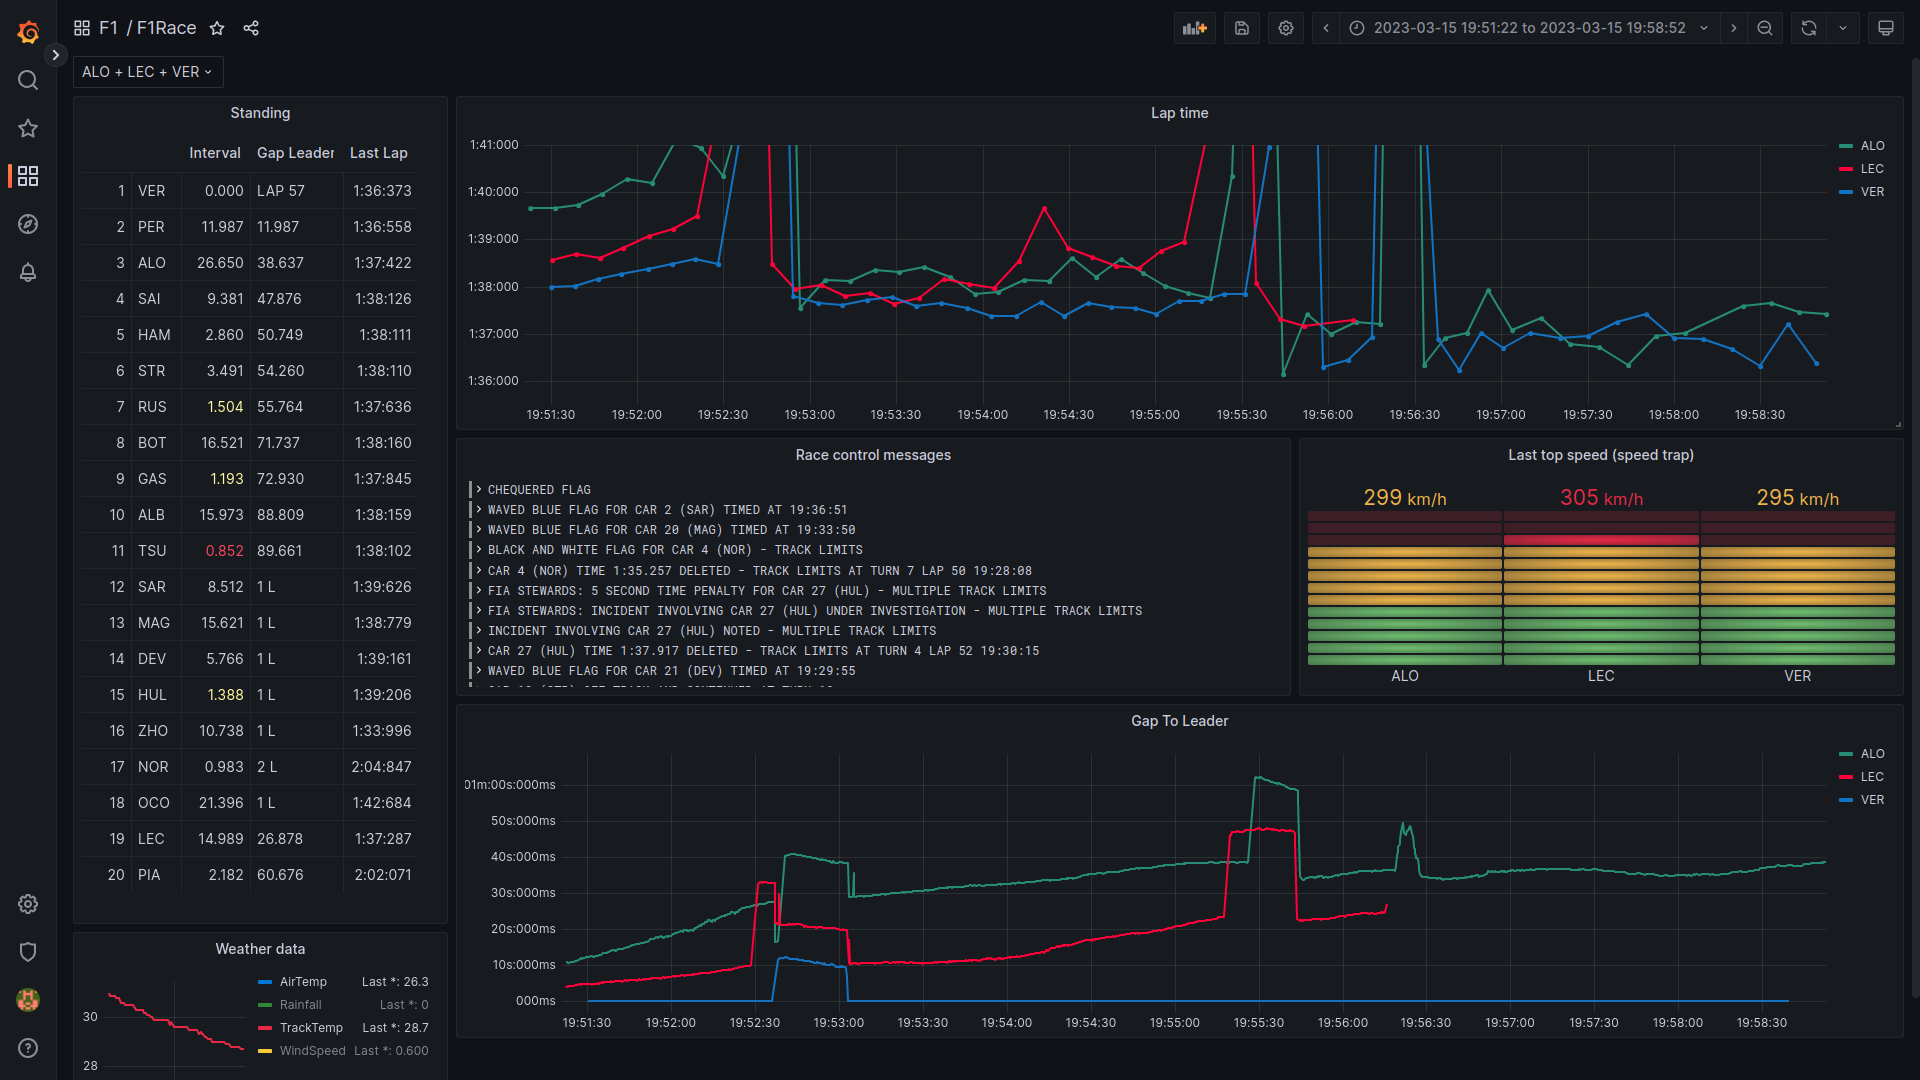
You want a better view of the live data of a F1 race? f1-live-data is easy to use and customizable to your needs.
- Docker installed
Tested on Ubuntu 20.04
chmod -R 777 storage/
docker-compose up -d
docker build -t data-importer-image .

# if a f1 race is currently under way:
docker run -it --rm \
--network f1-live-data_default \
data-importer-image \
dataimporter process-live-session \
--influx-url http://influxdb:8086

# else
docker run -it --rm \
--network f1-live-data_default \
-v ${PWD}/saves/partial_saved_data_2023_03_05.txt:/tmp/save.txt \
data-importer-image \
dataimporter process-mock-data /tmp/save.txt \
--influx-url http://influxdb:8086

# Browse http://localhost:3000
# admin / admin
# Dashboards > Browse > F1 > F1Race
docker-compose up -d
pip install .
data-importer process-mock-data saves/partial_saved_data_2023_03_05.txt --influx-url http://localhost:8086
- Select all of your favorite drivers (top, left)
- Leaderboard with Interval, Gap to Leader, Last Lap Time
- Lap time evolution
- Race control messages
- Top speed at speed trap
- Gap to leader graph
- Weather data
┌─────────────┐      ┌────────┐      ┌───────┐
│data-importer├─────►│influxdb│◄─────┤grafana│
└─────────────┘      └────────┘      └───────┘
The data-importer uses the live timing client from fastf1 to receive live timing data during a f1 session.
The data is stored in an influxdb. grafana is used to display the data by querying it from influxdb.
The data-importer has two modes:
- process-live-session: Processes data from a live session via
fastf1live timing client. - process-mock-data: Loads data from file and replays it (with a default speedup factor of 100). This mode can be used to develop new panels and debug it.
fastf1 provided a bunch of different data points. Not all of them are processed:
Processed: WeatherData, RaceControlMessages, TimingData
Not Processed: Heartbeat,CarData.z,Position.z,ExtrapolatedClock,TopThree,RcmSeries,TimingStats,TimingAppData,TrackStatus,DriverList,SessionInfo,SessionData,LapCount
You can record a live session with the live timing client from fastf1
python -m fastf1.livetiming save saved_data_2022_03_19.txt
The recorded file can be used to develop and test the data processing.
The data-importer is able to load the recorded file (command process-mock-data)
To add the color of a driver to a panel via the UI can be annoying. There is a command line tool do accomplish that. Just pass the path of the dashboard and the names of the panels:
python src/dataimporter/dashboard_utils.py storage/grafana/dashboards/dashboard.json "Lap time" "Gap To Leader"- Edit the panel in the UI
- Click the save button
- Click "Copy JSON to clipboard"
- Replace the content of the file
storage/grafana/dashboards/dashboard.json
Laps with pit stops are very slow and lead to a large value range on the y axes. You can set a maximum value in the panel settings.
- data-importer disconnects after 2h (the f1 data providing service seems to close the connection, see fastf1)
- Display car position (
Position.z) - Display telemetry (
CarData.z) - Display (personal) fastest lap
- Display sector times
- Number pit stops and tires compound (
TimingAppData)
