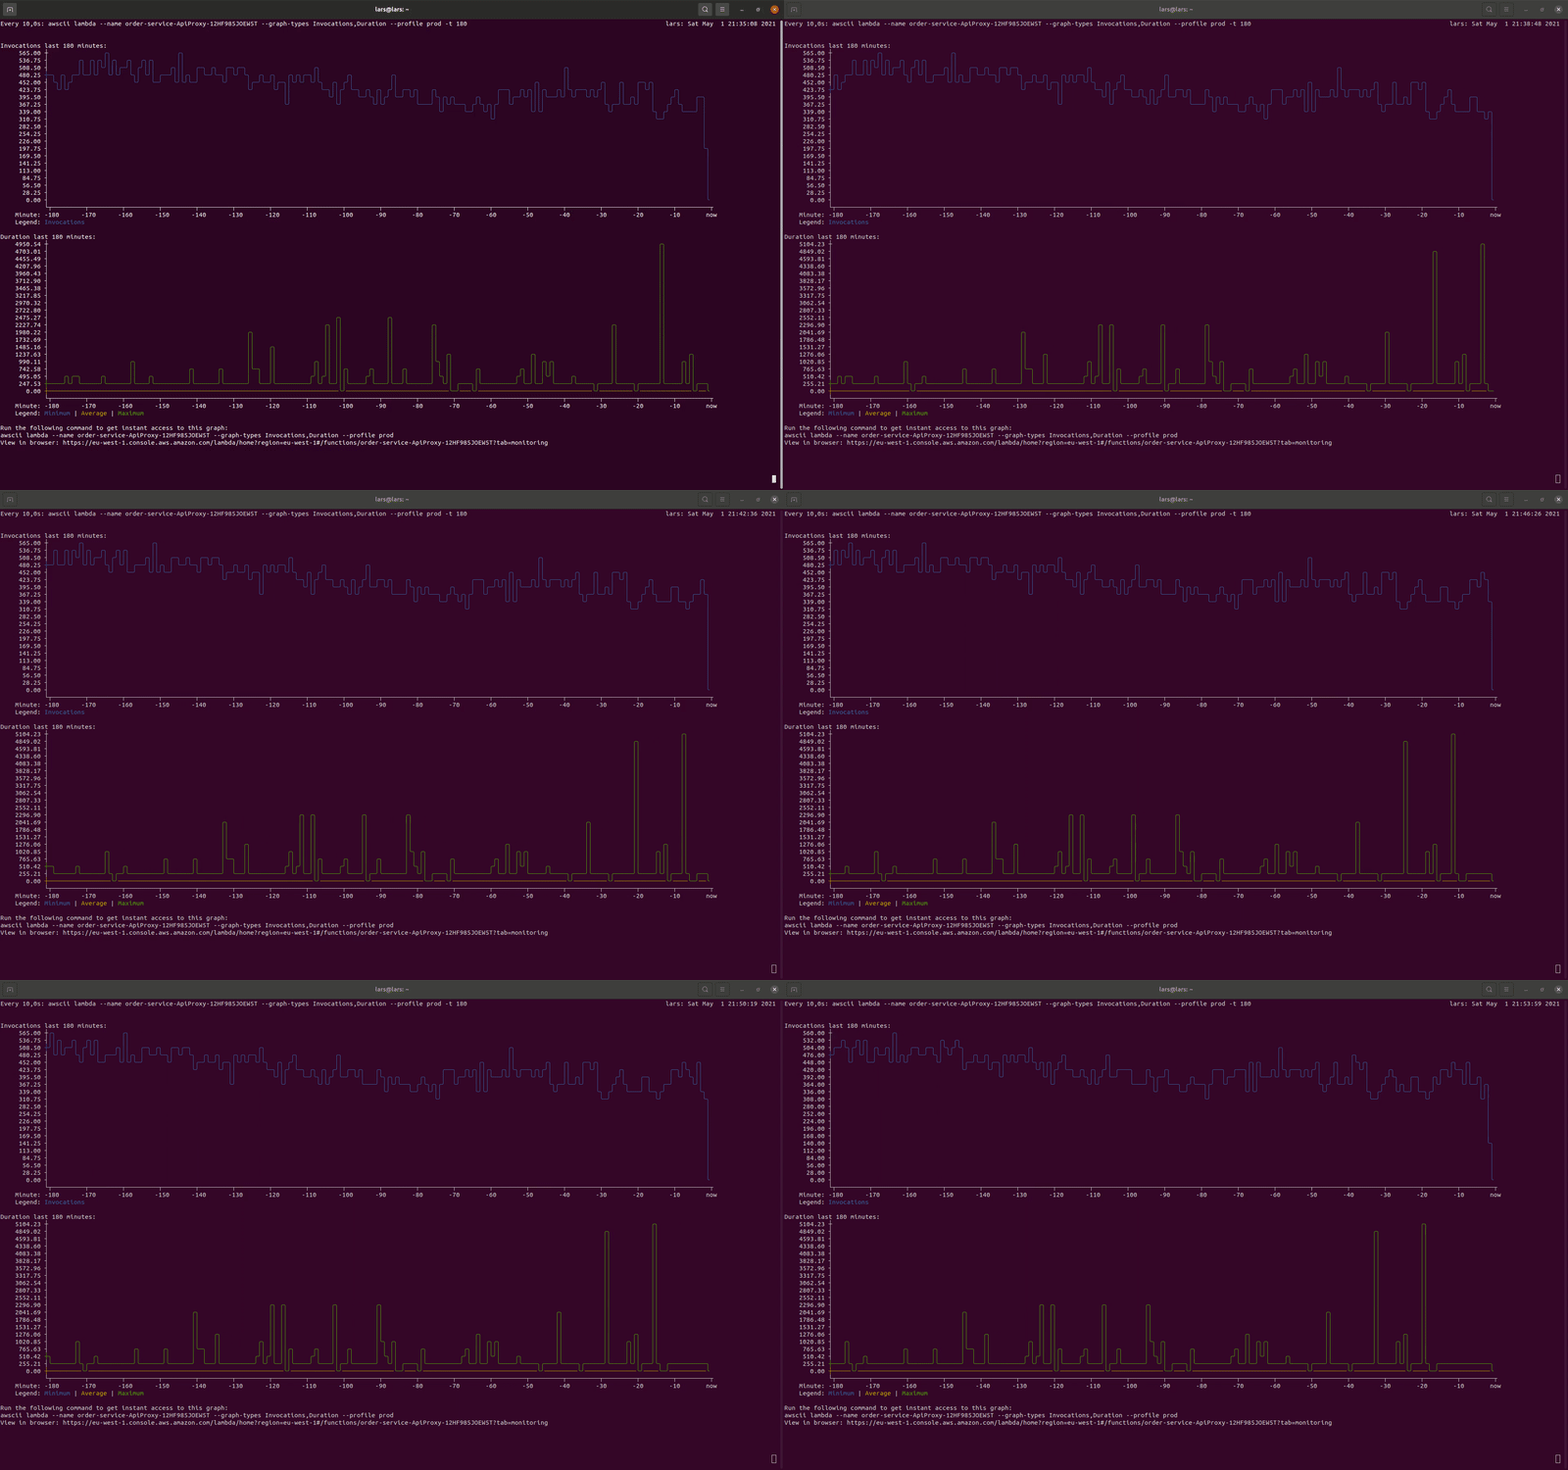
awscii-cli /ˈɔːskiː/
CLI tool that lets you render predefined AWS graphs in ASCII art using asciichart.
The purpose of this tool is to give cloud engineers instant access to their resources' graphs without context switching into the AWS console. The graph definitions are taken from respective service's monitoring tab in the console.
The tool also provides a quick way to find resources using autocomplete and partial search. Each supported service provides a link to the more detailed view in the AWS console for more granular inspection than what ASCII-art offers.
npm i -g @mhlabs/awscii-cli
- NodeJS 12 or higher
- An AWS account
- aws-cli configured with at least read-only permissions
Version 1.0.x supports the following subset of AWS services:
- Lambda
- DynamoDB
- API Gateway
- Kinesis Data Streams
Usage: awscii [options] [command]

Options:
  -v, --version             output the current version
  -h, --help                display help for command

Commands:
  lambda|l [options]        Browses and visualises Lambda metrics as ASCII diagrams
  dynamodb|ddb [options]    Browses and visualises DynamoDB metrics as ASCII diagrams
  apigateway|api [options]  Browses and visualises API Gateway V1 metrics as ASCII diagrams
  stack|s [options]         Browses and visualises stack metrics for a CloudFormation stack's resources as ASCII diagrams
  help [command]            display help for command
You can use awscii together with the watch command to create live dashboards for your office screens:
watch -n60 --color awscii lambda --name my-function-name --graph-types Errors,Invocations --profile default
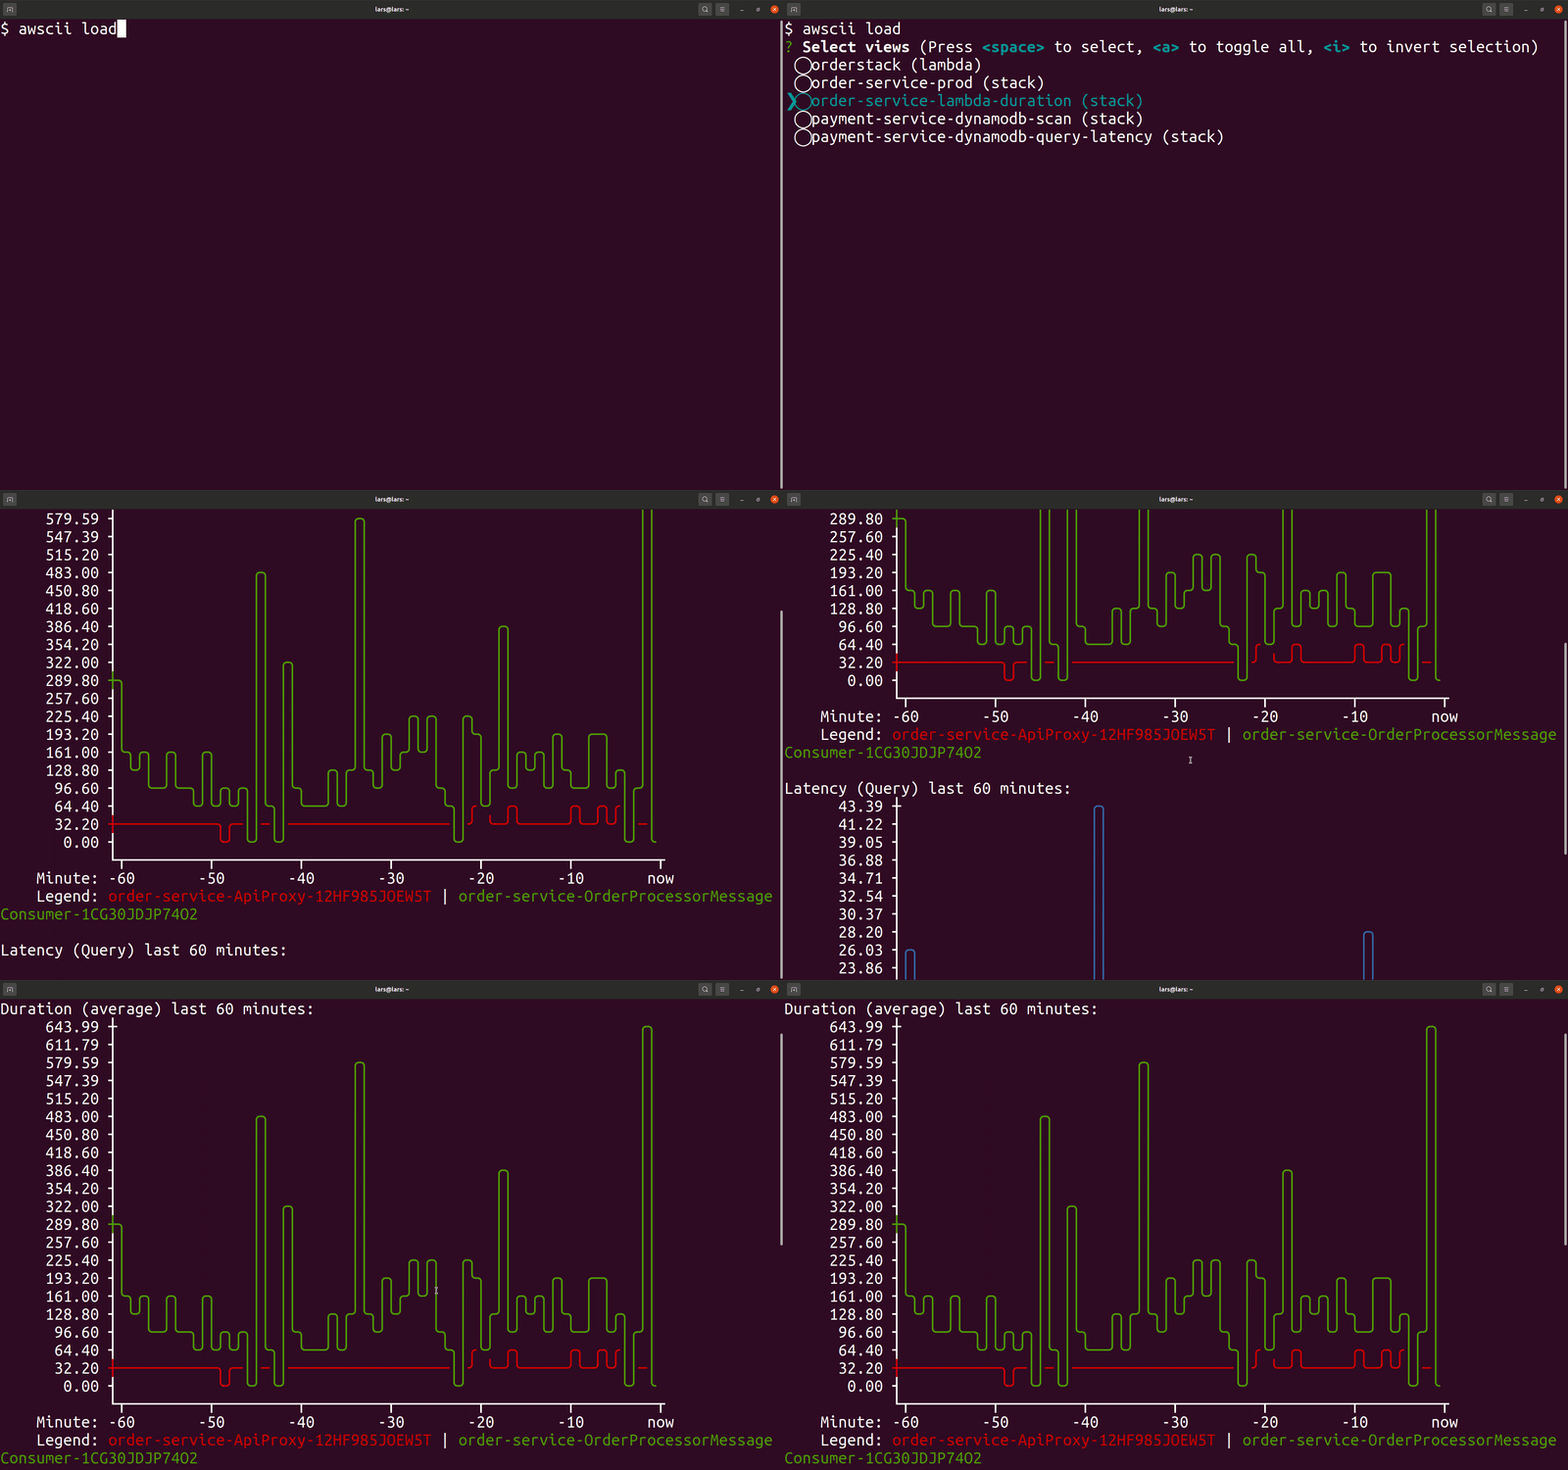
All commands take a --save [view name] option. This will save the input from the UI in a configuration file so it can be displayed faster next time you want to view it.
To load a saved view or views, use awscii load [--name [view name(s)]]. You can display more than one saved view at a time by comma separating the view names.
This lets you compare and visually correlate metrics from different stacks, functions or tables. It's also AWS profile aware, so you can compare metrics in different accounts.


