The logger is based on the Energy systems reading toolkit. Thanks a ton for your work, Niels Basjes.
Build the power logger with
mvn -f logger/pom.xml clean packageDuckDB >= 1.0.0.
The schema is split into base tables, shared views and eventually, the API, consisting of several views. It can be applied as follows:
./bin/create_or_update_database.sh pv.dbMeasurements are stored per quarterly hour, as local date times (local timezone is assumed).
For dealing with specifics to your area, i.e. changes during summer / winter time observations, scripts needs adjustment.
All views - think of them as public API to this database - start with an v_.
I have added a requirements.txt usable with pip like this:
pip install -r notebooks/requirements.txtRun the power logger with:
./logger/target/assembly/bin/log-power-outputAgain, this might damage your inverter, burn down the house and what not. Use at your own risk. The logger puts out 1 minute measurements in watt (W) by default which can be imported after creating a database file as described above like this:
more logger.csv | duckdb pv.db -c ".read attic/import_logger.sql"Run the notebook with:
jupyter notebook notebooks/Photovoltaik\ \|\ Familie\ Simons,\ Aachen.ipynbProduce HTML without input boxes and code:
jupyter nbconvert --execute --to html --output index.html --no-input notebooks/Photovoltaik\ \|\ Familie\ Simons,\ Aachen.ipynbClear existing output with:
jupyter nbconvert --ClearOutputPreprocessor.enabled=True --inplace notebooks/Photovoltaik\ \|\ Familie\ Simons,\ Aachen.ipynbI have a rendered version with my current dataset at simons.ac/pv.
You can get a list of all views to explorer directly from the information schema like this:
duckdb --readonly pv.db "SELECT table_name FROM information_schema.tables WHERE table_type = 'VIEW' ORDER BY table_name ASC"Their titles should hopefully be self-explanatory, and I only want to show two highlights here.
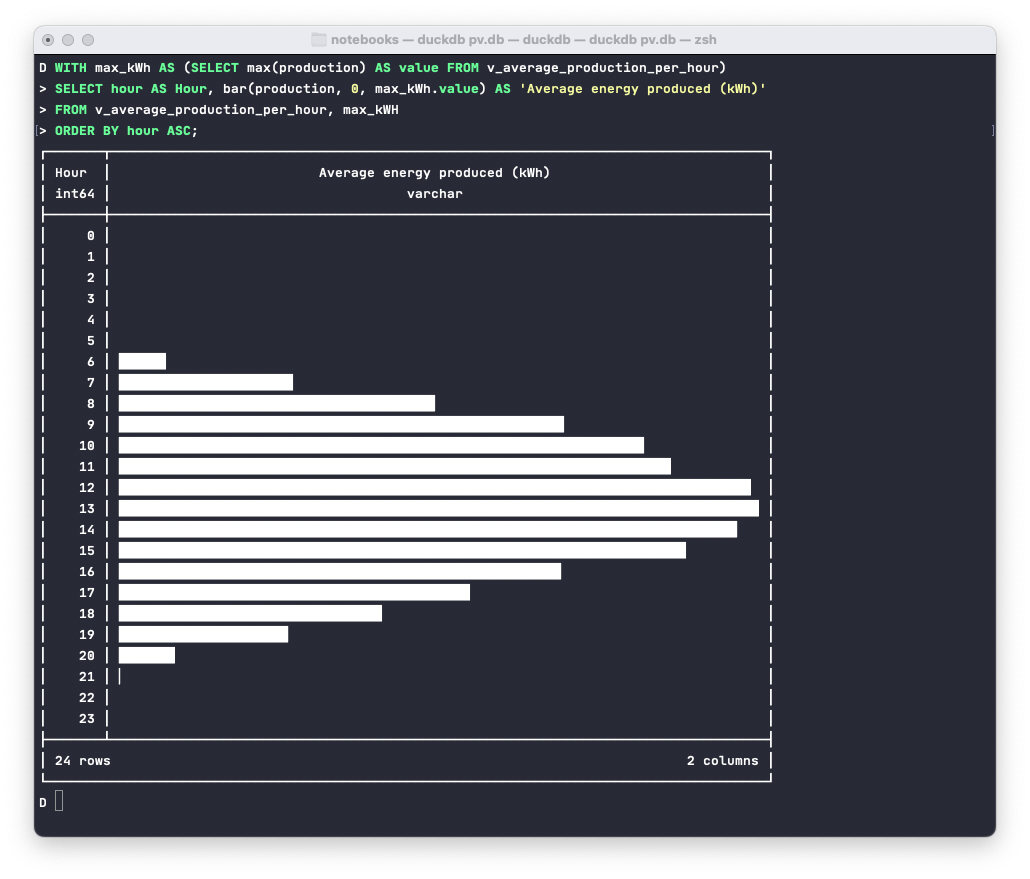
The bar function and the pivot support. The following adds a bit to the view named v_average_production_per_month and produces a quick chart in the terminal, showing the average energy produced per hour:
duckdb --readonly notebooks/pv.db <<-SQL
WITH max_kWh AS (SELECT max(production) AS value FROM v_average_production_per_hour)
SELECT hour AS Hour, bar(production, 0, max_kWh.value) AS 'Average energy produced (kWh)'
FROM v_average_production_per_hour, max_kWH
ORDER BY hour ASC;
SQL
Should look something like this, which I totally love:
Of course this is also possible per month:
duckdb --readonly notebooks/pv.db <<-SQL
WITH max_kWH AS (SELECT max(production) AS value FROM v_average_production_per_month)
SELECT month AS Month,
     bar(production, 0, max_kWH.value) AS 'Average energy produced (kWh)'
FROM v_average_production_per_month, max_kWH
ORDER BY month ASC;
SQL
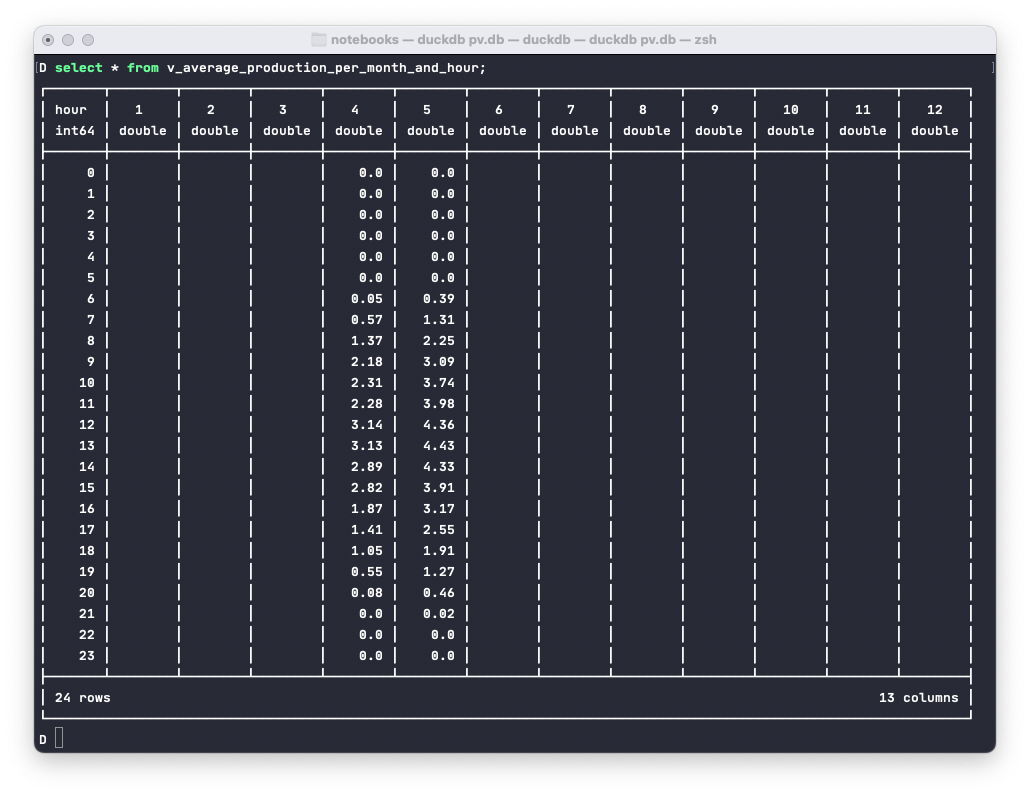
Then there is the PIVOT statement being used in v_average_production_per_month_and_hour view to compute the average per
hour and month. Originally I displayed the month names as headers, but that is not that useful as an API for the database when you want todo the translation later:
duckdb --readonly notebooks/pv.db "SELECT * FROM v_average_production_per_month_and_hour"The whole database can be exported either as CSV files like this
EXPORT DATABASE 'target_folder';Or if you prefer Parquet, use the following:
EXPORT DATABASE 'target_folder' (FORMAT PARQUET, COMPRESSION ZSTD);
