Comments to mash@econs.umass.edu
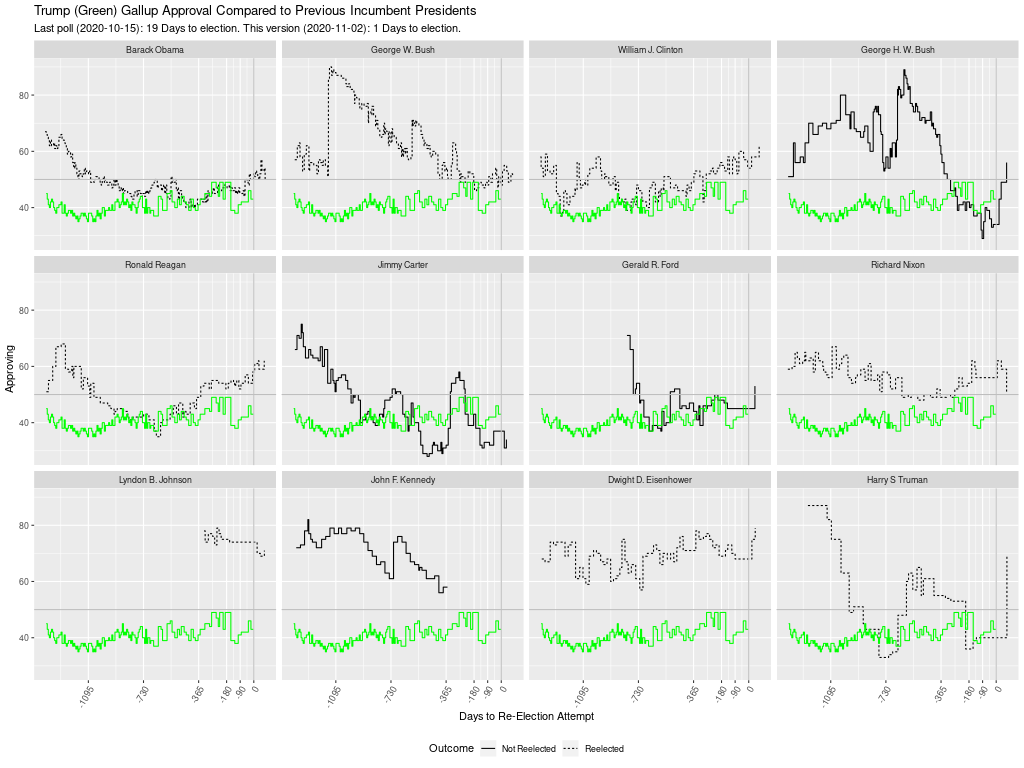
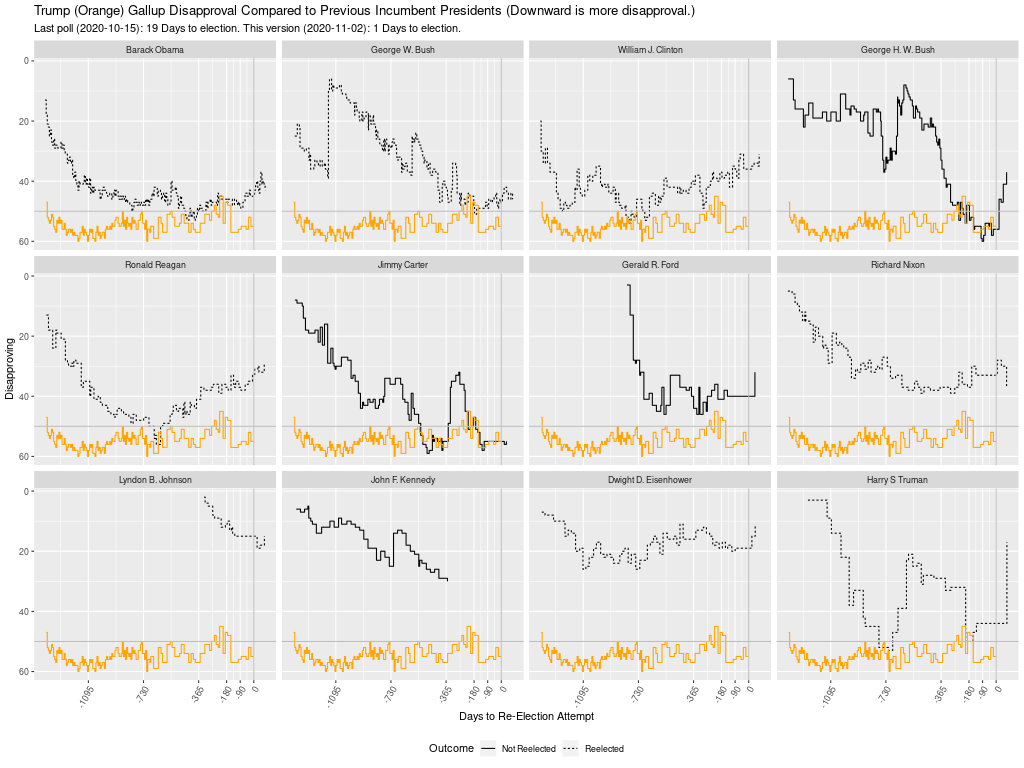
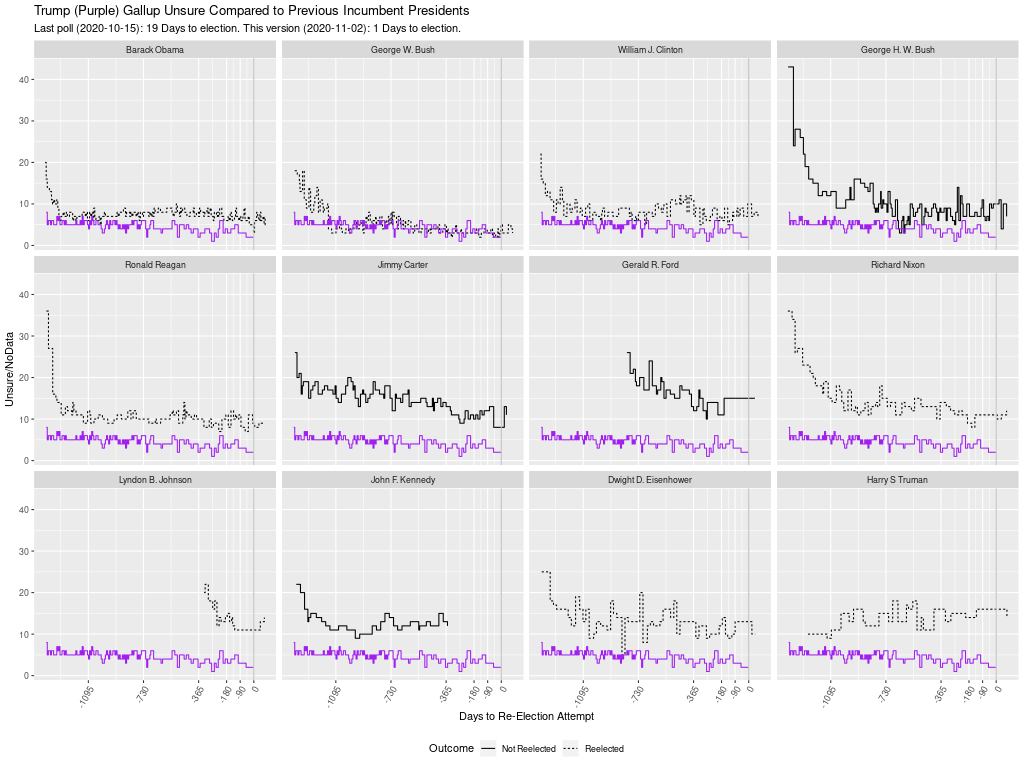
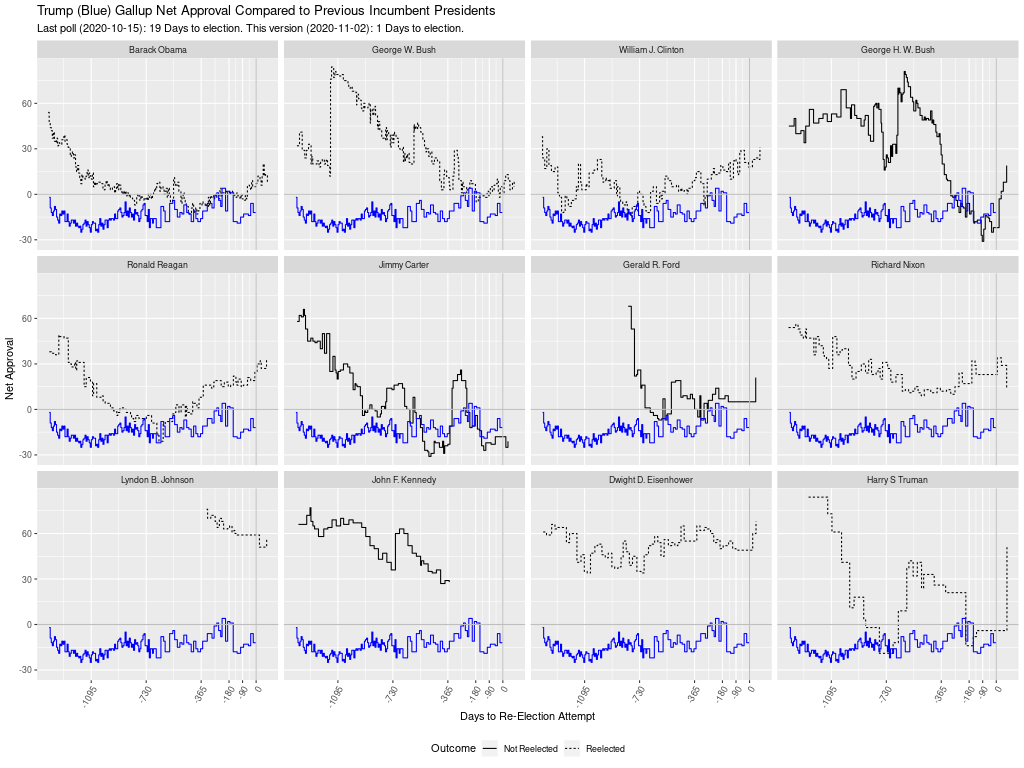
How Trump compares with past presidents, the lower panel of https://projects.fivethirtyeight.com/trump-approval-ratings/, plots pairwise time series of the dis/approval of each post-war president and the dis/approval of Donald Trump starting from the first day of each President's presidency.
The fivethirtyeight plot might be more useful, especially in election season, if it were plotted as a countdown of days to the re-election attempt instead of a count of days from the first day of the presidency.
The countdown is particularly relevant to compare presidents whose terms did not begin immediately following an election, i.e., Harry Truman because of the death in office of FDR, LBJ because of the assassination of JFK, and Gerald Ford because of the resignation of Richard Nixon. For example, the fivethirtyeight version matches Trump approaching the November 2020 election with LBJ well into his second term (when the Vietnam War had been widely recognized as a disaster), which gives little insight into how in summer and fall 1964 LBJ was rolling towards a landslide reelection. Gerald Ford's line begins at left with his first day in office, which was roughly 1.5 years into the 4-year term that began with Nixon's 1972 re-election; thus, it is hard to compare Ford's approval as Ford's re-election attempt approached with that of other presidents.
The R code:
-
reads Presidential Job Approval data (with reference to Gallup) maintained in a Google Sheets file by the UCSB American Presidency Project.
-
A one-time authorization may be required for the googlesheets4 R package to have access to Google Sheets.
-
If the Google Sheets cannot be read in R, there is alternative code to use an xlsx spreadsheet manually downloaded from the Google Sheet.
-
Includes the option to update manually if more recent data are available from Gallup
-
-
plots presidential approval with a countdown to attempted reelection with t=0 at the date of the re-election attempt.


