This project attempt to realize how the critic behave given an observation. I used the pendulum environment because of the continuous single dimension action space. The code can be easy adjusted for discrete and multi-dimensional environments.
for environment information
The project contains two folders:
- train: train and test code for pendulum environment from gym, using ddpg and keras-rl. nothing special here.
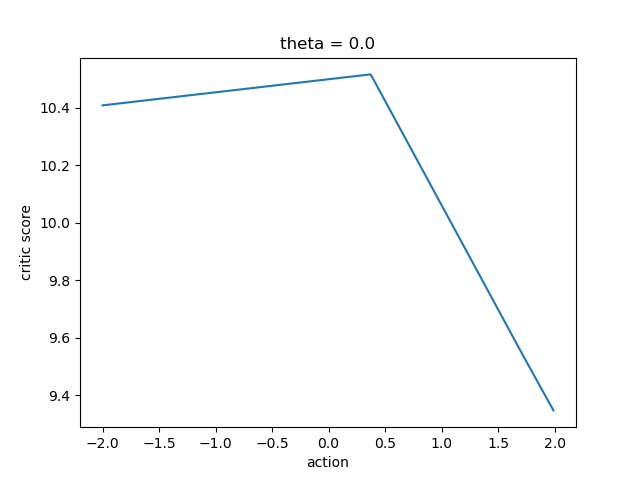
- debug: critic debugging infrastructure. will produce a graph for (action, Q_a) pair given an observation and an environment.
In addition, I created fit callback to record for each state,action pair the amount of time they occured and the history of their Q function. The callback takes a continuous space (observation or actions) or divide it into discrete bins.
can be found under debug/out folder, or by running the debug/critic.py script. I tested for theta between -2pi and 2pi in steps of pi/2, and theta-dot = 0 for all.
The callback's df is in train/logs and recorded the learning process for 100,000 steps. We can observe things like exploration, exploitation and Q value evaluation.
for example (from ddpg_debug_csv_example.ipynb):
import pandas as pd
import matplotlib.pyplot as plt
df = pd.read_pickle('train/logs/ddpg_data.pkl')
df.head().dataframe tbody tr th {
vertical-align: top;
}
.dataframe thead th {
text-align: right;
}
| state | action | c | Q | |
|---|---|---|---|---|
| 0 | [-1.0, -1.0, -8.0] | [-2.0] | 0 | [] |
| 1 | [-1.0, -1.0, -8.0] | [-1.0] | 0 | [] |
| 2 | [-1.0, -1.0, -8.0] | [0.0] | 0 | [] |
| 3 | [-1.0, -1.0, -8.0] | [1.0] | 0 | [] |
| 4 | [-1.0, -1.0, -8.0] | [2.0] | 0 | [] |
We divided our action and observation space into 5 bins, therefore we should have a total of 555*5 rows.
5^3 for (1,3) state vector and another 5 for action vector.
total_rows = df.shape[0]
print("rows:",total_rows)
rows: 625
We can see a (1,3) state vector and (1,1) action vector.
They both occured 0 times therefore has no Q history.
Lets see How many State Action pairs never occured:
never_occured = df[df.c==0].shape[0]

print((never_occured*100)/total_rows,"% never occured")
61.76 % never occured
Let's demonstrate the Q function history for the most selected action_state pairs:
most_c = df[df.c == df.c.max()]
most_c.dataframe tbody tr th {
vertical-align: top;
}
.dataframe thead th {
text-align: right;
}
| state | action | c | Q | |
|---|---|---|---|---|
| 569 | [1.0, 0.0, 4.0] | [2.0] | 18801 | [-34.07399, -33.94677, -33.910908, -34.01233, ... |
y = most_c.Q.iloc[0]
x = range(len(y))
plt.xlabel('time')
plt.ylabel('Q val')
plt.title('Q val for state (1,0,4) and action (2) over time')
plt.plot(x,y)
[<matplotlib.lines.Line2D at 0x27158085860>]
