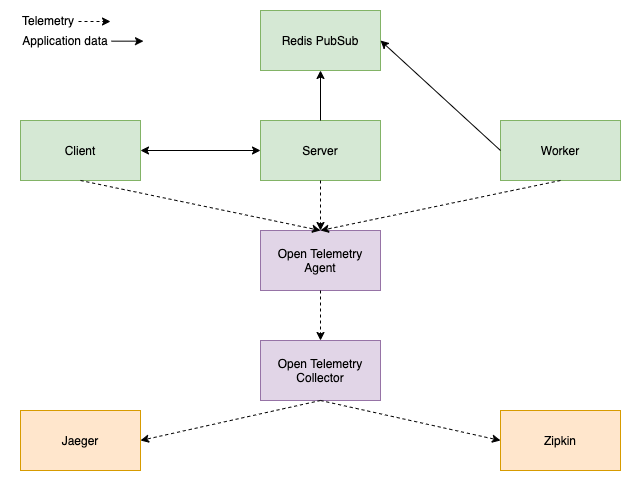
This is a demo of Open Telemetry's distributed tracing capabilities, using a dummy application described by this architecture diagram:
Note: The solid arrows describe how the services send all non-telemetry data to each other (for instance, http requests). The dotted arrows describes the flow of all telemetry data (traces).
These depicted services can be found in docker-compose.yml:
client- A service that sends a few requests to the server.server- A service that implements an HTTP server and publishes a message per request via redis' pubsub.worker- A service that listens for messages on redis' pubsub and does work when a message is published.redis- An open source key value store that is used for its lightweight pubsub message broker capabilities.jaeger- An open source telemetry backend.zipkin- An open source telemetry backend.otel-agent- A service that receives traces fromserver,client, andworker. In a real deployment, each service is expected to run an agent locally that forwards telemetry data to the collector. It handles logic such as retries and batching, so you don't have to implement that in your code. It can also enhance telemetry with additional metadata. The agent is actually a local version of the collector.otel-collector- A service that receives traces forwarded fromotel-agentand exports them tojaegerandzipkin. In a real deployment, this could be running on another VM or scaled horizontally as a cluster behind a load balancer, depending on desirable uptime.
-
By using Open Telemetry with the collector, backends are swappable without having to redeploy your application or add any specific code about a particular backend to your application and all services handle tracing in the same way, regardless of programming language.
Specifically, applications send traces to the agent, which forwards them to the collector, and the collector defines backends via exporters in yaml. To swap backends, just change the configuration in yaml and redeploy the collector without touching application code.
Here we use 2 exporters,
jaegerandzipkin, but there are many possible exporters including Azure Monitor. -
Cloud architectures often use some form of a message broker to communicate long running operations. While HTTP is covered via docs, many messaging systems use protocols that are not automaticcaly supported by the Open Telemetry SDK (trace contexts are not injected and extracted for you automatically, you must manually do so yourself). One such example would be redis' pubsub wire protocol. In this repo, we show how to add distributed tracing to any arbitrary messaging system.
-
Many popular libraries integrate with Open Telemetry with no extra work required. One library is go-redis. This is great because if a library is not instrumented, the best you can do is either modify the library or instrument code which calls the library (which inherently misses internal events in the library that do not bubble up to the surface of the exposed API).
docker-compose up --build brings up all services.
The client sends a few requests to server. The server publishes messages
to redis. The worker listens for messages and performs work when they are
published.
The distributed traces appear in jaeger and zipkin.
jaeger can be accessed at http://localhost:16686.
zipkin can be accessed at http://localhost:9411.
docker-compose down cleans up all resources.
If you would like to manually make requests to the server after the client ends,
navigate to http://localhost:8080/hello.
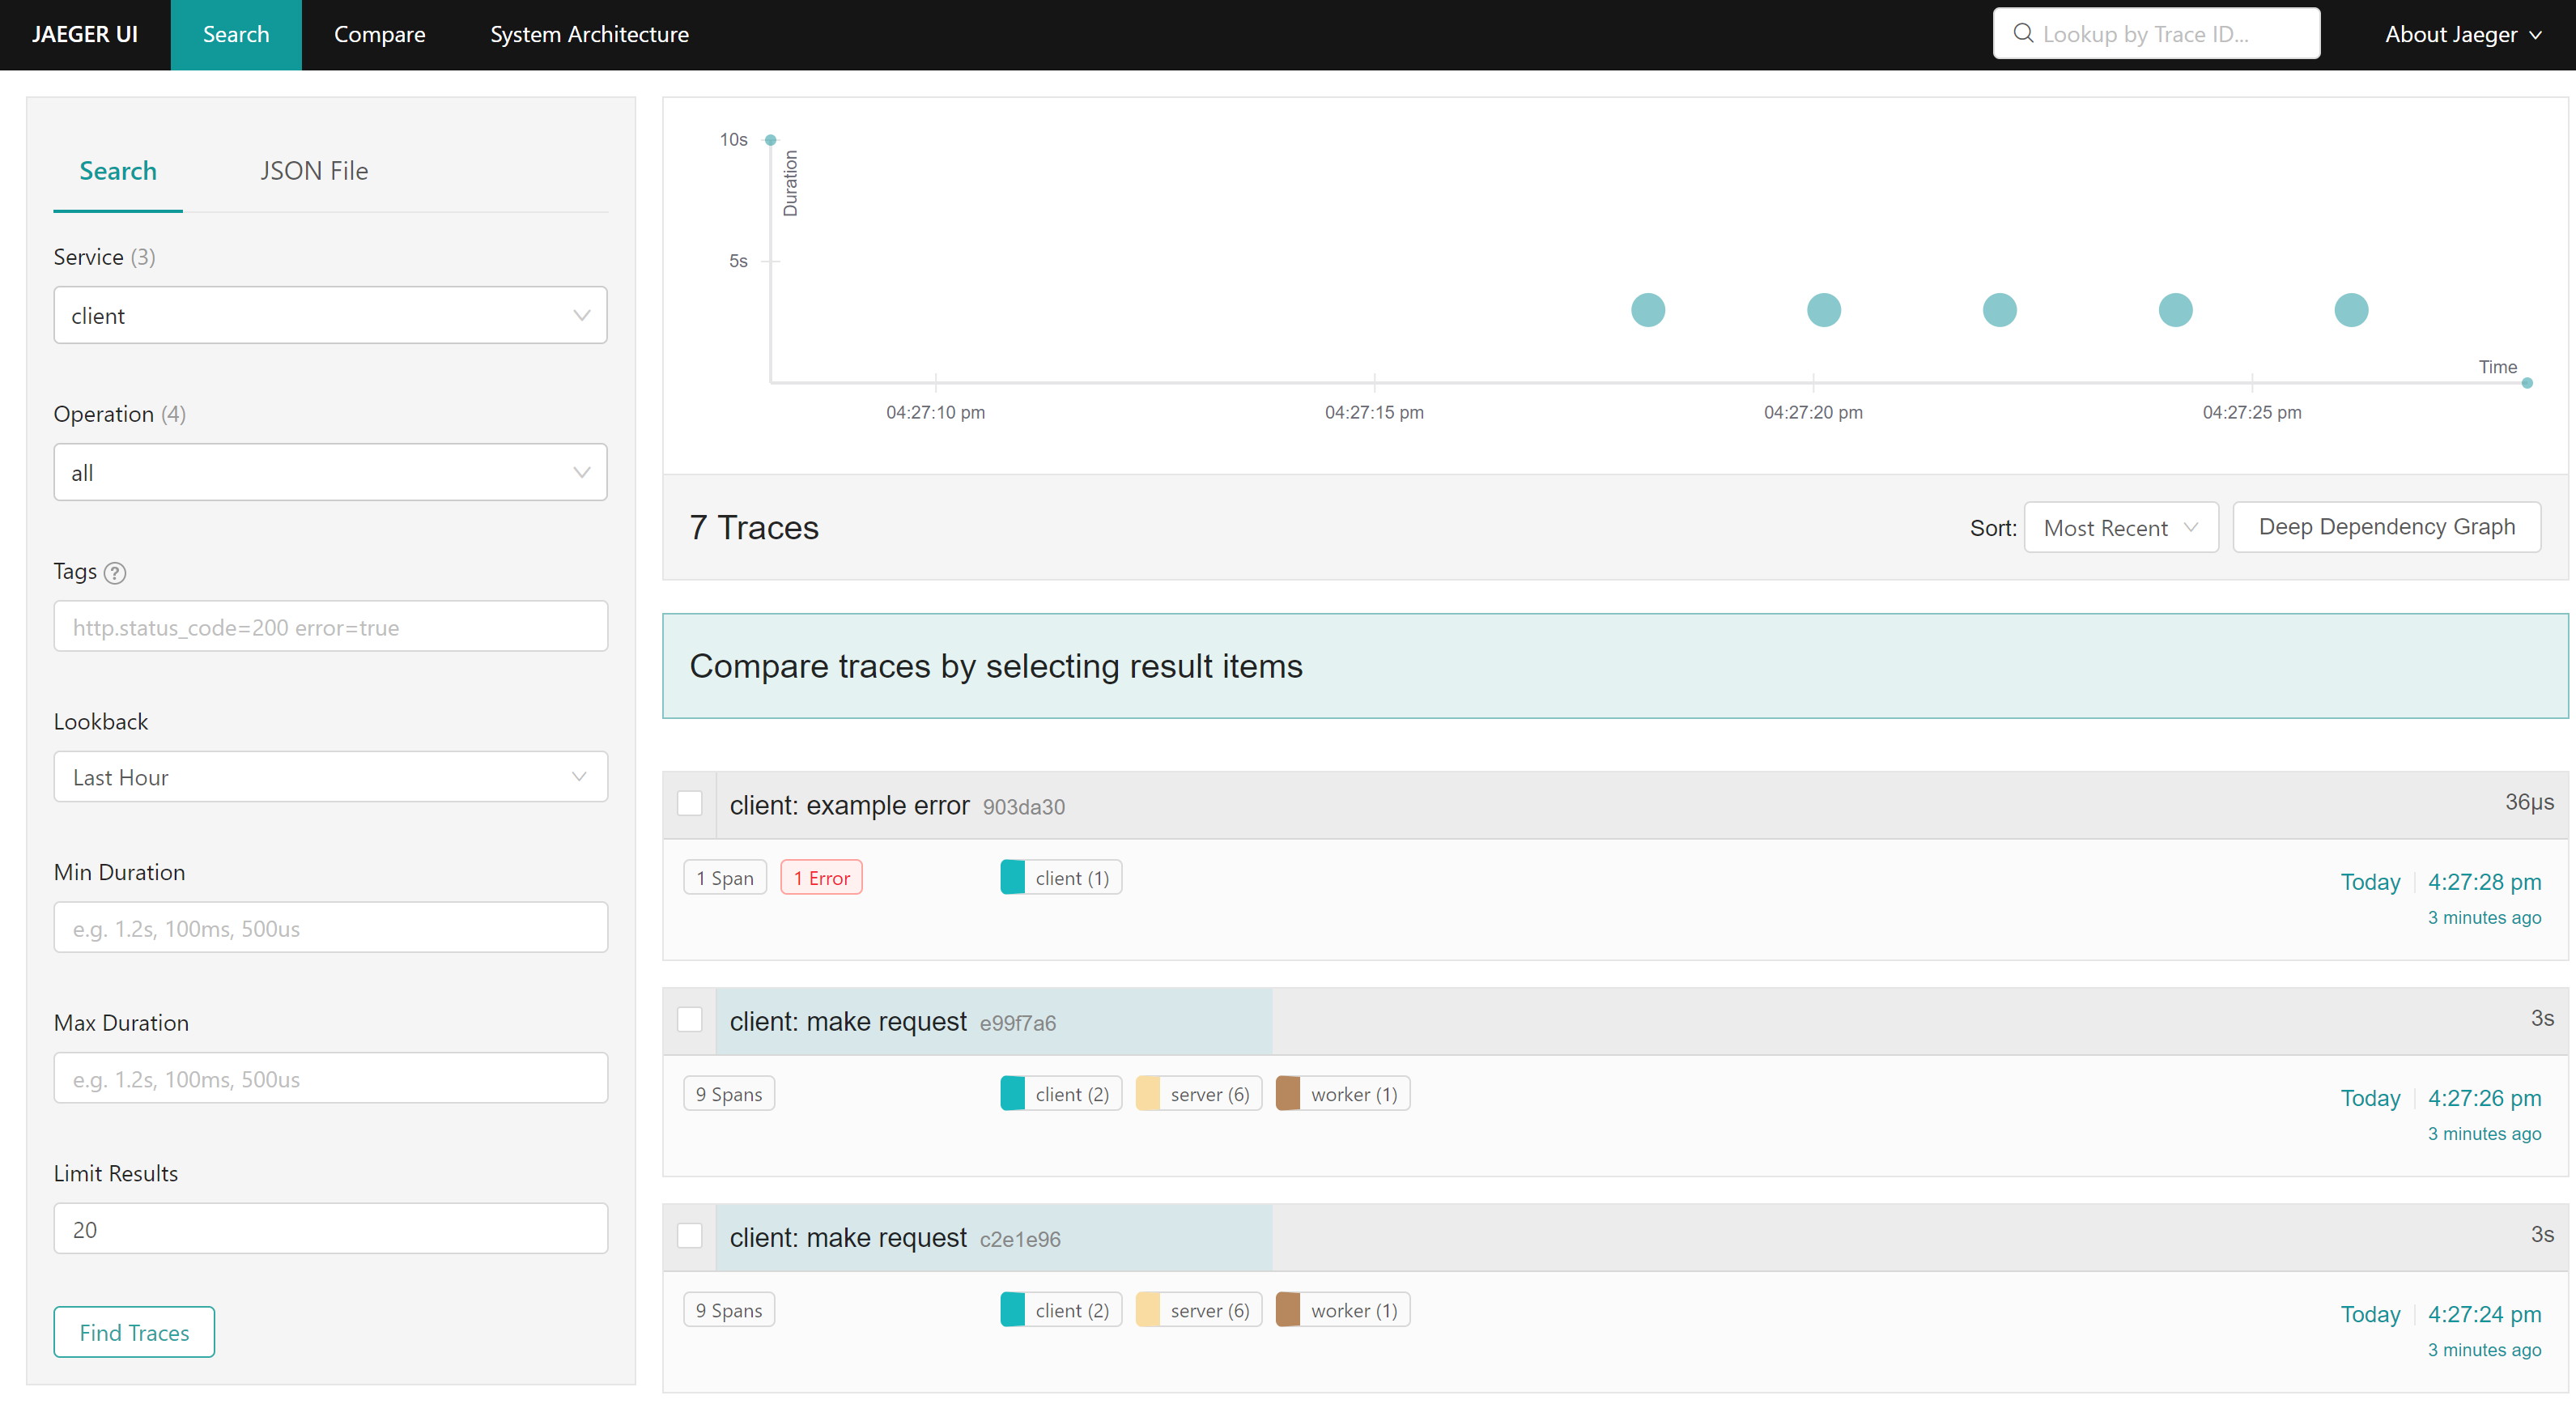
After requests have been made, if you choose the client service in jaeger,
you should see something similar to:
Note that you can see all traces that started from the client. If you click on a trace, you can see the distributed spans that make up the trace:
In my opinion, the answer is almost always no. Here are cases where I believe they are needed:
- You would like to change the telemetry backend without redeploying your application.
- You would like to limit your points of egress. With the collector, the only time where a network request would be made to a third party would be when the collector sends traces to commercial backend, such as Data Dog.
Keep in mind the added complexity of using agents/collectors.
Deploying an agent alongside every service introduces more configuration and requires more compute. It also increases the surface area for bugs. What if something goes wrong in the agent? If it is deployed as a sidecar, how would it affect the main service?
Managing a collector in a large application may actually mean managing a cluster of collectors behind a load balancer. This comes with the typical headaches of managing any cluster, including extra responsibility and cost.
There are exporters for the collector as well as exporter libraries for your application code that do not require the collector. However, if you use an exporter library in your application code, then that configuration will need to exist in all your services and you cannot change that configuration without redeploying your service.
If this tradeoff works for you, search for an exporter library in the official registry.
For instance, when searching for "Azure Monitor" one of the first results links to Azure Monitor exporter for python.
If our demo were written in python, to use the library, you would replace code
for initializing the tracer in pkg/tracer with the Azure Monitor exporter. At
this point, you would no longer need agents or collectors. While initializing
the tracer requires changes, the actual usage of the tracer thereafter will not
change at all.
Note that as of writing, an exporter library for Azure Monitor written in Go does not exist, but an exporter for the collector does. If we would like our Go services to export to Azure Monitor, we would be forced to use the collector.
With serverless, this can be especially useful because it is often harder to deploy agents and collectors.
Start by reading the comments in cmd/client/client.go.
They describe how to create a trace that propagates to the server via
an HTTP request.
Next, read the comments in cmd/server/server.go. They describe
how the propagated trace is used in children spans.
Next, read the comments in pkg/message.go. They describe how to
add headers to the message that propagate the trace context from the server
to the worker, in the same way as would be done via HTTP.
Next, read the comments in cmd/worker/worker.go. They describe how to
extract the trace context from messages on redis' pubsub and create child spans
with this context.
Next, read the comments in pkg/broker.go. They describe how the trace context
can be manually injected and extracted, when publishing and receiving messages.
Finally, read the comments in pkg/tracer.go. They describe boilerplate code
that sets up a tracer provider for each application.
Open Telemetry officially maintains support for exporters for popular open source backends such as Jaeger and Zipkin. Additionally, there are "contrib" repos where the open source community maintains exporters for other backends such as Azure Monitor or Data Dog.
Open Telemetry has separate repos for each supported language. The URL typically
looks like https://github.com/open-telemetry/opentelemetry-<LANGUAGE NAME>.
For instance, this is the repo for Java.
Officially supported open source exporter libraries can be found in the language specific repos, typically in a directory called "exporters".
Unofficial exporters are often scattered around Github, but are indexed by the official registry where you can search for them.
A dev container has been provided. To use:
- Ensure the
Remote - Containersextension is installed in VSCode - Open the project in the container
- Install the Go extension libraries with
Go: Install/Update toolsfrom the command palette
Note: When running any docker commands, run them from outside of the dev container (on the host machine)
The collector code is adapted from this official otel example.
The client / server code is adapted from this official otel example.


