- Website
- Slack Community (join the #promscale channel)
- Forum
- Blog
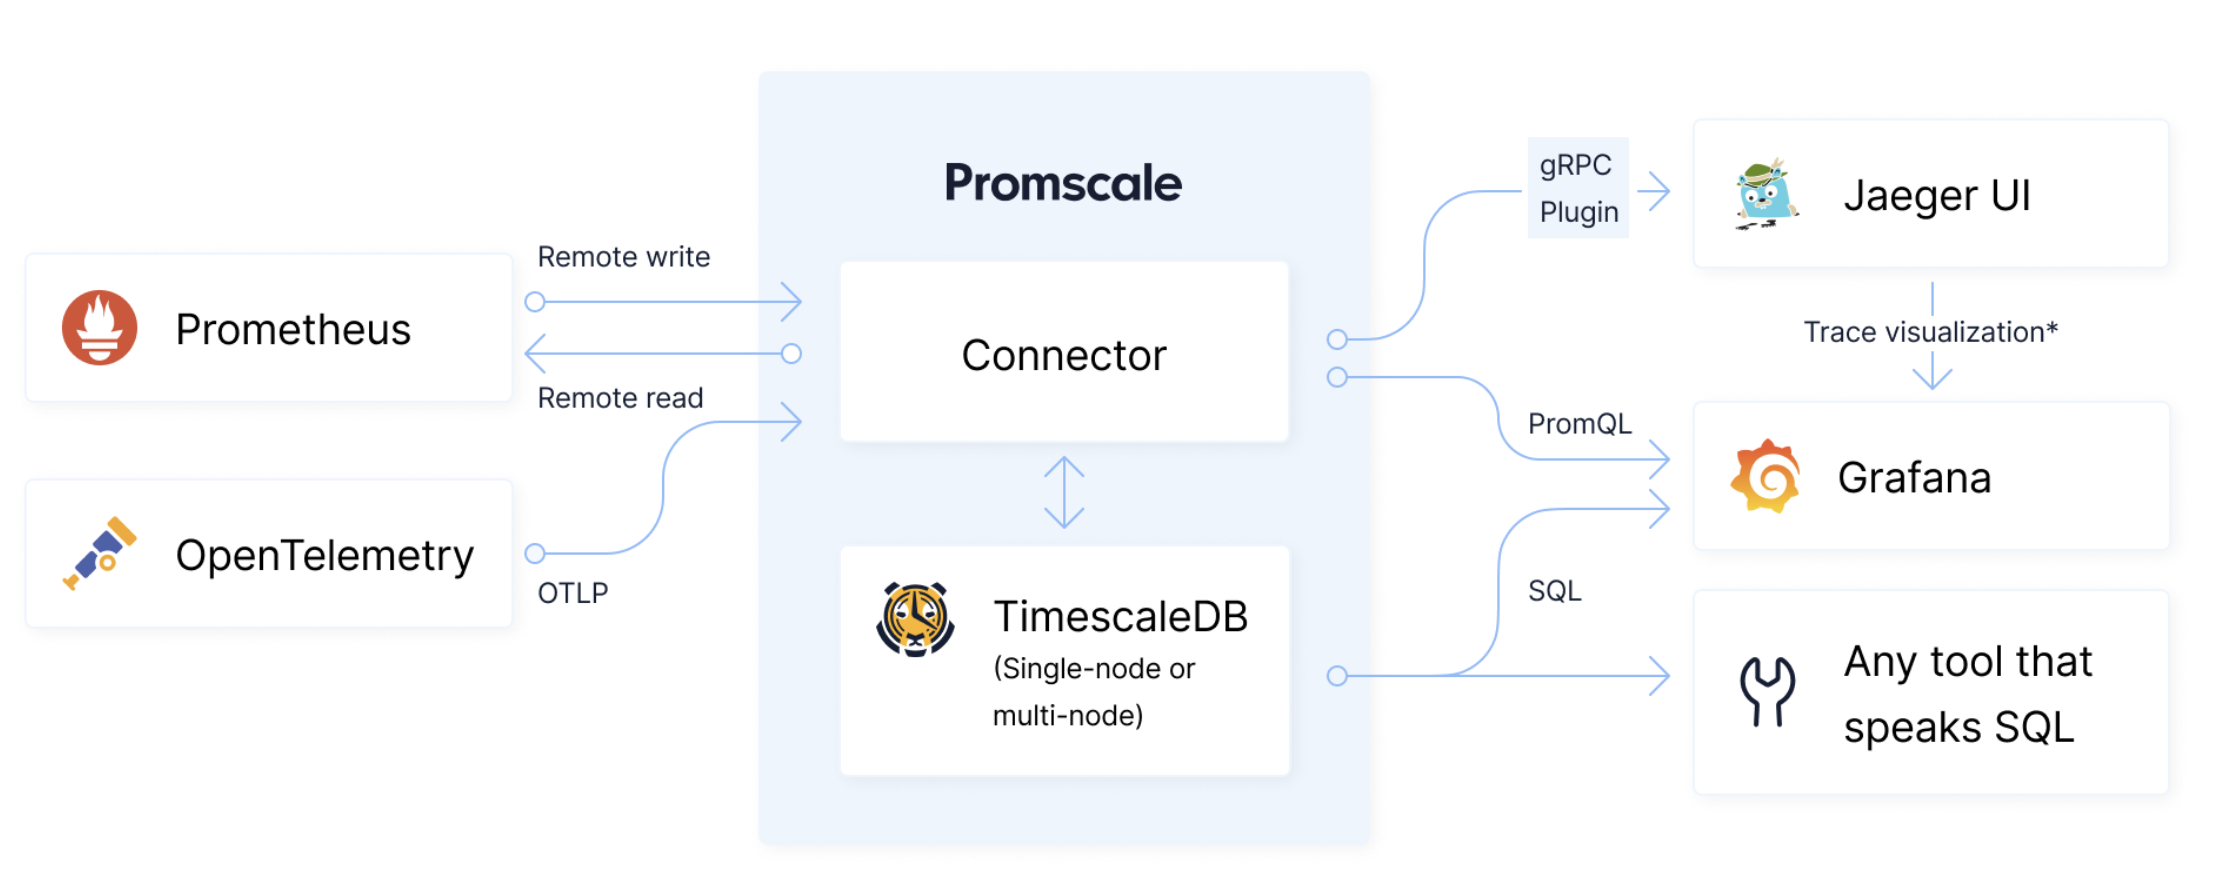
Promscale is an open source observability backend for metrics and traces powered by SQL.
It's built on the robust and high-peformance foundation of PostgreSQL and TimescaleDB. It has native support for Prometheus metrics and OpenTelemetry traces as well as many other formats like StatsD, Jaeger and Zipkin through the OpenTelemetry Collector and is 100% PromQL compliant. It's full SQL capabilities enable developers to correlate metrics, traces and also business data to derive new valuable insights not possible when data is siloed in different systems.
Built on top of PostgreSQL and TimescaleDB it inherits rock-solid reliability, native compression up to 90%, continuous aggregates and the operational maturity of a system that is run on millions of instances worldwide.
For Prometheus users, Promscale provides a robust and highly scalable long-term storage system that is 100% PromQL compliant. ✅ Promscale has consistently been one of the only long-term stores for Prometheus data that continue to maintain its top-performance, receiving 100% compliance test score each time (with no cross-cutting concerns) from PromLab's PromQL Compliance Test Suite.
Tracing support is currently in beta. Read the documentation to get started.
For a detailed description of the initial architecture of Promscale for Prometheus metrics that covers some key design principles, please see our design doc.
If you have any questions, please join the #promscale channel on TimescaleDB Slack.
This repository also contains the source code for prom-migrator. Prom-migrator is an open-source, community-driven and free-to-use, universal prometheus data migration tool, that migrates data from one storage system to another, leveraging Prometheus's remote storage endpoints. For more information about prom-migrator, visit prom-migrator's README.
- About TimescaleDB
- Timescale cloud
- Features
- Installation
- Analyzing Data Using SQL
- Official Promscale Docs
- Tracing (beta)
- High Availability
- Multi-Node TimescaleDB
- Multi-tenancy
- Writing Metric Data
- Alerting
- Downsampling
- Deleting Data
- Quick Tips
- FAQ
- Contributing
TimescaleDB is a distributed time-series database built on PostgreSQL that scales to over 10 million of metrics per second, supports native compression, handles high cardinality, and offers native time-series capabilities, such as data retention policies, continuous aggregate views, downsampling, data gap-filling and interpolation.
TimescaleDB also supports full SQL, a variety of data types (numerics, text, arrays, JSON, booleans), and ACID semantics. Operationally mature capabilities include high-availability, streaming backups, upgrades over time, roles and permissions, and security.
TimescaleDB has a large and active user community (tens of millions of downloads, hundreds of thousands of active deployments, Slack channel with 7,000+ members). Users include Comcast, Fujitsu, Schneider Electric, Siemens, Walmart, Warner Music, and thousands of others.
Developers and organizations around the world trust TimescaleDB with their time-series data. AppDynamics (now part of Cisco Systems and one of the largest application performance monitoring providers) relies on TimescaleDB as its main metrics database. TimescaleDB is also the preferred (recommended) backend datasource for Zabbix users and is natively supported in Grafana.
Timescale cloud offers you an unrivalled experience of TimescaleDB.
All you have to do to integrate with Timescale cloud is configure the db uri using -db-uri flag in Promscale to database
instance running in Timescale cloud.
Note: Timescale cloud offers a 30-day free trial.
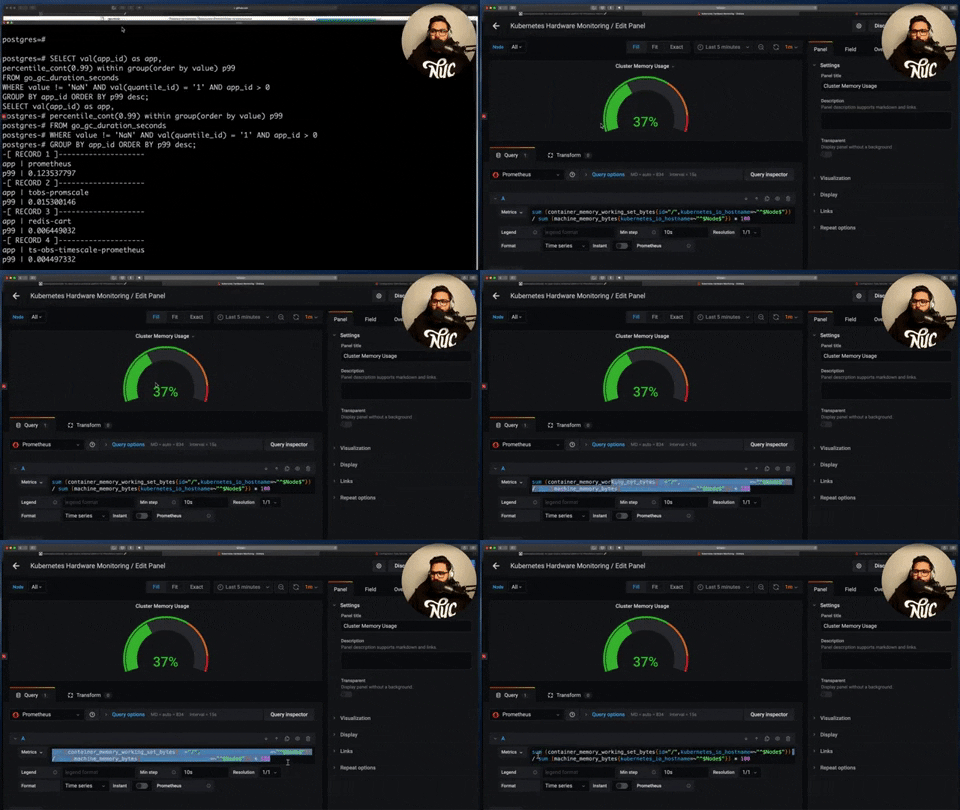
Click the video below for an overview of Promscale:
- Analysis in PromQL and SQL get the ability to analyze data in both query languages. Use PromQL for monitoring and alerting and SQL for deeper analytics and compatibility with a huge ecosystem of data visualization, analysis, and AI/ML tools.
- Rock-solid stability due to being built on top of PostgreSQL, with 30+ years of development work.
- Support for backfilling to ingest data from the past.
- Native support for Multi-Tenancy. Ingest data from multiple tenants and write queries across more than one tenant easily, using PromQL or SQL.
- High-Availability support for Prometheus HA deployments as well as high-availability deployments of TimescaleDB itself.
- Simple architecture. Unlike some other long-term stores, our architecture consists of only three components: Prometheus, Promscale, and TimescaleDB.
- ACID compliance to ensure consistency of your data.
- Horizontal scalability using multinode support with TimescaleDB version 2.0.
- Operationally mature. Built on top of Postgres, data written via Promscale is safe, reliable and offers all of the advantages of an operationally mature platform.
We have four main ways to set up Promscale:
The Observability Suite for Kubernetes is a CLI tool and Helm chart that makes installing a full observability suite into your Kubernetes cluster really easy. Tobs includes Prometheus, TimescaleDB, Promscale Connector, and Grafana.
To get started, run the following in your terminal, then follow the on-screen instructions.
curl --proto '=https' --tlsv1.2 -sSLf https://tsdb.co/install-tobs-sh |shOr visit the tobs GitHub repo for more information and instructions on advanced configuration.
We provide docker images with every release.
Instructions on how to use our docker images are available here.
We have pre-packaged binaries available for MacOS and Linux on both the x86_64 and i386 architectures. Instructions on how to use our prepackaged binaries are available here.
You can also build binaries from source.
A Helm chart for only the Promscale Connector is available in the helm-chart directory of this repository.
This is used as a Helm dependency from the tobs
Helm chart and can be used as a dependency in your own custom Helm chart as well.
We describe how to use our pre-defined views and functions to work with the prometheus data in the SQL schema doc.
A Reference for our SQL API is available here.
By default, data is stored for 90 days and then deleted. This default can be changed globally or overridden for individual metrics.
If using tobs, these settings can be changed using the
tobs metrics retention command (use
tobs metrics retention -h to see all options).
These setting can also be changed using the appropriate SQL commands.
The Promscale Connector can be used directly as a Prometheus Data Source in Grafana, or other software.
The connector implements some endpoints of the currently stable (V1) Prometheus HTTP
API. The API is
accessible at http://<promscale_connector_address>:9201/api/v1 and can be
used to execute instant or range PromQL queries against the data in
TimescaleDB, as well as retrieve the metadata for series, label names and
label values.
A Reference for the implemented endpoints of the Prometheus HTTP API is available here
You can limit the metrics being sent to the adapter (and thus being
stored in your long-term storage) by setting up write_relabel_configs
in Prometheus, via the prometheus.yml file.
Doing this can reduce the amount of space used by your database and thus
increase query performance.
The example below drops all metrics starting with the prefix go_,
which matches Golang process information exposed by exporters like
node_exporter:
remote_write:
 - url: "http://promscale_connector:9201/write"
   write_relabel_configs:
      - source_labels: [__name__]
        regex: 'go_.*'
        action: drop
Additional information about setting up relabel configs, the
source_labels field, and the possible actions can be found in the
Prometheus Docs.
We welcome contributions to the Promscale Connector, which is licensed and released under the open-source Apache License, Version 2. The same Contributor's Agreement applies as in TimescaleDB; please sign the Contributor License Agreement (CLA) if you're a new contributor.


