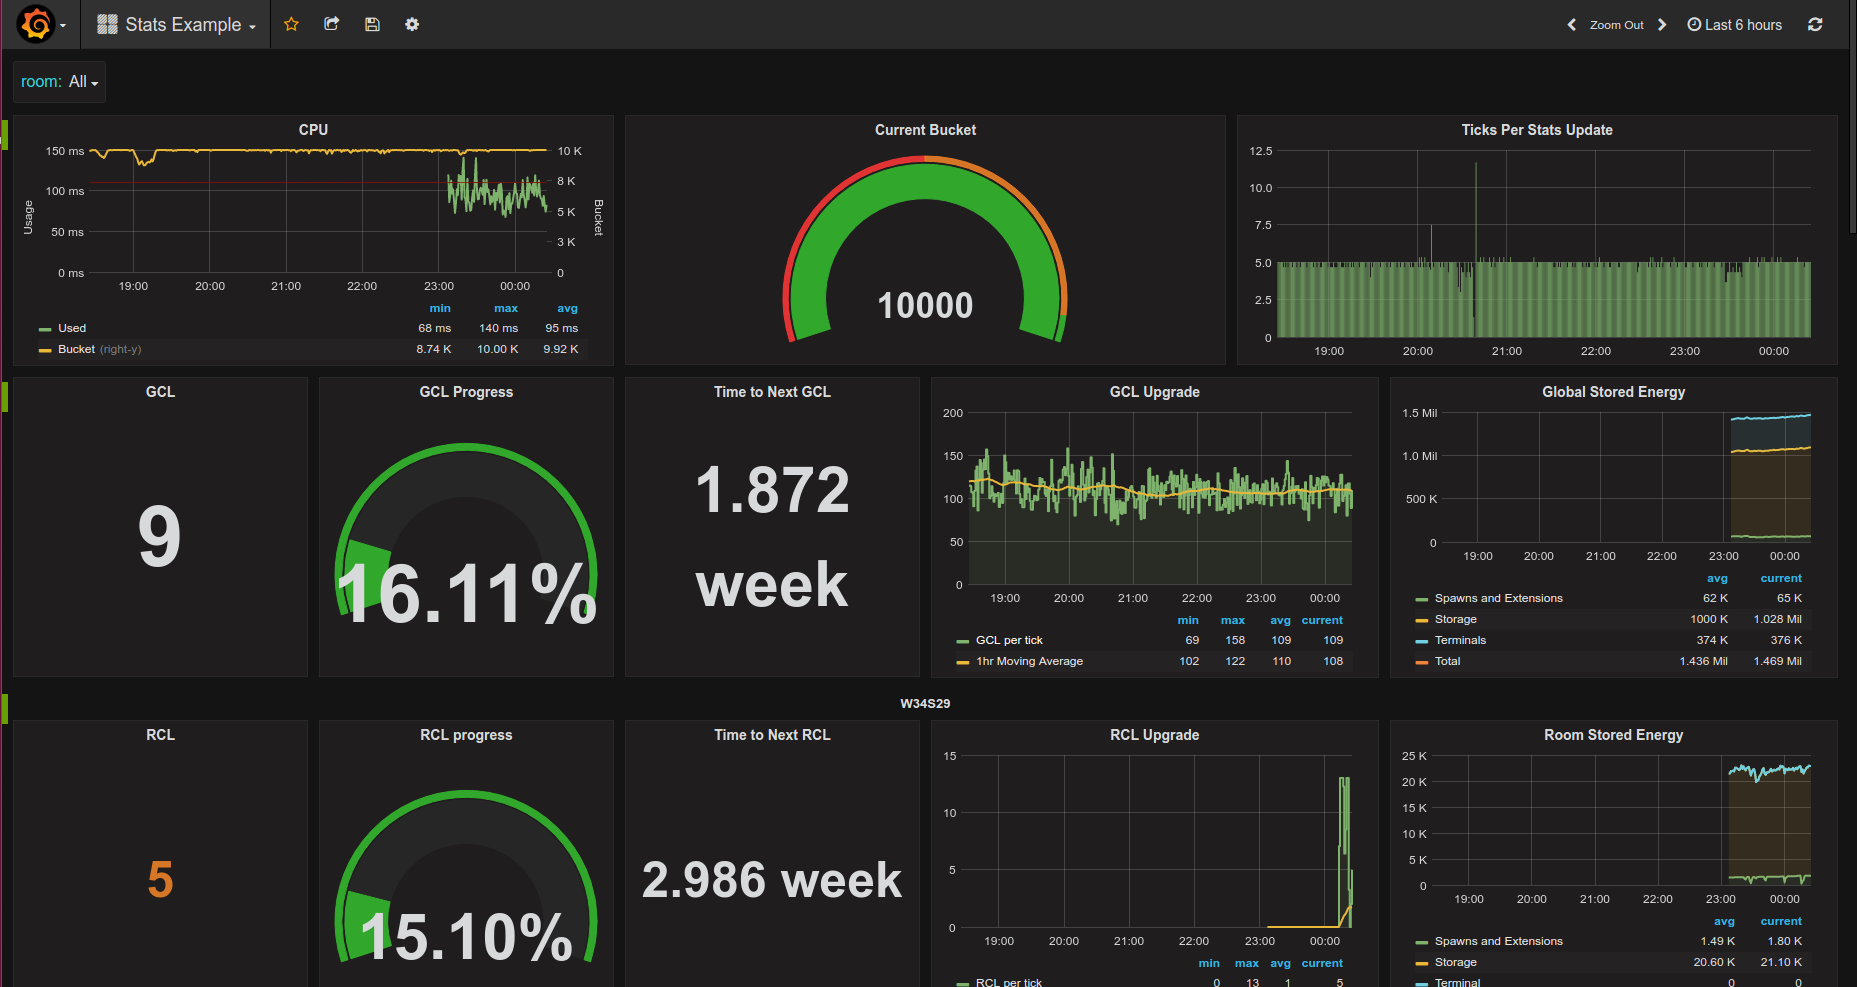
Pretty graphs for Screeps stats.

There are two ways to get started:
You can run this project locally, with all the drawbacks that entails.
Install docker
Install docker-compose
Copy and edit the example config file:
cp docker-compose.env.example docker-compose.env
$EDITOR docker-compose.env
Note: If you are using Docker Toolbox you will also need to expose the port 3000 via the virtualbox port forwarding feature.
Run the setup:
bash setup.sh
Go to http://localhost:3000 in your browser, then see Usage below.
Acquire a server, I use a t2.micro from Amazon Web Services. You can use anything running ubuntu with passwordless sudo.
Open ports 80 and 81 in your security groups.
SUPER IMPORTANT: MAKE SURE TO MOUNT A DATA VOLUME TO /dev/sdf IN THE AWS CONSOLE. IF YOU FAIL TO DO SO, YOUR DATA AND DASHBOARDS WILL BE LOST IF THE SERVER RESTARTS, THEN YOU WILL BE HELLA SALTY, AND I'LL JUST CROSS MY ARMS AND SAY "I TOLD YOU SO IN BOLDED ITALICS"
Install ansible.
Create a password for your screeps account if you haven't already.
You're now ready to run this whale of a command. Replace the stuff in caps with values that makes sense
ansible-playbook \
  -e screeps_username=YOURUSERNAME \
  -e screeps_password=YOURPASSWORD \
  -e screeps_email=YOUREMAIL \
  --user ubuntu \
  --private-key YOURPRIVATEKEY \
  -i ,YOURSERVERIP \
  playbook.yml
Don't remove the comma before YOURSERVERIP. You will get a mysterious error. If you pass your IP like ,12.34.56.78 you are doing it correctly.
If the run errors out, check your parameters and retry. It is common to see transient errors from Apt or GPG, which are both fixed by re-running.
You are now ready to use grafana!
Go to http://localhost:3000 or your own real-life server's IP. Login with the following default credentials: NOTE: On Windows running Docker Toolbox use http://192.168.99.100:3000 instead
username: admin
password: admin
You are now ready to create some dashboards.
To use the Sample Dashboard, copy the contents of stats.js A sample dashboard is already installed that displays the stats from stats.js
To send stats to the dashboard, simply write them to Memory.stats. For example:
Memory.stats["room." + room.name + ".energyAvailable"] = room.energyAvailable;
Memory.stats["room." + room.name + ".energyCapacityAvailable"] = room.energyCapacityAvailable;
Memory.stats["room." + room.name + ".controllerProgress"] = room.controller.progress;
All values on the Memory.stats object are forwarded to Grafana verbatim.
Just run
docker-compose exec grafana grafana-cli plugins install grafana-clock-panel
to install the plugins, then
docker-compose restart grafana
to apply. Refresh your browser and voila!
If you need to alter the container e.g. because you edited the coffeescript that fetches the stats, you can rebuild and restart the container like this:
docker-compose down && docker-compose build node && docker-compose up -d
The stats data and grafana config are stored in persistent volumes so will be preserved after you restart the container.
Note: older versions of the docker-compose.yml container description file did not store these data in persistent volumes so they will disappear after you run this command. These still exist on disc in anonymous volumes so could be recovered with some effort.
This software is licensed under the MIT License. See the LICENSE file for more information.