Webserver: micfunpred.microdm.net.in
MicFunPred: A conserved approach to predict functional profiles from 16S rRNA gene sequence data
There are multiple tools available for the prediction of functional profiles like PICRUSt, Piphillin, Tax4Fun and others. These tools predicts the gene contents of organism without sequenced genomes (at strain level) by using phylogenetic or non-phylogenetic approaches. But, taxonomic identification using one or multiple variable regions of 16S rRNA gene beyond genus level may not be reliable. Secondly, due to database dependency and ever growing reference database size, regular updates are required by these tools. Hence, we proposed a conserved approach to predict gene contents of each genera by considering core genes.
MicFunPred relies on ~32,000 genome sequences downloaded from Integrated Microbial Genome database (IMG) representing human, plants, mammals, aquatic and terrestrial ecosystem. 16S rRNA database was constructed using sequences from these genomes and available databases oclustered at 97% identity. MicFunPred is able to predict functional profiles in terms of KEGG Orthology (KO), Enzyme Commission (EC), PFam, TIGRFAM and Cluster of Genes (COG).

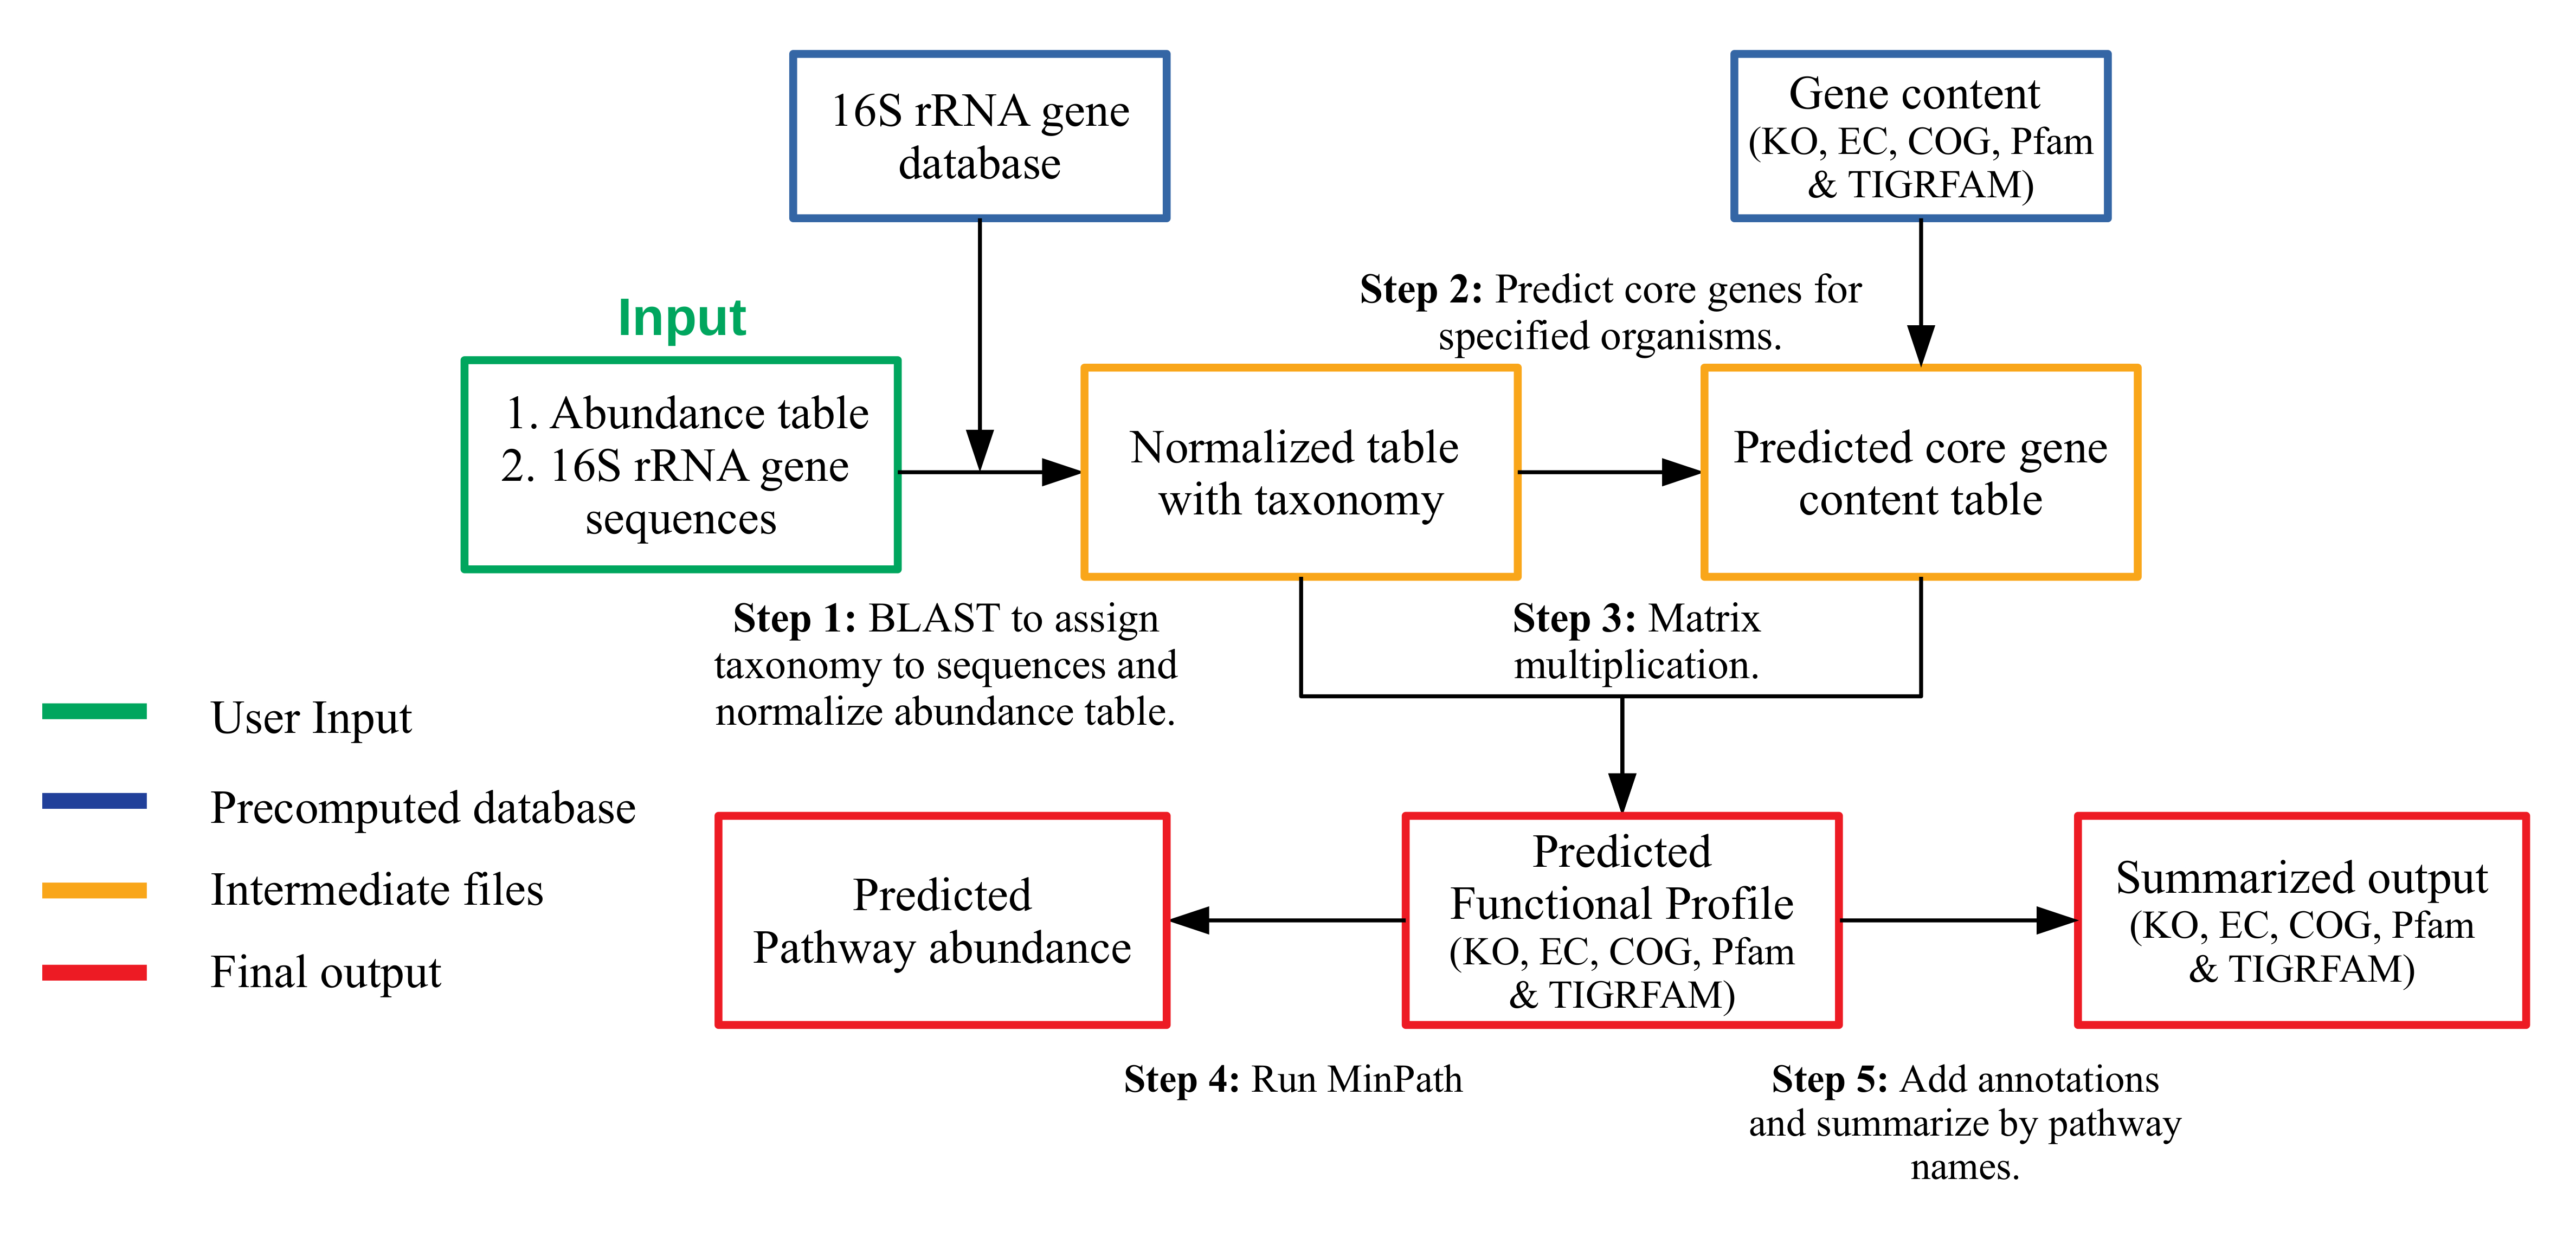
MicFunPred is database/approach independent hence, 16S sequence data processed using QIIME1/2 or DADA2 with any database can be used. MicFunPred follows multiple steps to predict functional profiles:
Input files:
- Abundance/BIOM table (tab separated)
- OTUs/ASVs sequences (FASTA format)
MicFunPred starts by aligning OTUs/ASVs sequences on custom 16S rRNA database using BLAST and assigns genus level taxonomy to each sequence based on user defined percent identity cut-off (-p).
The OTU/ASV ids from abundance table are replace by assigned genus and the table is then consolidated and normalized using mean 16S rRNA gene copy numbers of respective genera.
The core genes for each genera present in abundance table generated above are predicted as per user defined gene coverage cut-off (-c). The core gene is defined as the gene present in x% of the genomes of respective genera. Here, x is gene coverage cut-off and can be adjusted by user (0-1). The value of '0' disables the prediction of core genes.
The multiplication of abundance table and core gene content table is generated as metagenomic profiles in terms of gene families as stated above.
MinPath is used to predict KEGG and MetaCyc pathways with more stringency.
# create conda environment
conda create -n micfunpred python=3.10
conda activate micfunpred

# install dependencies
# blast
conda install -c bioconda blast
# glpk-utils
conda install -c conda-forge glpk

# install MicFunPred
git clone https://github.com/microDM/MicFunPred.git
cd MicFunPred
pip install .
MicFunPred_run_pipeline.py -h
usage: MicFunPred_run_pipeline.py [-h] [-i PATH] [-r PATH] [-p PERC_IDENT] [-b PATH] [-d PATH] [-c GENECOV] [-o PATH] [-t INT] [-v] [--contrib]

options:
  -h, --help            show this help message and exit

Required:
  -i PATH, --otu_table PATH
                        Tab delimited OTU table
  -r PATH, --repset_seq PATH
                        Multi-fasta file of OTU/ASV sequences

Optional:
  -p PERC_IDENT, --perc_ident PERC_IDENT
                        [Optional] Percent identity cut-off to assign genus. (default: 97)
  -b PATH, --blastout PATH
                        Blast output of ASV/OTU sequences with any database in output format 6
  -d PATH, --blast_db PATH
                        Path to custom blast db to run blast with
  -c GENECOV, --genecov GENECOV
                        [Optional] Percentage of organism in a genus which should have gene to define it as core. Value ranges from 0 to 1 (default: 0.5)
  -o PATH, --output PATH
                        [Optional] Output directory (default: MicFunPred_out)
  -t INT, --threads INT
                        (Optional) number of threads to be used. (default: 1)
  -v, --verbose         Print message of each step to stdout.
  --contrib             Calculate taxon contribution of functions
MicFunPred_run_pipeline.py -i test_data/test_counts.tsv -r test_data/test.fasta -o test_data/micfunpred_out --verbose
The output directory will have following files:
├── COG_metagenome
│   ├── COG_metagenome.tsv.gz
│   ├── COG_metagenome_with_description.tsv.gz
│   └── COG_taxon_contrib.tsv.gz
├── KO_metagenome
│   ├── KO_level_taxon_contrib.html
│   ├── KO_level_taxon_contrib.tsv.gz
│   ├── KO_metagenome.tsv.gz
│   ├── KO_metagenome_minPath_pruned.txt
│   ├── KO_metagenome_with_description.tsv.gz
│   ├── KO_taxon_contrib.tsv.gz
│   ├── minpath.out
│   ├── minpath_in.ko
│   ├── summarized_by_A.tsv.gz
│   ├── summarized_by_B.tsv.gz
│   ├── summarized_by_C.tsv.gz
│   └── summarized_by_Pathway_Module.tsv.gz
├── MetaCyc_metagenome
│   ├── EC_metagenome.tsv.gz
│   ├── EC_taxon_contrib.tsv.gz
│   ├── PathwayAbundance.tsv.gz
│   ├── PathwayAbundance_with_names.tsv.gz
│   ├── Pathway_summarize_by_Types.tsv.gz
│   ├── RXN_metagenome.tsv.gz
│   └── minPath_files
│       ├── sample1_minpath.out
│       ├── sample1_minpath.out.details
│       ├── sample1_minpath_in.txt
│       ├── sample2_minpath.out
│       ├── sample2_minpath.out.details
│       ├── sample2_minpath_in.txt
│       ├── sample3_minpath.out
│       ├── sample3_minpath.out.details
│       ├── sample3_minpath_in.txt
│       ├── sample4_minpath.out
│       ├── sample4_minpath.out.details
│       ├── sample4_minpath_in.txt
│       ├── sample5_minpath.out
│       ├── sample5_minpath.out.details
│       └── sample5_minpath_in.txt
├── Pfam_metagenome
│   ├── Pfam_metagenome.tsv.gz
│   ├── Pfam_metagenome_with_description.tsv.gz
│   └── Pfam_taxon_contrib.tsv.gz
├── TIGRFAM_metagenome
│   ├── TIGRFAM_metagenome.tsv.gz
│   ├── TIGRFAM_metagenome_with_description.tsv.gz
│   └── TIGRFAM_taxon_contrib.tsv.gz
├── out.blast
├── predicted_16S_copy_numbers.txt
├── predicted_COG.tsv.gz
├── predicted_EC.tsv.gz
├── predicted_KO.tsv.gz
├── predicted_Pfam.tsv.gz
├── predicted_TIGRFAM.tsv.gz
├── tax_abund.table
└── tax_abund_normalized.table

6 directories, 51 files
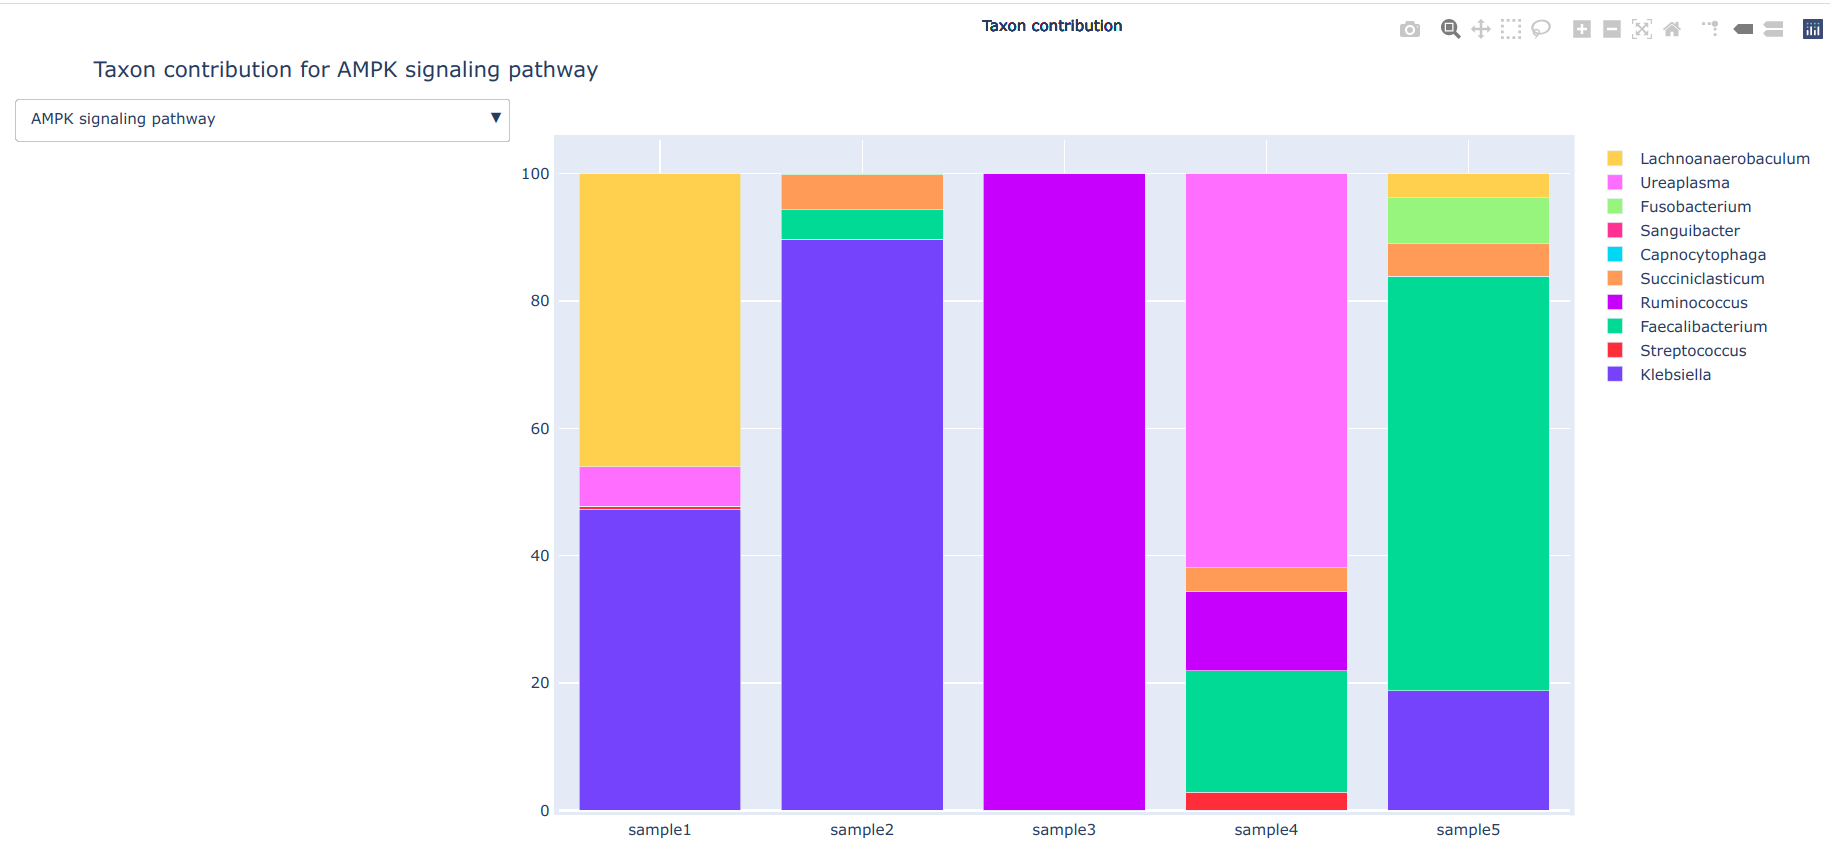
This plot is generated using Python plotly==4.9.0. Different pathways can be browse using dropdown button and plots can be saved in '.png' format.
We would like to thanks Department of Biotechnology, Government of India and National Centre for Cell Science, Pune for funding and support. We would also like to thank contributors Nikeeta Chavan, Nitin Narwade and Dhiraj Dhotre

