A simple tool to generate a call graph for calls within Windows CMD (batch) files.
The tool is available on PyPI: https://pypi.org/project/cmd-call-graph/
By default, it takes the input file as stdin and outputs the resulting file to stdout, outputting logs and errors to stderr.
Given the following CMD script:
@echo off
call :foo
goto :eof
:bar
    echo "in bar"
    call :baz
    call :baz
:baz
    echo "in baz"
    call powershell.exe Write-Host "Hello World from PowerShell"

:foo
    echo "In foo"
    goto :bar
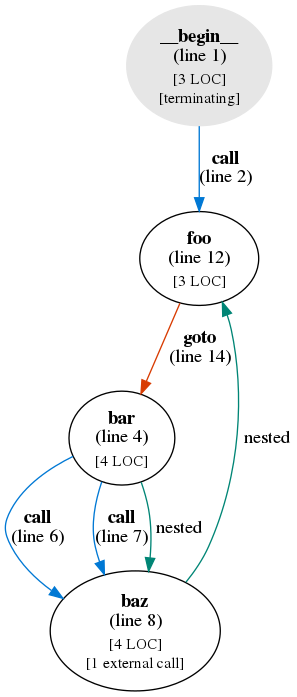
This script would generate the following graph:
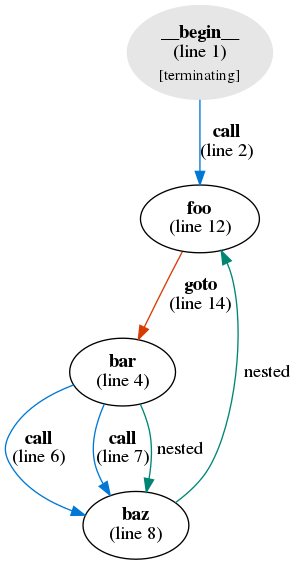
If the --hide-node-stats option is enabled, then the following graph would be generated:
Invocation example for Ubuntu Linux and WSL (Windows Subsystem for Linux), assumes
Python and pip are installed:
$ pip install cmd-call-graph
$ cmd-call-graph < your-file.cmd > your-file-call-graph.dot 2>log
The resulting dot file can be rendered with any dot renderer. Example with
graphviz (VIEWER could be explorer.exe under Windows):
$ sudo apt install graphviz
$ dot -Tpng your-file-call-graph.dot > your-file-call-graph.png
$ $VIEWER your-file-call-graph.png
Example with PowerShell:
PS C:\> choco install graphviz python3 pip
PS C:\> cmd-call-graph.exe -i your-file.cmd -o your-file-call-graph.dot
PS C:\> dot.exe -Tpng your-file-call-graph.dot -O
PS C:\> explorer.exe your-file-call-graph.dot.pngThe script analyzes CMD scripts, and represents each block of text under a given label as a node in the call graph.
Each node always contains the line number where it starts, except if the node is never defined in the code,
which can happen in case of programming errors, dynamic node names (e.g., %command%) and the eof pseudo-node.
If a node causes the program to exit, it is marked as terminating.
Each node contains the following extra stats, if present:
- number of lines of code (
LOC); - number of external calls.
There are 2 special nodes:
_begin_is a pseudo-node inserted at the start of each call graph, which represents the start of the script, which is by definition without a label;eof, which may or may not be a pseudo-node. In CMD,eofis a special node that is used as target ofgototo indicate that the current "subroutine" should terminate, or the whole program should terminate if the call stack is empty.
The eof node is automatically removed if it's a pseudo-node and it's not reached via call or nested
connections.
The _begin_ pseudo-node is removed if there is another node starting at line 1.
goto: if an edge of typegotogoes fromAtoB, it means that in the code within the labelAthere is an instruction in the formgoto :B.call: if an edge of typecallgoes fromAtoB, it means that in the code within the labelAthere is an instruction in the formcall :B.nested: if an edge of typenestedgoes fromAtoB, it means that in the code within the labelAends directly whereBstarts, and there is nogotoorexitstatement at the end ofAwhich would prevent the execution from not going intoBasAends.
Example of a nested connection:
A:
  echo "foo"
  echo "bar"
B:
  echo "baz"
The above code would lead to a nested connection between A and B.
The input file needs to be passed as an argument.
--simplify-calls: create one edge for each type of connection instead of creating one for each individualcall/goto(which is the default). Leads to a simpler but less accurate graph;--hide-node-stats: removes from each node additional information about itself (i.e., number of lines of code, number of external calls);--nodes-to-hide: hides the list of nodes passed as a space-separated list after this parameter.-vor--verbose: enable debug output, which will be sent to the log file;-lor--log-file: name of the log file. If not specified, the standard error file is used;-oor--output: name of the output file. If not specified, the standard output file is used.
The graphs are self-explanatory: all information is codified with descriptive labels, and there is no information conveyed only with color or other types of non-text graphical hint.
Colors are used to make the graph easier to follow, but no information is conveyed only with color.
Here is what each color means in the graph:
- Orange:
gotoconnection; - Blue:
callconnection; - Teal:
nestedconnection; - Light gray: background for terminating nodes
Sometimes legacy code bases may contain old CMD files. This tool allows to generate a visual representation of the internal calls within the script.
This project welcomes contributions and suggestions. Most contributions require you to agree to a Contributor License Agreement (CLA) declaring that you have the right to, and actually do, grant us the rights to use your contribution. For details, visit https://cla.microsoft.com.
When you submit a pull request, a CLA-bot will automatically determine whether you need to provide a CLA and decorate the PR appropriately (e.g., label, comment). Simply follow the instructions provided by the bot. You will only need to do this once across all repos using our CLA.
This project has adopted the Microsoft Open Source Code of Conduct. For more information see the Code of Conduct FAQ or contact opencode@microsoft.com with any additional questions or comments.
Run unit tests from the project root either with the built-in unittest module:
python -m unittest discover
Or by using pytests, which can produce reports both for unit test success and for code coverage, by
using the following invocation:
pip install pytest
pip install pytest-cov
pytest tests --doctest-modules --junitxml=junit/test-results.xml --cov=callgraph --cov-report=xml --cov-report=html


