A VS Code extension to inspect deoptimizations, ICs, function states, V8 maps, and cpu profiling data for your JavaScript and TypeScript code running in V8 (i.e., Edge, Chrome, NodeJS, etc.).
Deopt Explorer is a tool for visualizing V8 trace log information in VS Code. This can give you insight into the inner workings of V8's optimizing compiler that can be used to analyze your code to look for possible causes for performance regressions. This tool is primarily designed for advanced users who have an understanding of V8's internals. It does not provide recommendations for performance improvements, but does give you access to information that you can use to make informed decisions about the performance of your code.
The information provided by Deopt Explorer can be broken down into several categories:
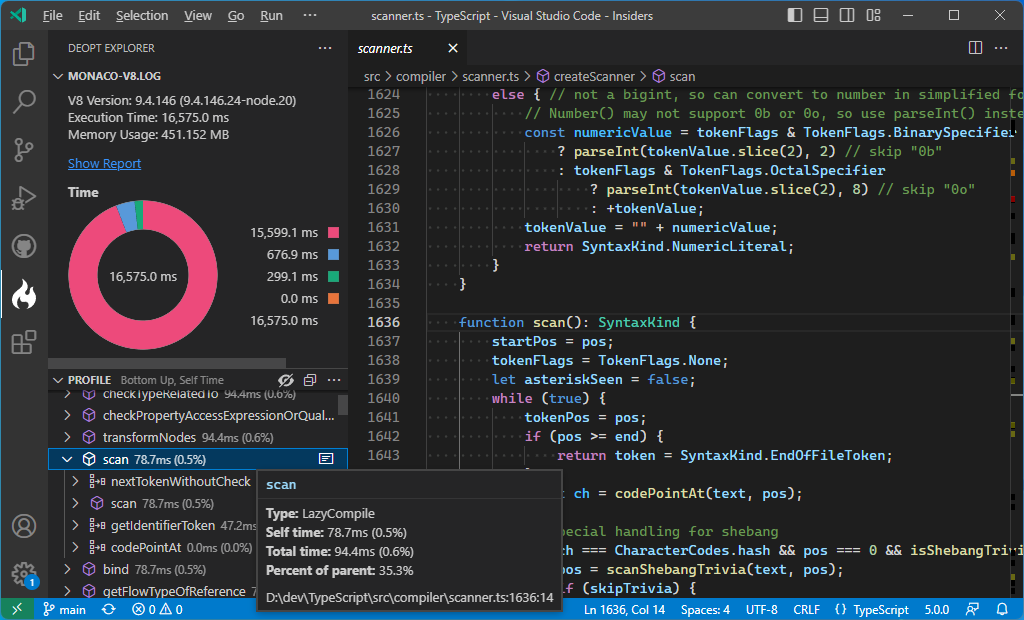
- CPU Profiles — Provides a tree view to view CPU profiling information.
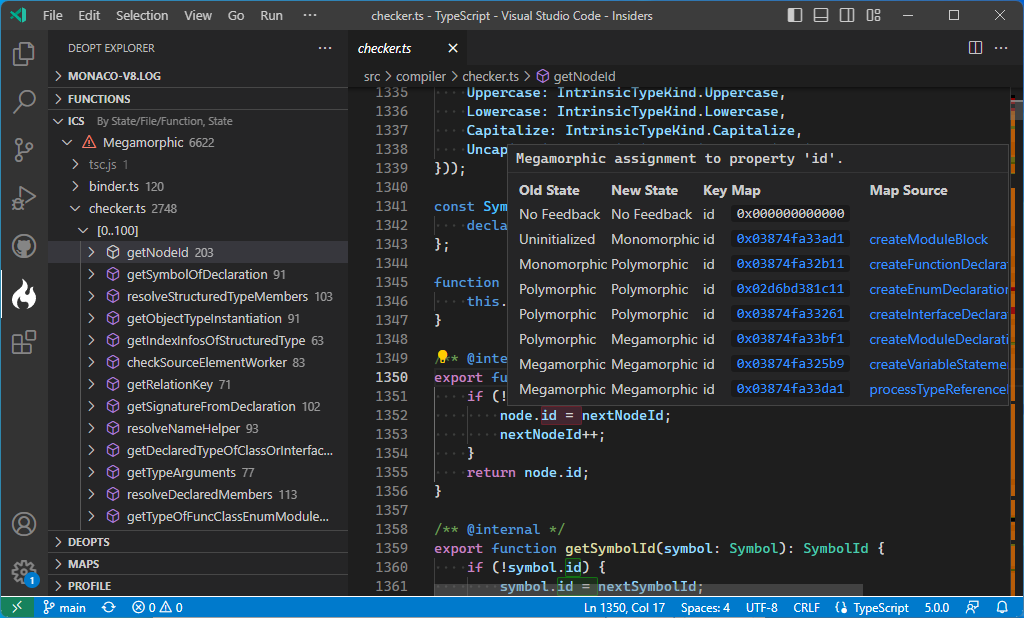
- Inline Cache evolution — Inspect how an Inline Cache evolves during execution.
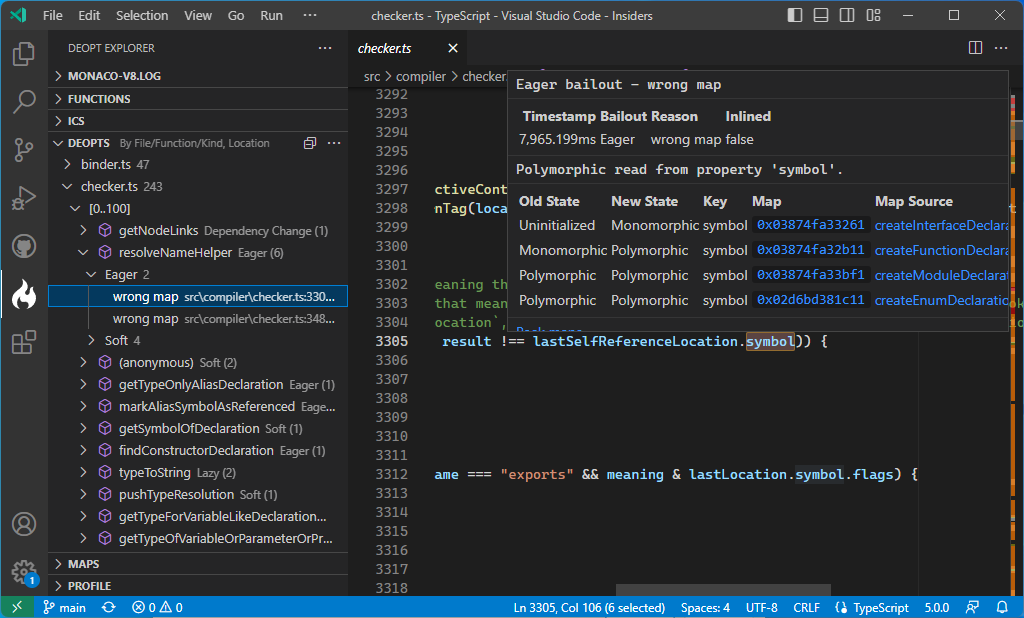
- Deoptimizations — View the kinds of deoptimizations that occured in a function.
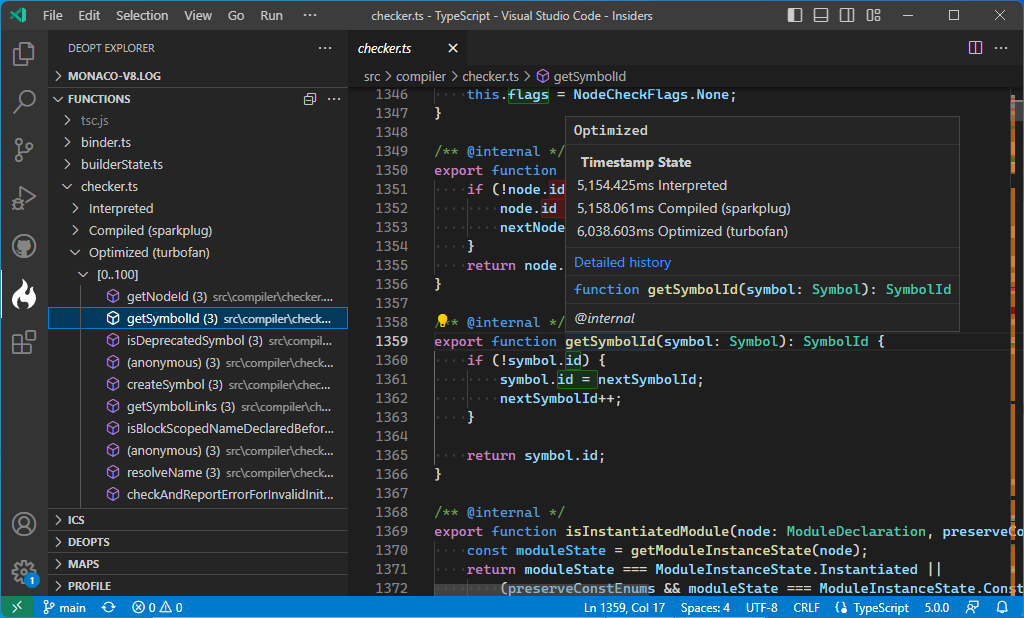
- Function State — View whether a function was interpreted or compiled.
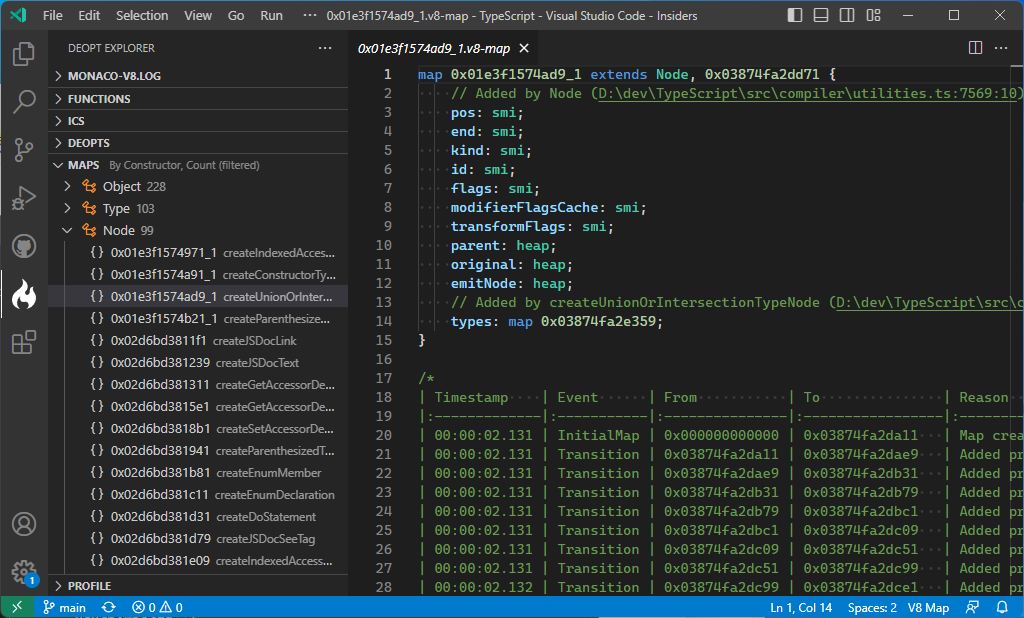
- Maps — View the types of each object encountered by V8.
Deopt Explorer can read trace file output from the --prof command line option to provide a tree view that allows you
to view Top Down (Call Tree), Bottom Up, and Flat views, similar to the Chrome Dev Tools:
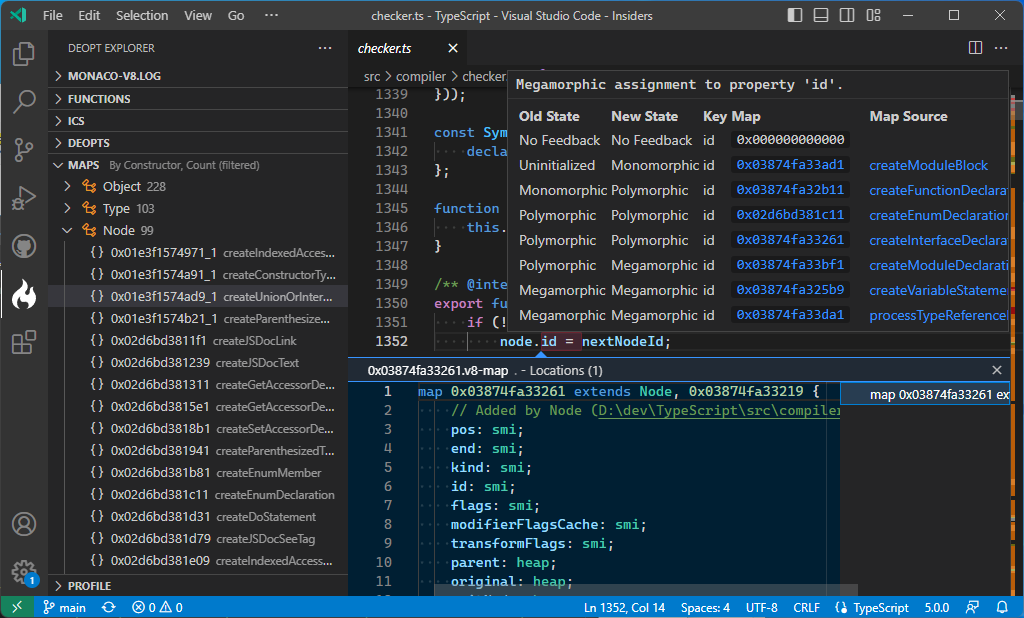
Using the ICS tree view, you can navigate IC events and used editor decorations and hover information to inspect how
an Inline Cache (IC) evolves based on the types of values encountered by V8's interpreter and optimizing compiler:
Deopt Explorer provides information on when V8's optimizing compiler switches back to the interpreter to collect type feedback that is used to patch a function when different types are encountered:
Deopt Explorer provides information on the state of a JavaScript function, such as whether a function was executed enough times to be optimized by the optimizing compiler, rather than being run purely in the interpreter:
V8 keeps track of the layout of objects in memory in what is known as a "Map" (not to be confused with the JavaScript
Map object). This extension allows you to view the various Maps encountered by an Inline Cache, and trace each
property in a Map back to the function that assigned it. This can allow you to investigate and reduce unnecessary
polymorphism in your code:
You can also peek at the maps associated with an IC event:
Deopt Explorer gathers deoptimizations from a V8 log file you can generate from the command line. The easiest
way to generate a log compatible with your current NodeJS install is to use dexnode.
dexnode is a commandline utility published on NPM. It wraps the existing node
executable to provide the commandline options necessary to generate a v8 log that can be consumed by Deopt Explorer.
npm install --global dexnode# NodeJS (via global install)
dexnode myscript.js
# NodeJS (via `npm exec`)
npm exec dexnode myscript.js
# Deno (via `deno run`)
deno run -A npm:dexnode myscript.jsdexnode [options] [--] <executable> [executable_options]
options:
-h --help print this message
--no-maps exclude v8 maps from log
--no-ics exclude ics from log
--no-deopts exclude deopts from log
--no-profile exclude cpu profile from log
--no-sources exclude sources from log
--no-quiet write dexnode messages to stdout (default)
--maps include v8 maps in log (default)
--ics include ics in log (default)
--deopts include deopts in log (default)
--profile include cpu profile in log (default)
--sources include sources in log (default)
--quiet do not write dexnode messages to stdout
--out FILE write all log output to FILE (default: isolate-<pid>-<isolate id>-v8.log)
-- pass all remaining arguments to node
You can also pass the requisite commandline options directly to the node process. Since V8 is constantly evolving, the
exact command line switches depend on the version of V8, NodeJS, etc. Running with the requisite switches will create an
isolate-<id>-v8.log file in the current directory that can be consumed by Deopt Explorer.
node \
  --prof \
  --log-deopt \
  --log-ic \
  --log-maps \
  --log-maps-details \
  --log-internal-timer-events \
  --log-code \
  --log-source-code \
  --detailed-line-info \
path/to/file.jsnode \
--prof \
--trace-ic \
--trace-maps \
--trace-maps-details \
--log-internal-timer-events \
--log-code \
--log-source-code \
--detailed-line-info \
path/to/file.jsThe options provided above have the following effects on the output log file, which are leveraged by Deopt Explorer:
--prof— Writes statistical profiling information to the log (implies--log-code, see below).- Deopt Explorer uses the profiling information to generate a navigable CPU profile and to generate graphs that indicate where time is spent during execution.
--log-deopt— Writes code deoptimization events to the log.- Deopt Explorer uses this information to track and provide explanations for deoptimizations that happen during execution.
--log-ic/--trace-ic— Writes inline cache (IC) state transitions to the log.- Deopt Explorer uses this information to track and provide explanations for the various optimizations and deoptimizations that happen during execution, such as when a function transitions from being "monomorphic" to becoming "polymorphic" due to differing inputs.
--log-maps/--trace-maps— Writes information about v8 "maps" (the internal representation of a JavaScript Object's structure and properties) to the log.- Deopt Explorer uses this to provide detailed information about the various "maps" v8 encounters to help isolate differences in object shape that might cause inline cache misses and trigger recompilation
--log-maps-details/--trace-maps-details— Writes additional details about v8 "maps" to the log.- Deopt Explorer provides this additional information when viewing a map.
--log-internal-timer-events— Writes internal V8 timer events to the log file.- Deopt Explorer uses these events to generate graphs that indicate wheere time is spent during execution.
--log-code— Writes code events to the log file (automatically set if--profis provided).- Deopt Explorer uses this information to track function addresses and deoptimization bailouts.
--log-source-code— Writes the script ID, URL (or path), and source text for each script evaluated by V8.- Deopt Explorer uses this information to get accurate line/column mappings for sources, and makes the log file portable to other machines for analysis.
- NOTE: This setting is optional. Deopt Explorer will attempt to resolve the source code from the file system for the scripts it encounters.
--detailed-line-info— Writes detailed line information to the log file for use with CPU profiling.- Deopt Explorer uses this information to get accurate line/column mappings.
NOTE: Some flags are not supported in all versions of v8/NodeJS. You may omit flags that are not available and Deopt Explorer will still work, though with reduced functionality.
In addition, you can customize the log file name and location using the following options:
--logfile="path/to/file.log"- Sets the name of the output log file. If log files are generated per isolate (the default), anisolate-<id>-prefix will be prepended to the file name.--no-logfile-per-isolate- Disables generation of a separate log file per isolate.
From within VS Code, execute the Deopt Explorer: Open V8 Log command. This will add highlighting for various
optimization hints in the related source code files:
- Highlighting and diagnostics for Eager, Lazy, Soft, and Debugger deoptimizations.
- Highlighting for IC hints, such as polymorphic and megamorphic property access.
- Highlighting for Optimization state for functions.
To use Deopt Explorer with Chrome, Edge, or other Chromium based browsers, you must specify the --no-sandbox
commandline option and encode the same V8 options from Options Overview as a comma-separated list
passed via the --js-flags option. For example:
chrome \
  --no-sandbox \
  --js-flags=--log-deopt,--log-ic,--log-maps,--log-maps-details,--log-internal-timer-events,--prof,... <URL>
It may be necessary to ensure all existing browser processes are closed before launching the browser. On Android, it may
also be necessary to specify the --single-process option due to Android's sandboxing rules:
chrome \
  --no-sandbox \
  --single-process \
  --js-flags=--log-deopt,--log-ic,--log-maps,--log-maps-details,--log-internal-timer-events,--prof,... <URL>
V8 changes frequently in ways that can break this tool. While I try to keep this up to date with engine releases, and support multiple versions of the engine, it can be difficult for one person to keep on top of breaking changes. If you find the extension is not working for you and you are using a more recent version of NodeJS or the V8 engine, please file an issue. Log parsing failures should show up in the Output Window for the "Deopt Explorer" extension.
Deopt Explorer is free and open-source software and is licensed under the MIT License.
Deopt Explorer was made possible by building on the works of other talented engineers. You can find more information about the licenses for these projects in THIRD_PARTY_LICENSES. This includes:
- V8 (LICENSE.v8)
- Chromium (LICENSE.chromium)
- Visual Studio Code (LICENSE.vscode)
- Deoptigate (LICENSE.deoptigate), by Thorsten Lorenz (@thlorenz).
This project may contain trademarks or logos for projects, products, or services. Authorized use of Microsoft trademarks or logos is subject to and must follow Microsoft’s Trademark & Brand Guidelines. Use of Microsoft trademarks or logos in modified versions of this project must not cause confusion or imply Microsoft sponsorship. Any use of third-party trademarks or logos are subject to those third-party’s policies.
