The waterfall_ax library creates flexible waterfall charts based on matplotlib.
pip install waterfall-ax
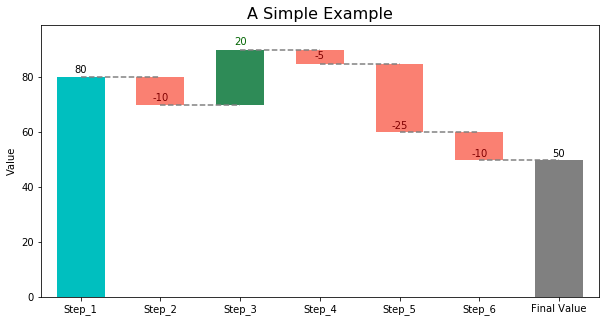
To create a waterfall chart, simply provide the cumulative values you'd like to plot. The intermediate deltas will be calculated in the backend.
Sample code:
from waterfall_ax import WaterfallChart
import matplotlib.pyplot as plt

# Cumulative values
step_values = [80, 70, 90, 85, 60, 50]

# Plot
waterfall = WaterfallChart(step_values)
wf_ax = waterfall.plot_waterfall(title='A Simple Example')
plt.show()
waterfall_ax makes it very flexible to create and edit the waterfall charts. Here are some examples.
-
Style Control. You have control over the bar style, line style and labels. Please refer to waterfall_ax.py for details.
In short,
- For the bar and line elements you can pass any kwargs that matplotlib accepts for these two styles
- For labels, you can set step_names, metric_name, last_step_label, and bar_labels.
Here is an example:
# Labels metric_name = 'Balance' step_names = ['Balance0', 'Spend_clothes', 'Salary', 'Spend_grocery', 'Spend_phone', 'Spend_parking'] last_step_label = 'End Balance' # Styles bar_labels = [x for x in range(7)] bar_kwargs = {'edgecolor': 'black'} line_kwargs = {'color': 'red'} # Plot waterfall waterfall = WaterfallChart( step_values, step_names=step_names, metric_name=metric_name, last_step_label=last_step_label ) wf_ax = waterfall.plot_waterfall( title='Change Styles and Labels', bar_labels = bar_labels, bar_kwargs = bar_kwargs, line_kwargs = line_kwargs ) plt.show() -
Color Control. You can change colors for:
- Bar color for positive deltas
- Bar color for negative deltas
- Bar color for the very first bar
- Bar color for the last bar
- Label text color for positive deltas
- Label text color for negative deltas
- Label text color for the very first bar
- Label text color for the last bar
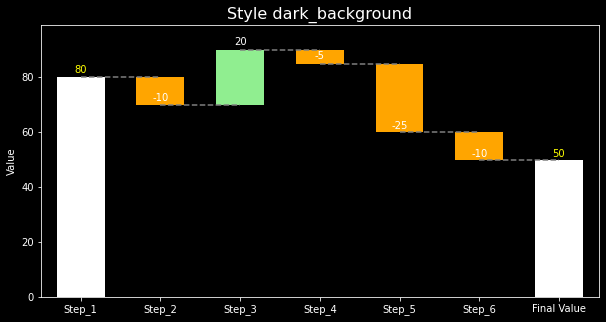
As a result, the waterfall charts can work very well for a variety of styles. An example:
# Set style plt.style.use('dark_background') # Plot waterfall = WaterfallChart(step_values) color_kwargs = { 'c_bar_pos': 'lightgreen', 'c_bar_neg': 'orange', 'c_bar_start': 'white', 'c_bar_end': 'white', 'c_text_pos': 'white', 'c_text_neg': 'white', 'c_text_start': 'yellow', 'c_text_end': 'yellow' } wf_ax = waterfall.plot_waterfall(title='Style dark_background', color_kwargs=color_kwargs) plt.show() -
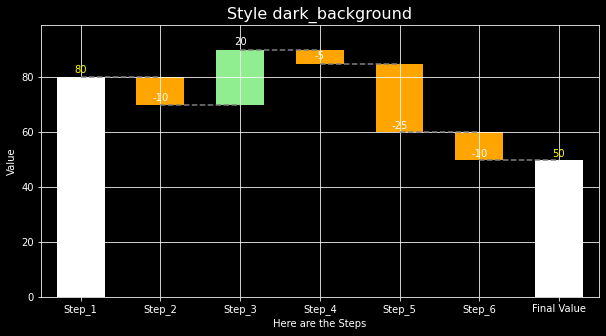
Continue Editing. The plot_waterfall() function returns an Axes object and can also take in an . So it’s very flexible to use the object outside the class for further editing. An example by following the previous style:
# Add grid and xlabel after the waterfall ax is created wf_ax = waterfall.plot_waterfall(title='Style dark_background', color_kwargs=color_kwargs) plt.grid(True) plt.xlabel('Here are the Steps') plt.show() -
As a subplot. The plot_waterfall() function can also take an exising Axes, so that it's easy to make the waterfall chart a subplot. An example:
# Set style
plt.style.use('ggplot')

# Create subplots
fig, axs = plt.subplots(1, 2, figsize=(15, 4))
ax1, ax2 = axs
ax1.plot(range(10))
ax1.set_title('First subplot')

# Plot waterfall
waterfall = WaterfallChart(step_values)
wf_ax = waterfall.plot_waterfall(ax=ax2, title='Waterfall as a subplot')
plt.show()


