Protest Activity Detection and Perceived Violence Estimation from Social Media Images Implementation of the model used in the paper Protest Activity Detection and Perceived Violence Estimation from Social Media Images [arxiv] by Donghyeon Won , Zachary C. Steinert-Threlkeld , Jungseock Joo .
Pytorch NumPy pandas scikit-learn
python train.py --data_dir UCLA-protest/ --batch_size 32 --lr 0.002 --print_freq 100 --epochs 100 --cuda python pred.py --img_dir path/to/some/image/directory/ --output_csvpath result.csv --model model_best.pth.tar --cuda UCLA Protest Image Dataset
# of images: 40,764
Protest & Visual Attributes
Fields
Protest
Sign
Photo
Fire
Police
Children
Group>20
Group>100
Flag
Night
Shouting
# of Images
11,659
9,669
428
667
792
347
8,510
2,939
970
987
548
Positive Rate
0.286
0.829
0.037
0.057
0.068
0.030
0.730
0.252
0.083
0.085
0.047
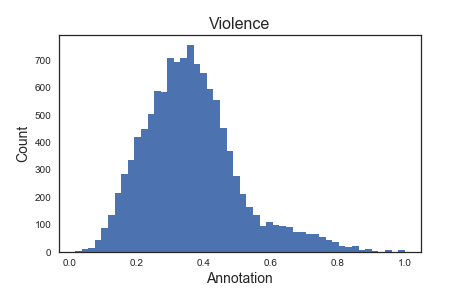
Mean
Median
STD
0.365
0.352
0.144
We fine-tuned ImageNet pretrained ResNet50 to our data. You can download the model I trained from this Dropbox link .
 You will need to download our UCLA Protest Image Dataset to train the model. Please e-mail me if you want to download our dataset!


