![]()
Chart.js module for charting venn diagrams with up to five sets. Adding new chart type: venn and euler.
Check out also my other chart.js plugins:
- chartjs-chart-boxplot for rendering boxplots and violin plots
- chartjs-chart-error-bars for rendering errors bars to bars and line charts
- chartjs-chart-geo for rendering map, bubble maps, and choropleth charts
- chartjs-chart-graph for rendering graphs, trees, and networks
- chartjs-chart-pcp for rendering parallel coordinate plots
- chartjs-chart-wordcloud for rendering word clouds
- chartjs-plugin-hierarchical for rendering hierarchical categorical axes which can be expanded and collapsed
npm install --save chart.js chartjs-chart-vennsee Samples on Github
or at this
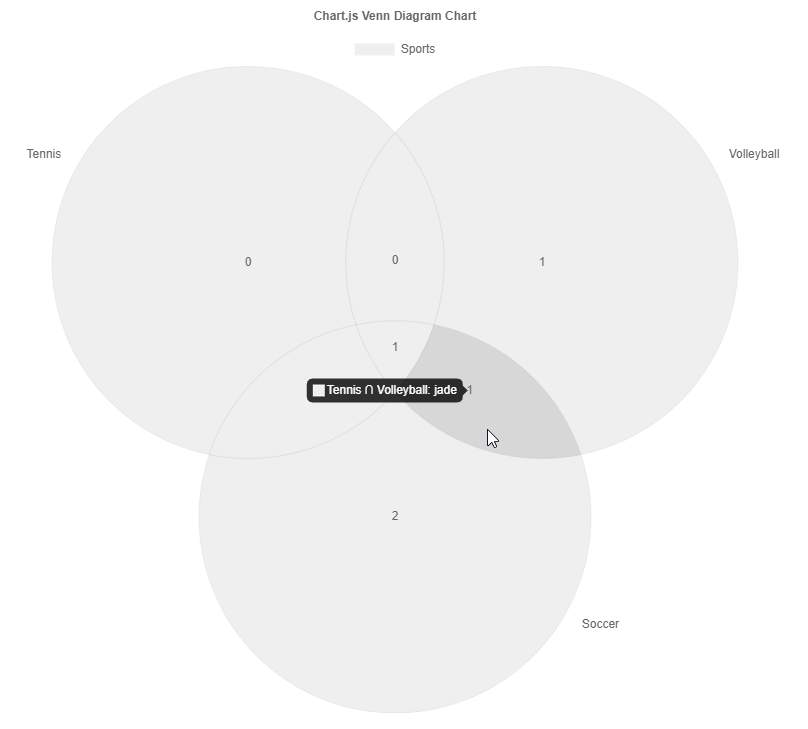
const config = {
  type: 'venn',
  data: ChartVenn.extractSets(
    [
      { label: 'Soccer', values: ['alex', 'casey', 'drew', 'hunter'] },
      { label: 'Tennis', values: ['casey', 'drew', 'jade'] },
      { label: 'Volleyball', values: ['drew', 'glen', 'jade'] },
    ],
    {
      label: 'Sports',
    }
  ),
  options: {},
};
Alternative data structure
const config = {
  type: 'venn',
  data: {
    labels: [
      'Soccer',
      'Tennis',
      'Volleyball',
      'Soccer ∩ Tennis',
      'Soccer ∩ Volleyball',
      'Tennis ∩ Volleyball',
      'Soccer ∩ Tennis ∩ Volleyball',
    ],
    datasets: [
      {
        label: 'Sports',
        data: [
          { sets: ['Soccer'], value: 2 },
          { sets: ['Tennis'], value: 0 },
          { sets: ['Volleyball'], value: 1 },
          { sets: ['Soccer', 'Tennis'], value: 1 },
          { sets: ['Soccer', 'Volleyball'], value: 0 },
          { sets: ['Tennis', 'Volleyball'], value: 1 },
          { sets: ['Soccer', 'Tennis', 'Volleyball'], value: 1 },
        ],
      },
    ],
  },
  options: {},
};ArcSlice elements have the basic backgroundColor, borderColor, and borderWidth properties similar to a regular rectangle.
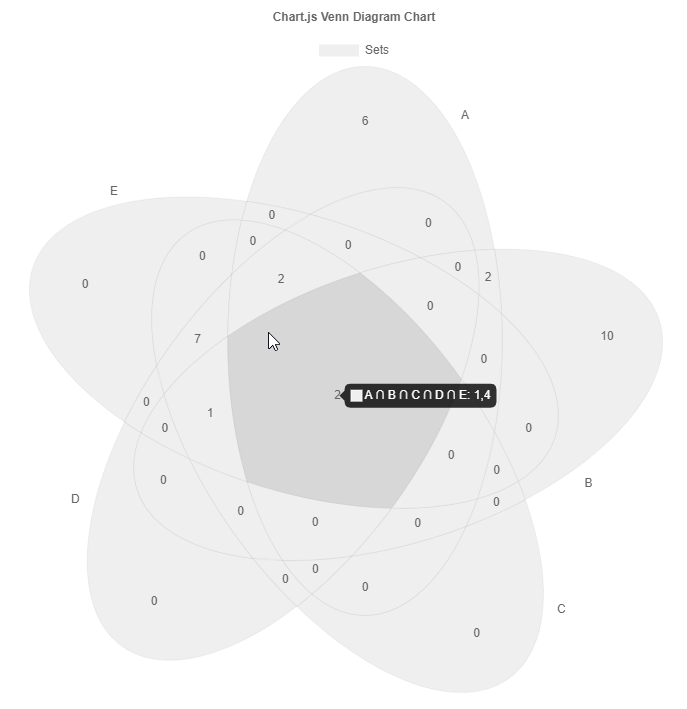
Euler diagrams are relaxed proportional venn diagrams such that the area of the circles and overlap try to fit the overlapping value. It is a relaxed in a way that is just approximates the proportions using a numerical optimization process. Moreover, only one and two set overlaps are used for the computation. The library uses venn.js in the background.
const config = {
  type: 'euler',
  data: ChartVenn.extractSets(
    [
      { label: 'A', values: [1, 2, 3, 4, 11, 12, 13, 14, 15, 16, 17, 18] },
      { label: 'B', values: [1, 2, 3, 4, 5, 6, 7, 8, 9, 10, 19, 20, 21, 22, 23] },
      { label: 'C', values: [1, 11, 12, 4, 5, 24, 25, 26, 27, 28, 29, 30] },
    ],
    {
      label: 'Sets',
    }
  ),
  options: {},
};see Venn Diagram
The ESM build of the library supports tree shaking thus having no side effects. As a consequence the chart.js library won't be automatically manipulated nor new controllers automatically registered. One has to manually import and register them.
Variant A:
import { Chart, LinearScale } from 'chart.js';
import { VennDiagramController, ArcSlice } from 'chartjs-chart-venn';

Chart.register(VennDiagramController, ArcSlice, LinearScale);
...

new Chart(ctx, {
  type: VennDiagramController.id,
  data: [...],
});
Variant B:
import { VennDiagramChart } from 'chartjs-chart-venn';

new VennDiagramChart(ctx, {
  data: [...],
});npm i -g yarn
yarn install
yarn sdks vscodeyarn compile
yarn test
yarn lint
yarn fix
yarn build
yarn docs