yml2dot - Turn YAML into beautiful Graph
- Visualize your YAML files as Graph
- Generate additional info from your source code (simply define a YAML block and use this tool)
How yml2dot works?
Takes in input:
- any YAML file
- any text file that has YAML between comments (like front matter)
Generates a dot script for Graphviz.
Visualize a Kubernetes Deployment YAML file
Given a sample deployment.yml file:
apiVersion: apps/v1
kind: Deployment
metadata:
  name: nginx-deployment
  labels:
    app: nginx
spec:
  replicas: 3
  selector:
    matchLabels:
      app: nginx
  template:
    metadata:
      labels:
        app: nginx
    spec:
      containers:
      - name: nginx
        image: nginx:1.14.2
        ports:
        - containerPort: 80
Run yml2dot like this:
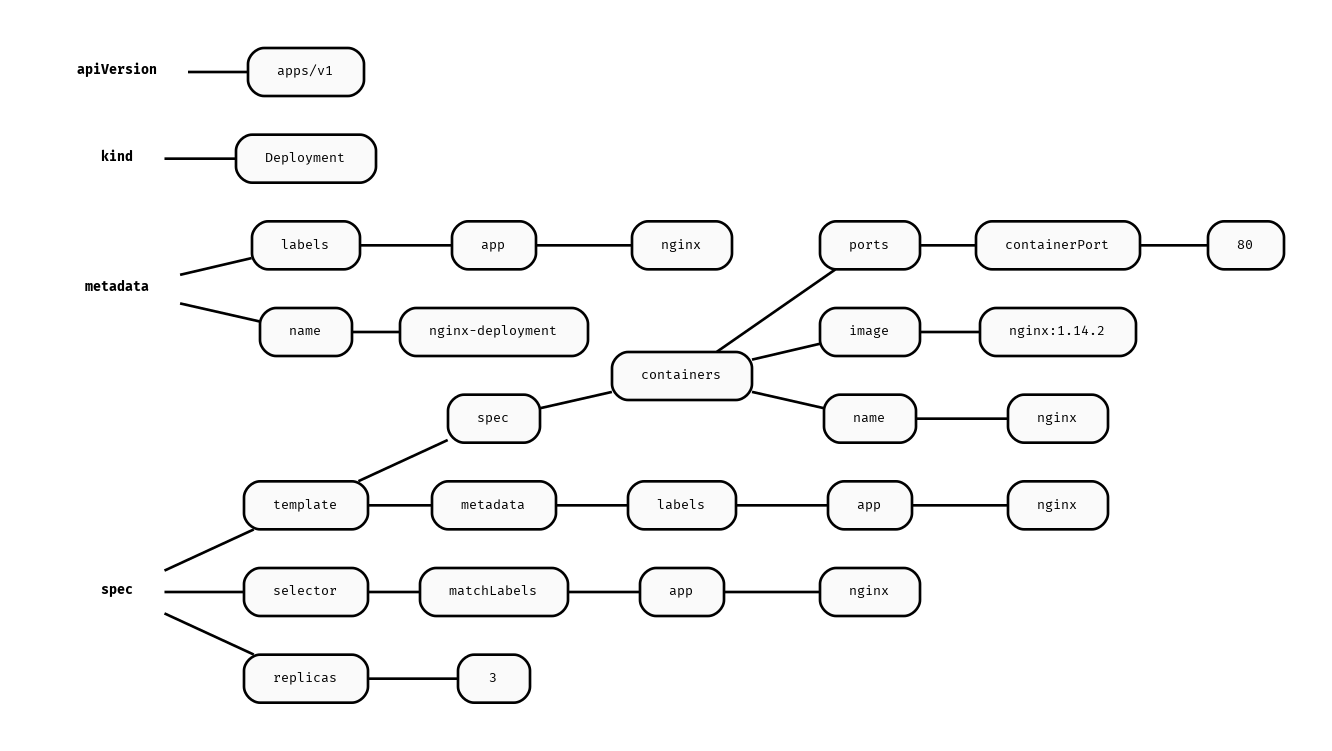
$ yml2dot deployment.yml | dot -Tpng > deployment.pngand create this graph:
/***
Box:
  Object:
    - set
    - get
***/

public class Box {
    private Object object;

    public void set(Object object) {
        this.object = object;
    }
    public Object get() {
        return object;
    }
}
Use the
-fromand-toflags to mark your YAML block.
Run yml2dot like this:
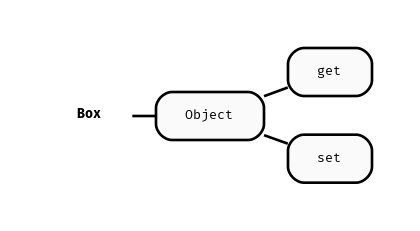
$ yml2dot -from '/***' -to '***/' Box.java | dot -Tpng > Box.java.pngand create this graph:
If you have golang installed:
$ go install github.com/lucasepe/yml2dot@latestThis will create the executable under your $GOPATH/bin directory.
If you don't want to compile the sourcecode yourself, Here you can find the tool already compiled for:
- MacOS
- Linux
- Windows

