Dockerised example of monitoring Apache Kafka with Prometheus and Grafana. This project makes use of the prometheus-jmx-exporter which is configured to extract metrics from Kafka's JMX server. These metrics are then exposed via HTTP GET and polled by Prometheus.
- kafka.yml - Kafka JMX polling configuration
- prometheus.yml - Prometheus metric polling configuration
- install Docker and Docker Compose - https://docs.docker.com/
- set KAFKA_ADVERTISED_HOST_NAME in
docker-compose.ymlto match your docker host IP. (Note: Do not use localhost or 127.0.0.1 as the host ip if you want to run multiple brokers). See wurstmeister's docker-kafka for more information on configuring Kafka - https://github.com/wurstmeister/kafka-docker
docker-compose up
- View Prometheus UI -
http://$DOCKER_HOST_IP:9090 - Grafana UI -
http://$DOCKER_HOST_IP:3000(admin:admin) - Kafka metrics -
http://$DOCKER_HOST_IP:8080/metrics
In order for the Kafka broker to expose JMX topic metrics you must send some messages to the topics.
cat kafka-messages | docker run -i -a stdin wurstmeister/kafka /opt/kafka_2.11-0.10.0.1/bin/kafka-console-producer.sh --broker-list $DOCKER_HOST_IP:9092 --topic customer
cat kafka-messages | docker run -i -a stdin wurstmeister/kafka /opt/kafka_2.11-0.10.0.1/bin/kafka-console-producer.sh --broker-list $DOCKER_HOST_IP:9092 --topic audit
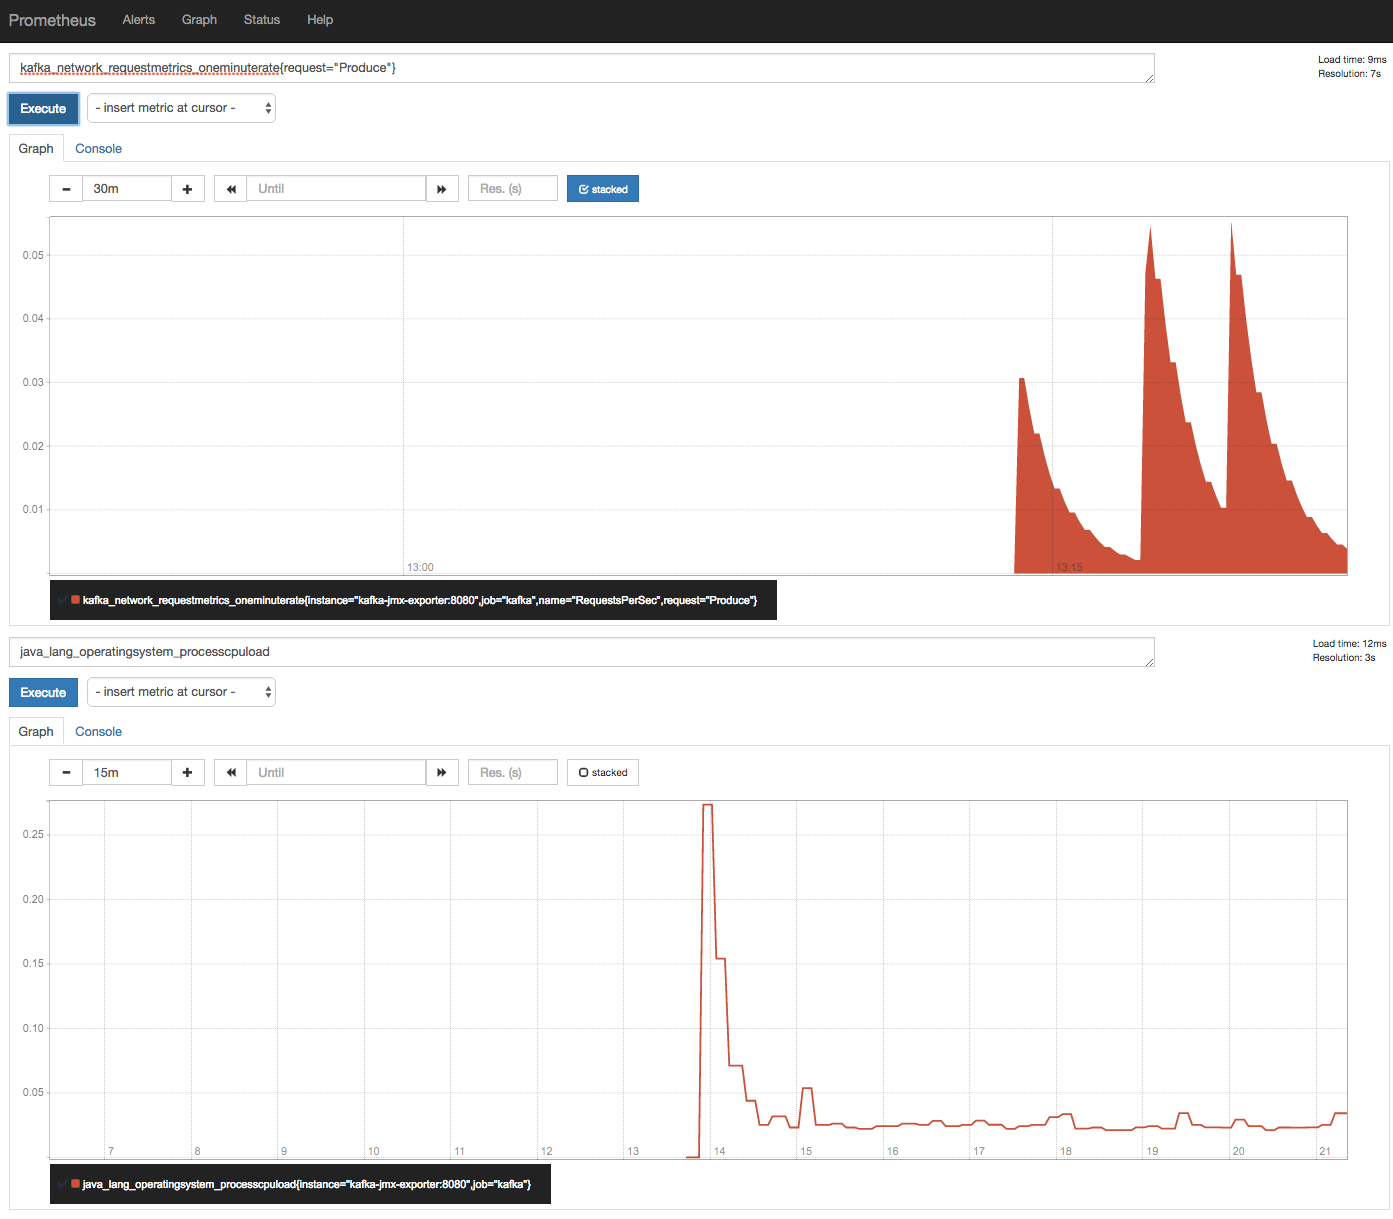
The kafka metrics are pulled into Prometheus via the JMX exporter. These can be viewed in Prometheus by navigating to http://$DOCKER_HOST_IP:9090/graph, enter a metric name to view the graphs.
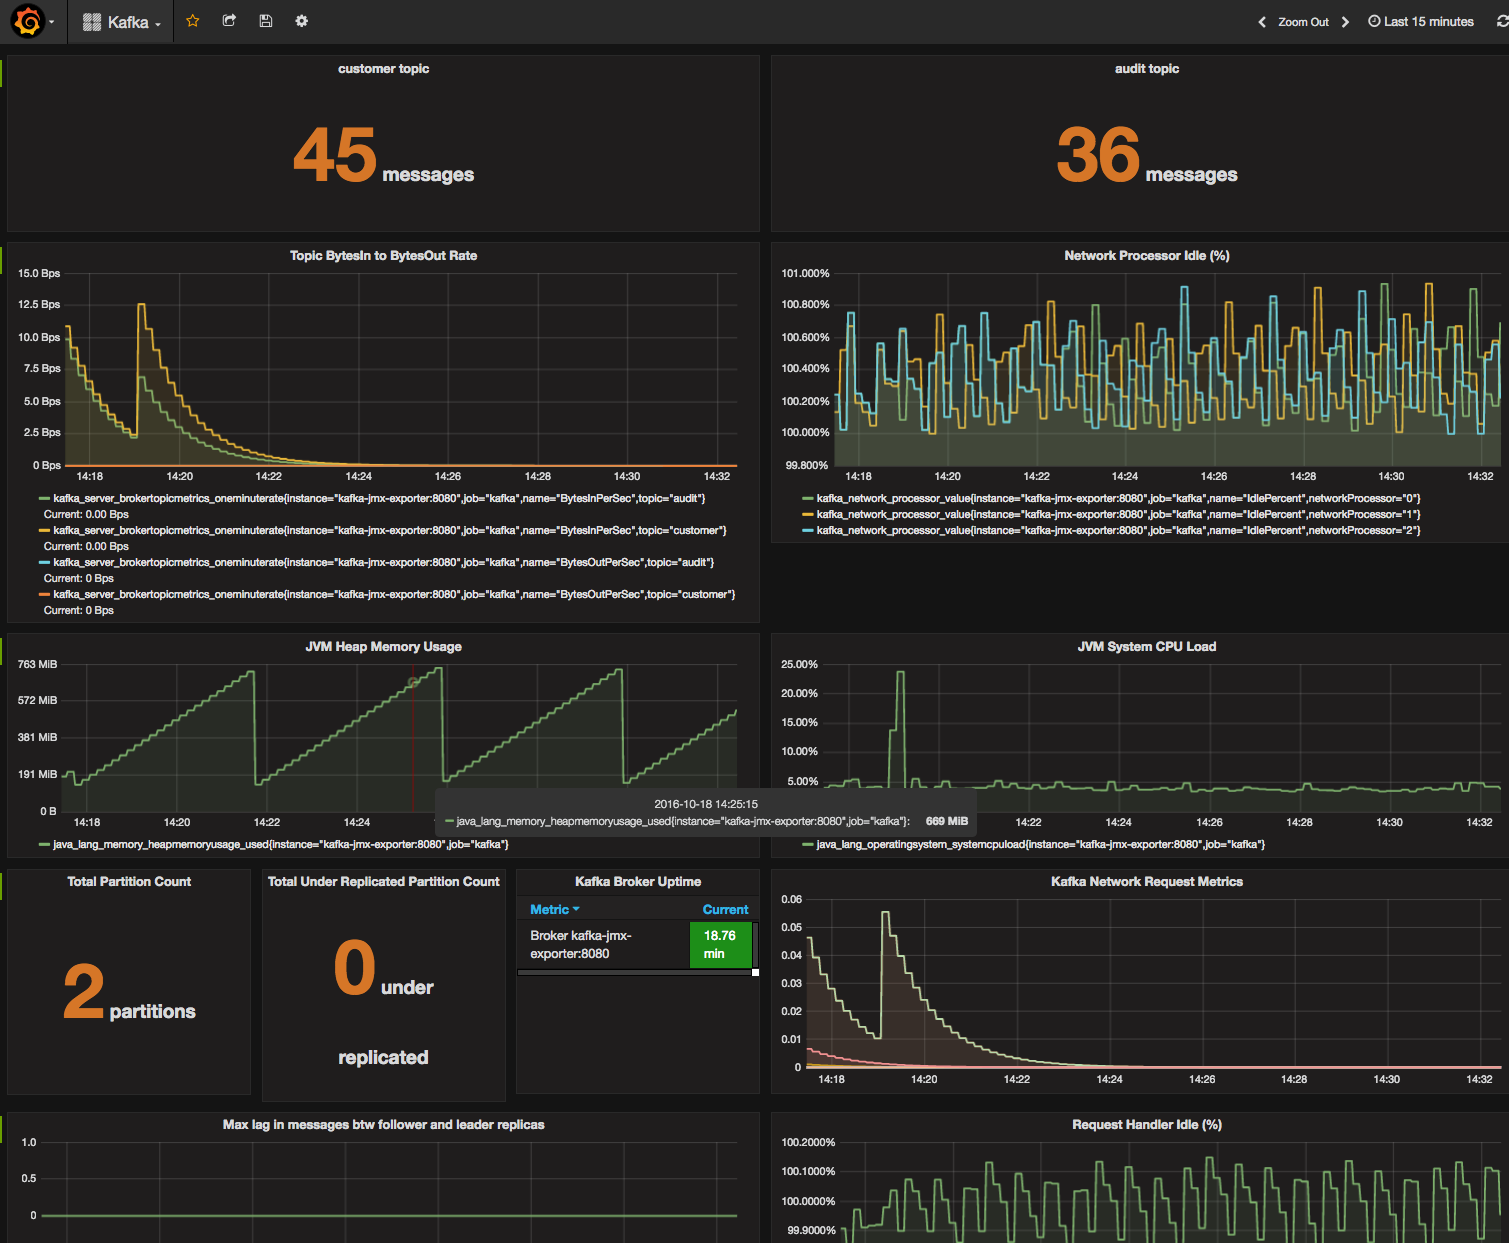
Grafana can be used to build a more meaningful dashboard of the metrics in Prometheus, navigate to Grafana on http://$DOCKER_HOST_IP:3000 (admin:admin). An example dashboard is available to import in dashboards/Kafka.json.

