Recursion and graphics tend to make a nice pairing for exploration.
For recursion, it makes the algorithm visible.
For graphics, it lets you generate complex shapes from a tiny foundation.
Invoke with four arguments like so:
java-introcs ColorAveragingStack 0.30 0.83 0.46 0.06
Args are the four starting corner colors. Range is the interval (0,1).
0 is red, 0.1 orangeish, 0.2 yellowish, 0.3 greenish, 0.6 mid blueish, 0.7 purple, 0.9 pinkish, 1.0 red again. All you need to start the program is pick these four initial corner colors.
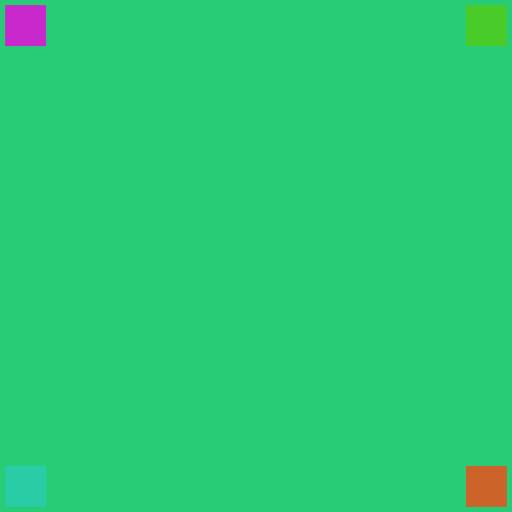
The first image generated by ColorAveragingStack given the above params is just this green square:
The above square's color is just average of the four colors chosen.
But it's a bit hard to understand average of four colours in our head, so...
This image prints your four corner colors, too (this is a hack to demonstrate how the algorithm works, it doesn't need to print those colors).
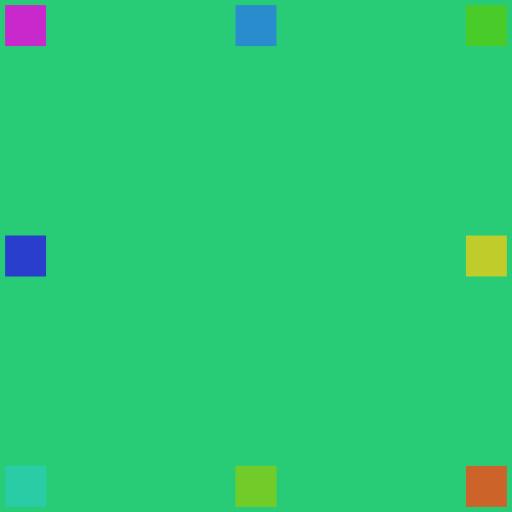
Next, we compute midpoint colors for each side. While the final result we're aiming for doesn't actually use these, I print these to assist understanding.
You can probably get some idea that the midpoint colors are in fact the averages of the corner colors, at least in a few cases, like royal blue being the color in between sky blue and purple, on the left side.
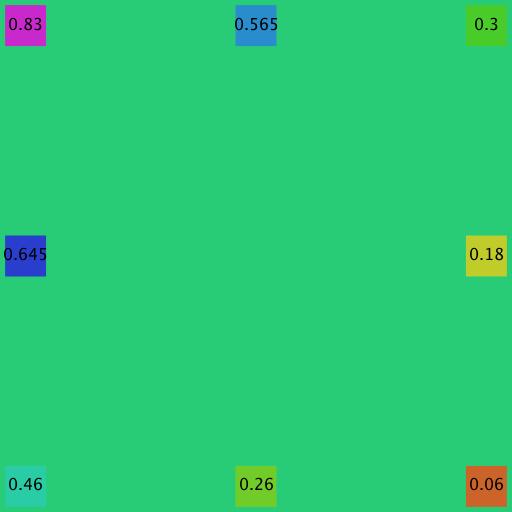
But it's still a bit hard verifying the computation. So, the next image prints the color numbers on top. Now we can verify that a simple numerical average is taking place, and the colors seen simply reflect that.
At this point, we are fully set up to start the recursion.
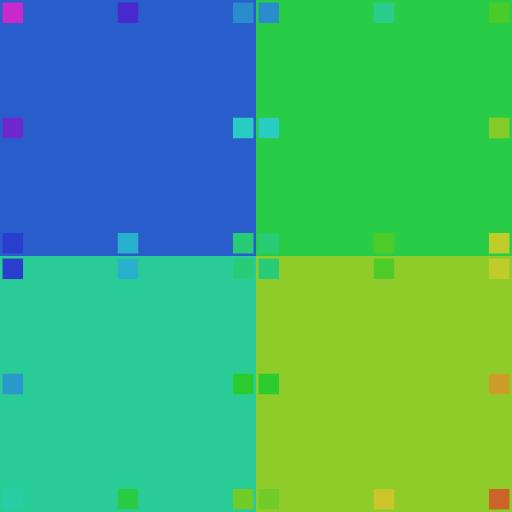
We may now consider the four quadrants/quarters of the large square above as simply smaller versions of itself (all the quarters of the large square now have corner colors of their own, because we added the midpoint colors).
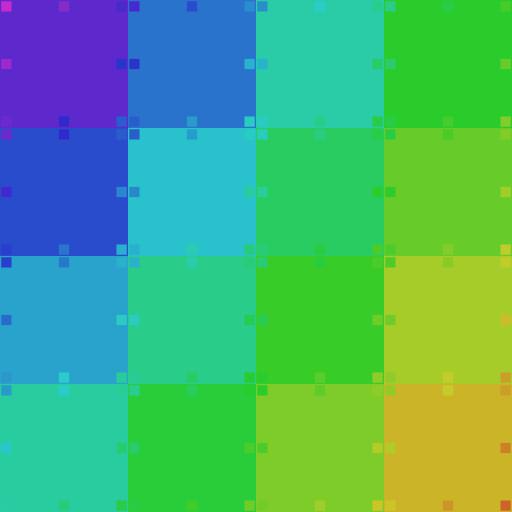
Consider the bottom left quadrant/quarter of the large square above. Its top left corner is the royal blue, its bottom left is the sky blue, its top right is the same as the background color of the main square (we didn't plot that one as a small square, it would be the same color as its background, so invisible), its bottom right is the yellow-green. Those are the input to another level of exactly the same computation. Observe that in the image below we now a) draw each quadrant using a background color of its newly computed centroid color (average of its four corner colors), then b) compute all the new midpoint colors, simply from corner colors, exactly as we did before.
We do this for all four subquadrants:
And let's go one more level down:
And again:
At this point the corner squares are getting hard to see, plus we don't really need them anymore, so lets drop them:
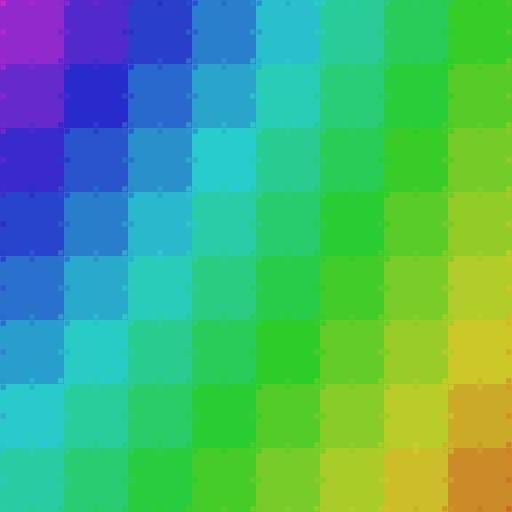
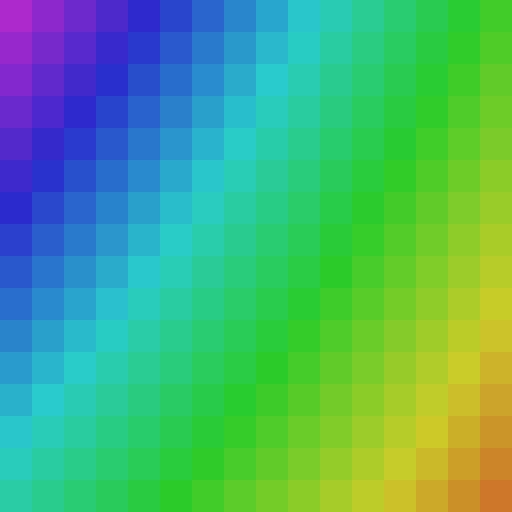
And another level down:
And again:
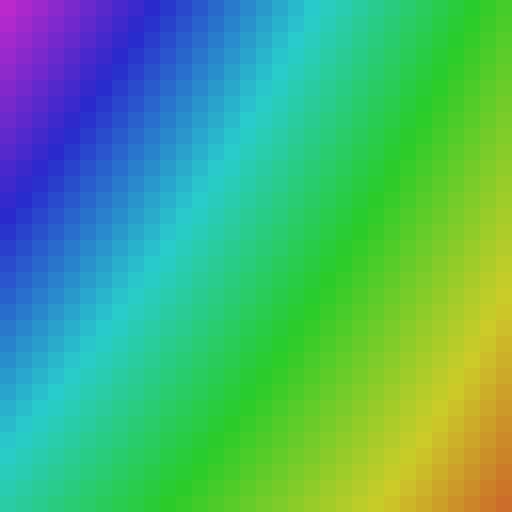
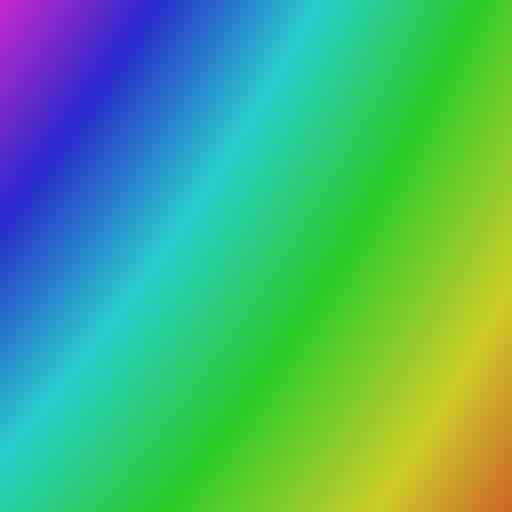
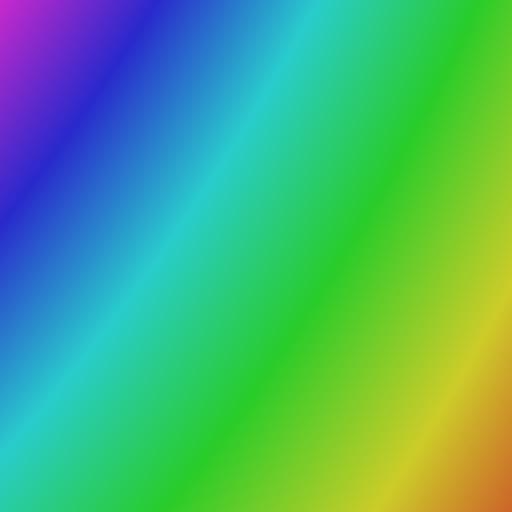
Finally we hit the pixel level so there's no point going further:
Note that color space is more complex than we have assumed here. Here we represent colors in just 1D, as an interval (0,1), which is crude.
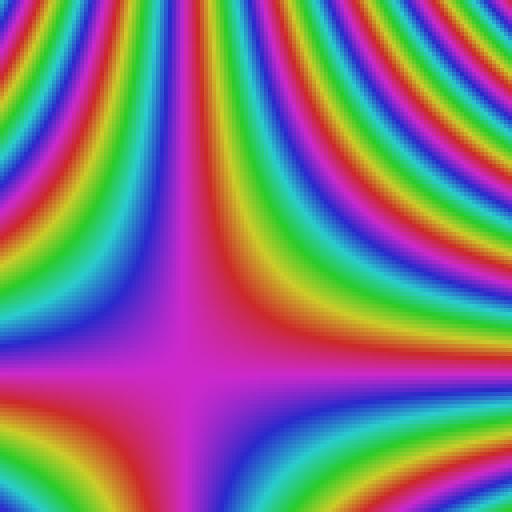
One other discovery; since the java color class used here allows overflow, you can pass color values bigger than 1. If we do that, the averaging effect tend to cycle the full space, creating wave like artifacts.
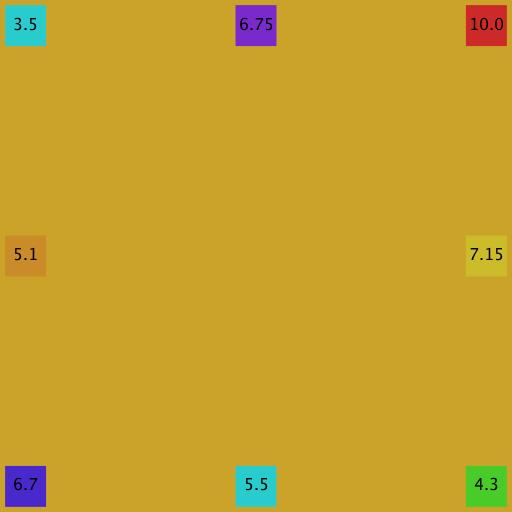
E.g., using these illegal color values causing overflow: ji ColorAveragingStack 10.0 3.5 6.7 4.3
We get:
and its final image is:
All that from four numbers and some recursive averaging...
The verdict? ...Not bad but it ain't no Monet!
