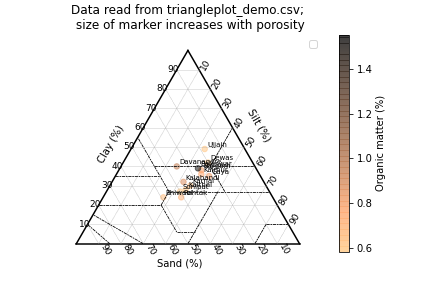
Soil Ternary Plots for soil texture representation - Python3
Updating the source code TernaryPlotPy for Python version 3
Examples in SoilTriangle.ipynb
To generate plots and classify soil user should prepare csv file, example triangleplot_demo.csv:
| sand | silt | clay | porosity | om | site | |
|---|---|---|---|---|---|---|
| 0 | 20 | 20 | 60 | 34 | 74 | 'ERTQ' |
| 1 | 20 | 50 | 30 | 20 | 2 | 'ASE1' |
| 2 | 0 | 50 | 50 | 54 | 6 | 'PEAT' |
| 3 | 70 | 10 | 20 | 45 | 3 | 'PRPA' |
stp = SoilTrianglePlot('The soil texture classes') # Argument is the plot title
stp.soil_categories() #Draws the boundaries of sandy loam, etc.
stp.scatter(data, s=weights, c=colors, label='_', cmap = cm.autumn, alpha=0.60, marker='d') #scatter doesn't work well with legend, so label="_" (hides it); cmap chooses the color scheme; alpha allows some transparency to see overlapping data
stp.colorbar('porosity')
stp.line((75,25,0),(0, 67, 33), 'g', label='model 1', linewidth=3)
stp.line((12,80,8), (0,12,88), 'b', label='model 2', linewidth=3)
stp.show('triangleplot_gaudy') # is also saved to file of <argument> name
