fifofum: A lightweight graphics library for displaying 2-d output from running Fortran programs using FIFO pipes
Typically, the output from a computer program like a weather or climate model is saved to files and visualized after the program completes a stage of execution. When developing and debugging such a computer program, it would be useful to have a "real time" display of the graphical output to track the evolution of numerical instabilities etc. An interactive graphics display would also be useful for pedagogical purposes.
One could, for example, make calls to a graphics library from the running program and use X windows to display images. Unfortunately the few Fortran-callable graphics libraries tend to be complex. These libraries often introduce many additional dependencies, making the program less portable and difficult to install. Also, interactive graphical displays typically require "event loops" which can unnecessarily complicate program logic.
fifofum is a very simple graphics library that displays a
2-dimensional data matrix as a pixel image, optionally overlaid on another
background image. It transmits output using Unix named pipes (which
are also known as FIFOs, because data is transmitted in a
First In, First Out fashion). Linking to the fifofum library enables running programs to continuously
write text and image data to named pipes, which appear like files.
A different program reads from these named files and continuously displays the output, as needed.
If no program is reading from the named pipe, the output is simply
discarded. This means that you can take a peek at the output as and
when needed.
The basic FIFO pipe code is written in C (fifo_c.c), and a Fortran wrapper (fifo_f.f90) is provided.
The package also includes a Python web server (fifofum.py) that reads data streams from multiple named pipes
and displays the images and text in a browser window. The display is continually updated as new data arrives.
Other custom software can also be used to read and process the data
from the named pipes. Alternatively, the data could be saved to a
file that is continually overwritten for each new image (see test/test_file.F90).
fifofum can also be used in conjunction with any other graphics library that
generates binary images (in PNG or other formats). The binary images
captured from the other libarary can be dumped to a named pipe stream
and then displayed in the browser (see test/test_other.F90).
Sample Fortran code snippet (see test/test_animate.F90)
    real :: data_values(width, height)
    pipe_num = allocate_file_pipe("testout.fifo")
    do
	    ! ... compute data values
        status = fifo_plot2d(pipe_num, data_values, label="Data")
	end do
    call free_pipe(pipe_num)
Compile, link, and run using gcc/gfortran
gcc -c fifo_c.c
gfortran -c -fdefault-real-8 fifo_f.f90
gfortran -o test_animate -fdefault-real-8 test_animate.F90 fifo_f.o fifo_c.o -lpng
./test_animate &
Run web server to display output and capture input.
python fifofum.py --input=testin.fifo testout.fifoOpen link http://localhost:8008 using a web browser to view the animated image and send text input.
If you are running the data-generating program and the web server on a remote computer via ssh, use the following
command to forward port 8008 for local browser access:
ssh -L 8008:localhost:8008 user@remote.computerTry the command make test_with_background for a fancier animation.
For more information, see:
-
Simple test program test/test_animate.F90
-
Test with atmospheric model doc/FMS-test.md
-
Comments at the top of src/fifo_f.f90 and src/fifofum.py
-
Function
fifo_plot2din src/fifo_f.f90 -
python fifofum.py --help -
test/Makefile
Notes:
-
For Intel compilers, use
icc/ifortand the-r8option instead of-fdefault-real-8. -
On OS X, you may need to add options like
-I/opt/X11/include/libpng15 -L/opt/X11/libwhen compilingfifo_c.c(after installing X11)
The dependencies are minimal:
-
Python Tornado module. Needed if the web server is to be used. This is usually included in scientific python distributions. If necessary, use the
pip install tornadocommand to install it. -
libpnglibrary to create PNG output data. This is usually installed on Unix systems. It is not strictly required, but strongly recommended for image data compression. Iflibpngis not available, use the-DFIFO_NO_PNGcompile option to display uncompressed raw images.
fifofum simply transforms each data value in a matrix to a single color pixel
to create the image.
Opacity and transparency for "undefined" values is supported. This allows the data image to be overlaid on a background image that contains coordinate or geographical information.
By default, line-oriented I/O is used for writing to and reading from named pipes.
Images are written to the named pipe using the Data URL format (data:image/png;base64,...),
terminated by a new line.
Multiple pipes can be used to display multiple animations simultaneously.
An optional input pipe, allowing the model to read user input from the browser, is also supported.
See the comments at the beginning of src/fifofum.py and also the test program test/test_animate.F90 for more info.
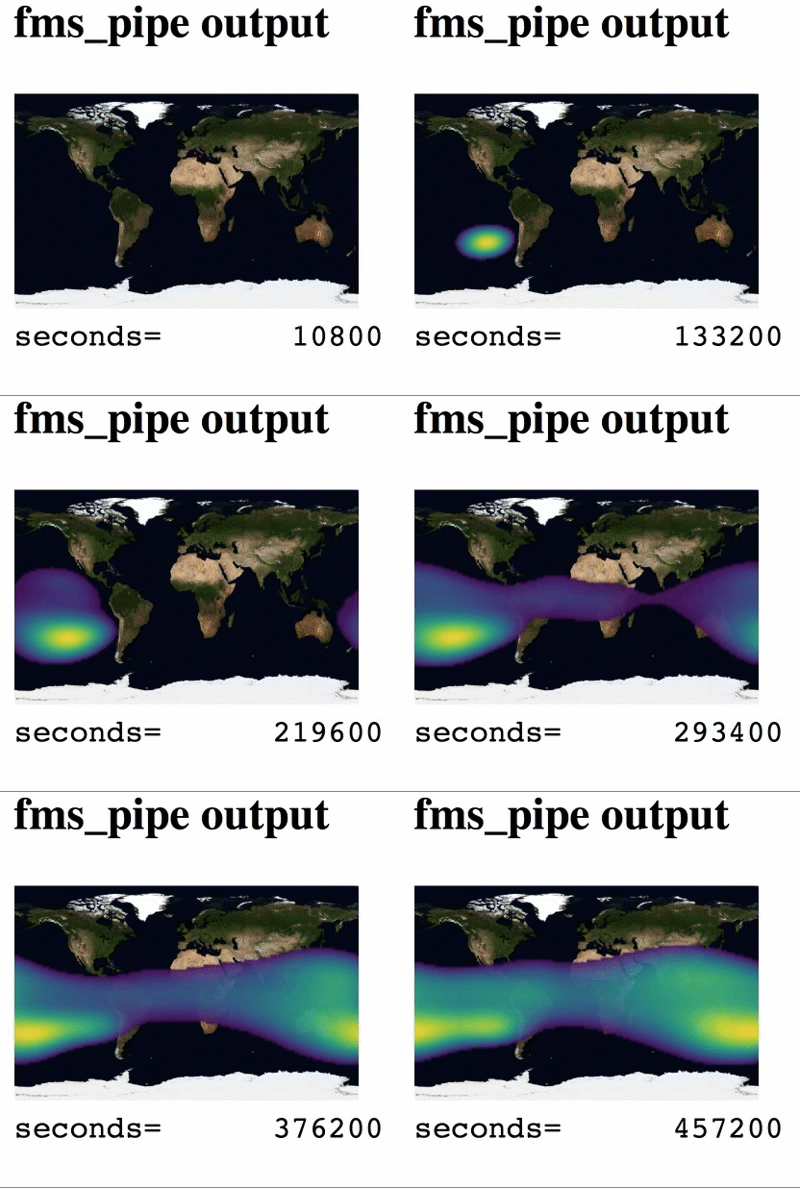
The following image shows animation of surface pressure during a test run of the shallow water atmospheric dynamical core from the Flexible Modeling System developed by the NOAA Geophysical Fluid Dynamical Laboratory. The model output is overlaid on a NASA Blue Marble background image. (For more details of this test run, see doc/FMS-test.md.)
