The developer at Mystique Unicorn are interested in building their application using event-driven architectural pattern to process streaming data. For those who are unfamiliar, An event-driven architecture uses events to trigger and communicate between decoupled services and is common in modern applications built with microservices. An event is a change in state, or an update, like an item being placed in a shopping cart on an e-commerce website.
In this application, Kubernetes has been chosen as the platform to host their application producing and consuming events. Their developers need access to logs for debugging and gain observability of how these producers and consumers applications are performing
Can you help them?
Logging is a powerful debugging mechanism for developers and operations teams when they must troubleshoot issues. The best practice for your containerized applications is to write your application logs to the standard output (stdout) and standard error (stderr) streams.
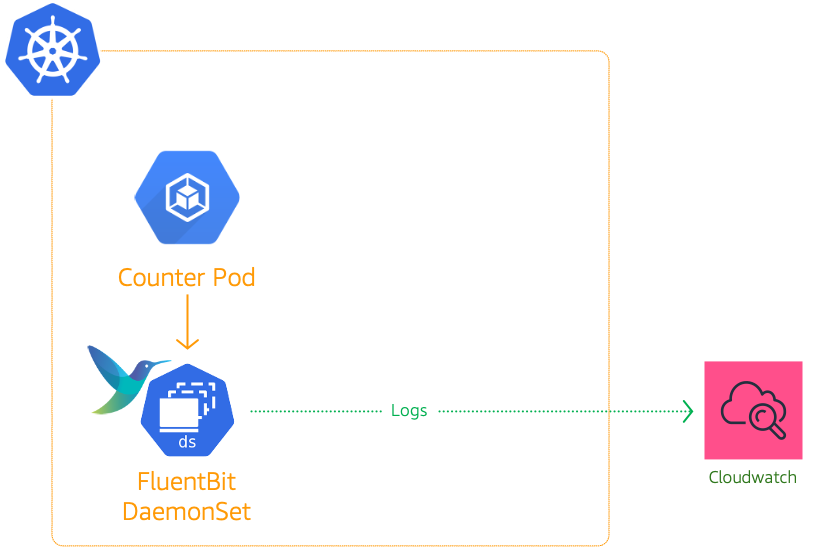
Log aggregation in Kubernetes is different than logging on traditional servers or virtual machines, mainly due to how Kubernetes manages its applications (pods). In Kubernetes, when pods are evicted, crashed, deleted, or scheduled on a different node, the logs are lost and are not available to troubleshoot issues unless they are stored on persistent storage or routed successfully to another centralized logging destination. The transient nature of default logging in Kubernetes makes it crucial to implement a centralized log management solution. Fluent Bit1 is a lightweight and extensible Log Processor that comes with full support for Kubernetes.
How does FluentBit work?
Kubernetes manages a cluster of nodes, so our log agent tool will need to run on every node to collect logs from every POD, hence Fluent Bit is deployed as a DaemonSet. To get started with FluentBit1,2, we need to setup few resources on our cluster,
- Namespace:
amazon-cloudwatch - Service Account:
fluent-bit - IAM Role: Permissions to create logs groups and streams. The service account
fluent-bitwill be annotated with this Role enabling it to push logs to cloudwatch. - ClusterRole & ClusterRoleBining Allows the daemon set to access the container logs.
- ConfigMap:
fluent-bit-cluster-info- We will use the configmap to let fluentbit know about the AWS Region, cluster name and any other custom information that we want to pass onto FluentBit.
In this blog, I will show you how to setup logging in EKS using FluentBit.
-
This demo, instructions, scripts and cloudformation template is designed to be run in
us-east-1. With few modifications you can try it out in other regions as well(Not covered here).- 🛠 AWS CLI Installed & Configured - Get help here
- 🛠 AWS CDK Installed & Configured - Get help here
- 🛠 Python Packages, Change the below commands to suit your OS, the following is written for amzn linux 2
- Python3 -
yum install -y python3 - Python Pip -
yum install -y python-pip - Virtualenv -
pip3 install virtualenv
- Python3 -
-
-
Get the application code
git clone https://github.com/miztiik/eks-log-shipping-with-fluentbit
cd eks-log-shipping-with-fluentbit
-
-
We will use
cdkto make our deployments easier. Lets go ahead and install the necessary components.# You should have npm pre-installed # If you DONT have cdk installed npm install -g aws-cdk # Make sure you in root directory python3 -m venv .venv source .venv/bin/activate pip3 install -r requirements.txt
The very first time you deploy an AWS CDK app into an environment (account/region), you’ll need to install a
bootstrap stack, Otherwise just go ahead and deploy usingcdk deploy.cdk bootstrap cdk ls # Follow on screen promptsYou should see an output of the available stacks,
eks-cluster-vpc-stack-01
eks-cluster-stack-01
ssm-agent-installer-daemonset-stack-01
eks-log-shipping-stack-01
-
Let us walk through each of the stacks,
-
Stack: eks-cluster-vpc-stack-01 To host our EKS cluster we need a custom VPC. This stack will build a multi-az VPC with the following attributes,
- VPC:
- 2-AZ Subnets with Public, Private and Isolated Subnets.
- 1 NAT GW for internet access from private subnets
Initiate the deployment with the following command,
cdk deploy eks-cluster-vpc-stack-01
After successfully deploying the stack, Check the
Outputssection of the stack for the - VPC:
-
Stack: eks-cluster-stack-01 As we are starting out a new cluster, we will use most default. No logging is configured or any add-ons. The cluster will have the following attributes,
- The control pane is launched with public access. i.e the cluster can be access without a bastion host
c_adminIAM role added to aws-auth configMap to administer the cluster from CLI.- One OnDemand managed EC2 node group created from a launch template
- It create two
t3.mediuminstances runningAmazon Linux 2. - Auto-scaling Group with
2desired instances. - The nodes will have a node role attached to them with
AmazonSSMManagedInstanceCorepermissions - Kubernetes label
app:miztiik_on_demand_ng
- It create two
The EKS cluster will be created in the custom VPC created earlier. Initiate the deployment with the following command,
cdk deploy eks-cluster-stack-01
After successfully deploying the stack, Check the
Outputssection of the stack. You will find the**ConfigCommand**that allows yous to interact with your cluster usingkubectl -
Stack: ssm-agent-installer-daemonset-stack-01 This EKS AMI used in this stack does not include the AWS SSM Agent out of the box. If we ever want to patch or run something remotely on our EKS nodes, this agent is really helpful to automate those tasks. We will deploy a daemonset that will run exactly once? on each node using a cron entry injection that deletes itself after successful execution. If you are interested take a look at the daemonset manifest here
stacks/back_end/eks_cluster_stacks/eks_ssm_daemonset_stack/eks_ssm_daemonset_stack.py. This is inspired by this AWS guidance.Initiate the deployment with the following command,
cdk deploy ssm-agent-installer-daemonset-stack-01
After successfully deploying the stack, You can connect to the worker nodes instance using SSM Session Manager.
-
Stack: eks-log-shipping-stack-01
This stack will create the following resources,
-
IAM Role: For FluentBit to push logs - The permissions are as given below
{ "Version": "2012-10-17", "Statement": [ { "Effect": "Allow", "Action": [ "logs:CreateLogStream", "logs:CreateLogGroup", "logs:DescribeLogStreams", "logs:PutLogEvents" ], "Resource": "*" } ] } -
Service Account:
fluent-bit. This service account will be annotated with the IAM Role arn created in the previous step. An example annotation looks like this,arn:aws:iam::111122223333:role/eks-log-shipping-stack-01-fluentbitlogshippersvcac -
Namespace:
amazon-cloudwatch -
ConfigMap:
fluent-bit-cluster-info- We will use the configmap to let fluentbit know about the AWS Region, cluster name and any other custom information that we want to pass onto FluentBit.
Initiate the deployment with the following command,
cdk deploy eks-log-shipping-stack-01
After successfully deploying the stack, You can find the IAM role arn
ExternalDnsProviderRole. -
-
-
-
Deploy FluentBit DaemonSet
We have already created the namespace, service account and ConfigMap for FluentBit Daemonset to use. Let us go ahead and deploy the manifest that will deploy the Daemonset. A sample of the manifest is provided under here
stacks/k8s_utils/manifests/eks_fluentbit_config.yml.Deploy the manifest,
kubectl apply -f eks_fluentbit_config.yml
Confirm the fluentbit pod have been deployed:
kubectl get pods -n amazon-cloudwatch
Expected output,
NAME               READY   STATUS    RESTARTS   AGE
fluent-bit-9v82p   1/1     Running   1          28h
fluent-bit-mb5kq   1/1     Running   1          28h
-
Deploy Pod to generate logs
A sample of the very simple
counterpod that periodically logs to the console is shown below.apiVersion: v1 kind: Pod metadata: name: counter namespace: default labels: name: counter owner: miztiik_automation compute_provider: ec2 dept: engineering team: red-shirts spec: containers: - name: count image: busybox args: [/bin/sh, -c,'i=0; while true; do echo "$i: miztiik-engineering $(date)"; i=$((i+1)); sleep 30; done']kubectl apply -f fluentd_counter.yml
Confirm the counter pod is running,
manifests]# kubectl get po -l name=counter
NAME      READY   STATUS    RESTARTS   AGE
counter   1/1     Running   1          29h
In addition to automatically generated logs, let us manually ingest couple of lines to the logs and then check in cloudwatch logs. We need to ingest logs to process pid of
1as that is what is monitored by kubernetes.manifests]# kubectl exec -ti counter -- sh / # echo "Manually ingested Log" >> /proc/1/fd/1 / #
Confirm the pod is logging,
kubectl logs counter
You should see something like this,
manifests]# kubectl logs counter
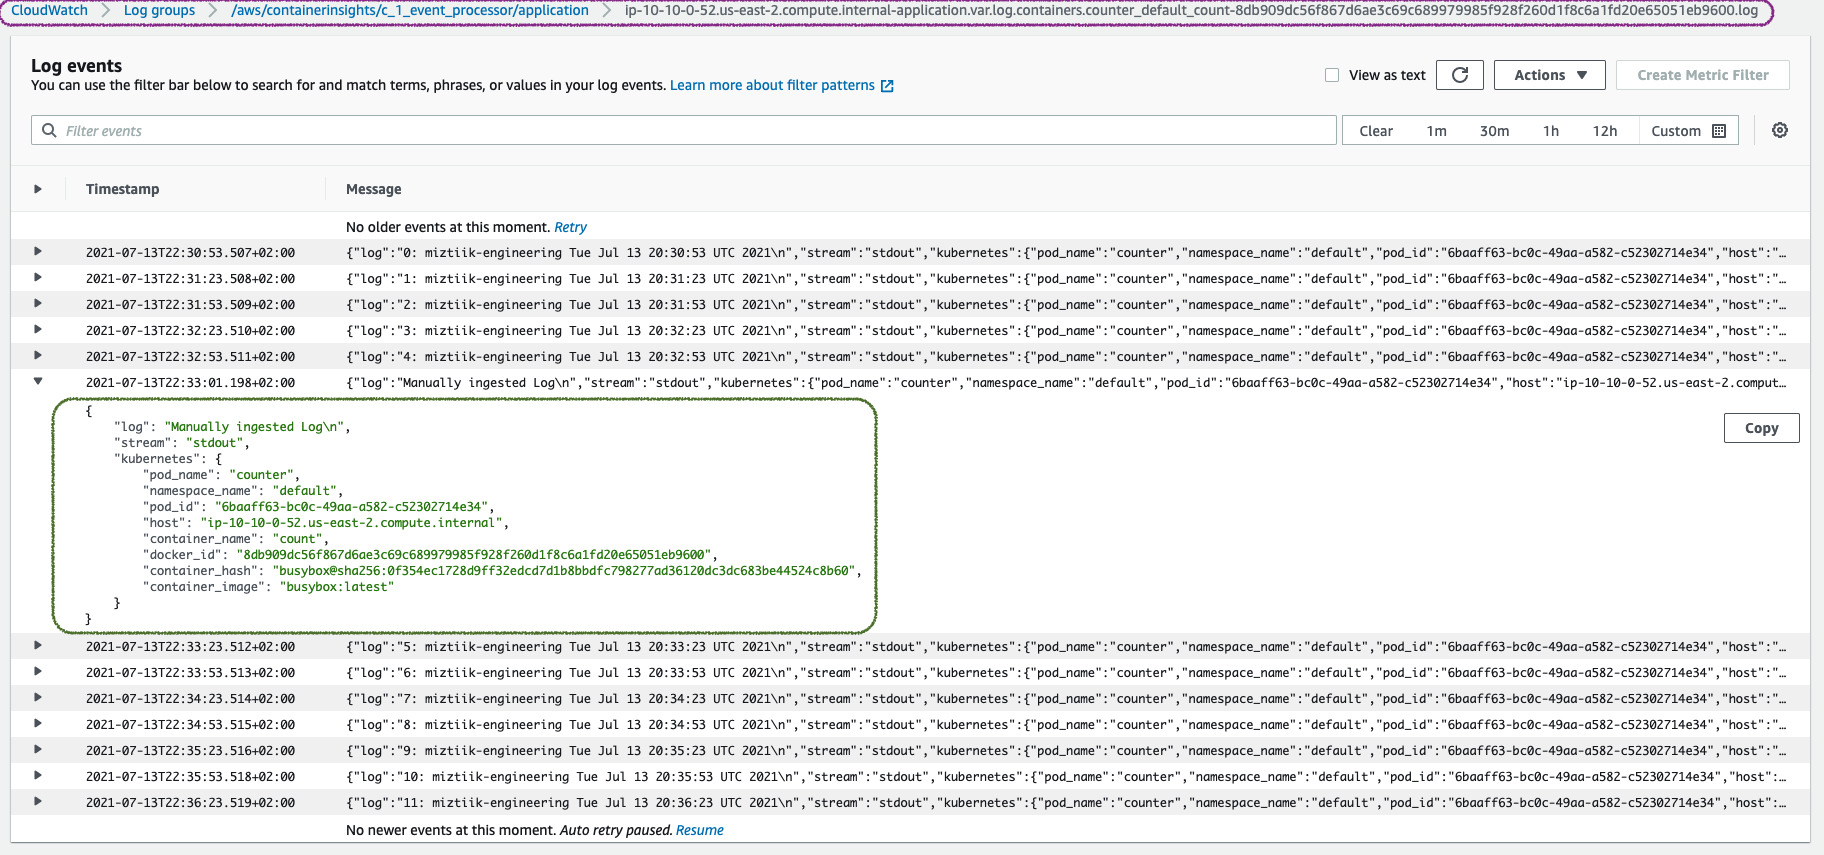
0: miztiik-engineering Tue Jul 13 20:30:53 UTC 2021
1: miztiik-engineering Tue Jul 13 20:31:23 UTC 2021
2: miztiik-engineering Tue Jul 13 20:31:53 UTC 2021
3: miztiik-engineering Tue Jul 13 20:32:23 UTC 2021
4: miztiik-engineering Tue Jul 13 20:32:53 UTC 2021
Manually ingested Log
5: miztiik-engineering Tue Jul 13 20:33:23 UTC 2021
6: miztiik-engineering Tue Jul 13 20:33:53 UTC 2021
7: miztiik-engineering Tue Jul 13 20:34:23 UTC 2021
Now lets go to cloudwatch console and check if these logs are showing up there,

-
-
Here we have demonstrated how to use Fluent Bit for logging containers in kubernetes. You can use this feature for Fargate as well or create dashboards with Grafana or Kibana.
-
If you want to destroy all the resources created by the stack, Execute the below command to delete the stack, or you can delete the stack from console as well
- Resources created during Deploying The Application
- Delete CloudWatch Lambda LogGroups
- Any other custom resources, you have created for this demo
# Delete from cdk
cdk destroy

# Follow any on-screen prompts

# Delete the CF Stack, If you used cloudformation to deploy the stack.
aws cloudformation delete-stack \
  --stack-name "MiztiikAutomationStack" \
  --region "${AWS_REGION}"
This is not an exhaustive list, please carry out other necessary steps as maybe applicable to your needs.
This repository aims to show how to do container logging to new developers, Solution Architects & Ops Engineers in AWS. Based on that knowledge these Udemy course #1, course #2 helps you build complete architecture in AWS.
Thank you for your interest in contributing to our project. Whether it is a bug report, new feature, correction, or additional documentation or solutions, we greatly value feedback and contributions from our community. Start here

Level: 200

