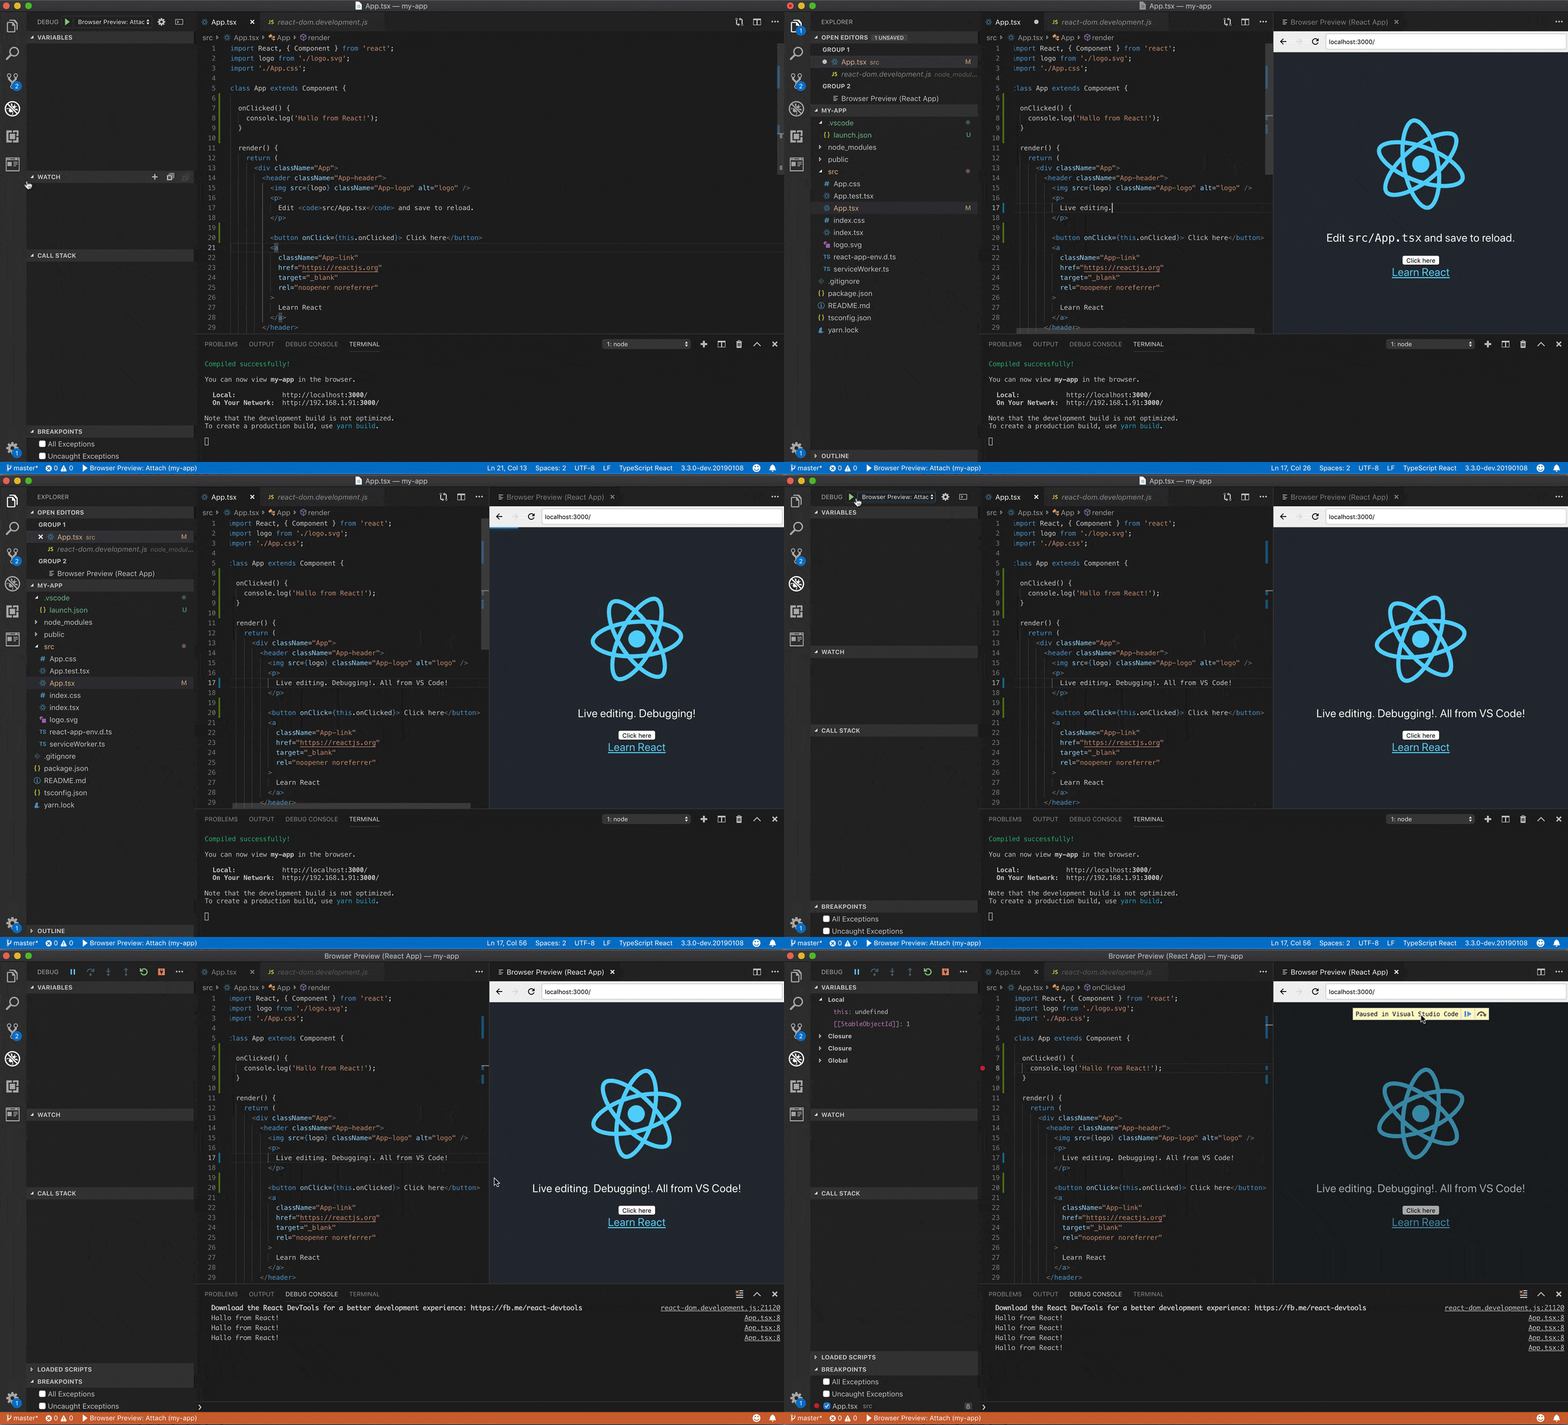
Browser Preview for VS Code enables you to open a real browser preview inside your editor that you can debug. Browser Preview is powered by Chrome Headless, and works by starting a headless Chrome instance in a new process. This enables a secure way to render web content inside VS Code, and enables interesting features such as in-editor debugging and more!
- Grab extension from marketplace
- Click the new "Browser Preview" button in the Side Bar to the left or run the command
Browser View: Open Preview
Make sure you have Google Chrome installed on your computer.
- Browser preview inside VS Code (Powered by Chrome Headless).
- Ability to have multiple previews open at the same time.
- Debuggable. Launch urls and attach Debugger for Chrome to the browser view instance, and debug within VS Code.
- Attach Chrome DevTools via
chrome://inspect - Option to set the default startUrl via
browser-preview.startUrl
You can enable in-editor debugging of Browser Previews by installing Debugger for Chrome, and configure VS Code's debugger to either attach or launch to the browser previews by using the following configuration:
{
  "version": "0.1.0",
  "configurations": [
    {
      "type": "browser-preview",
      "request": "attach",
      "name": "Browser Preview: Attach"
    },
    {
      "type": "browser-preview",
      "request": "launch",
      "name": "Browser Preview: Launch",
      "url": "http://localhost:3000"
    }
  ]
}
The debug configuration also supports these additional properties: webRoot, pathMapping, trace, sourceMapPathOverrides and urlFilter. See https://github.com/Microsoft/vscode-chrome-debug#other-optional-launch-config-fields for details on how to use.
Browser Preview has the following settings:
"browser-preview.startUrl": // The default start url for new Browser Preview instances