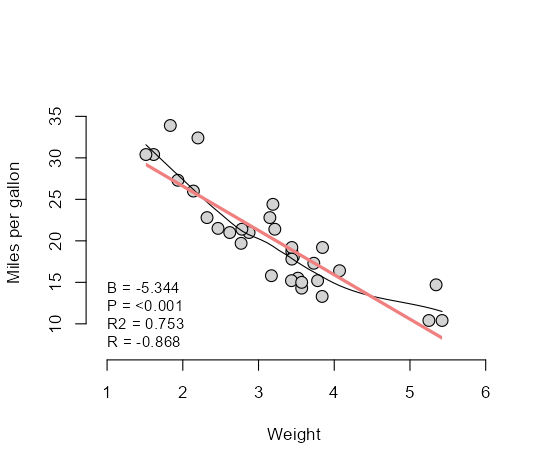
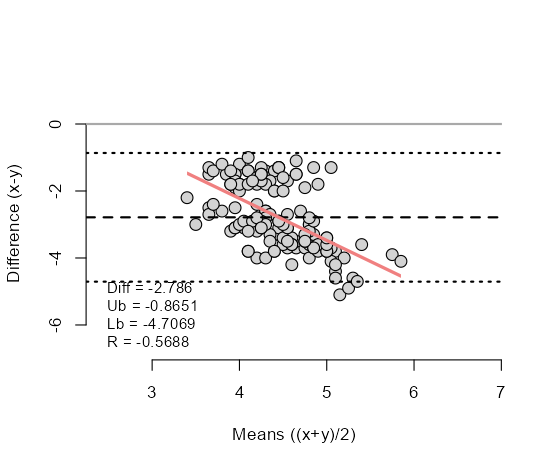
These R functions ("Splot.R", "Bplot.R", "BAplot.R") are for drawing plots with accompanying stats, this is particularly useful in the exploratory phase of data analysis.
First, install required packages:
# required for "Splot()" only.
install.packages("jtools")
Then, to load the plot functions directly from this Gihub page use:
devtools::source_url("https://raw.githubusercontent.com/mkarmstrong/quick_R_plots/main/Splot.R")  # scatter plot
devtools::source_url("https://raw.githubusercontent.com/mkarmstrong/quick_R_plots/main/Bplot.R")  # box plot
devtools::source_url("https://raw.githubusercontent.com/mkarmstrong/quick_R_plots/main/BAplot.R") # bland-altman plot
These functions return plots and some data to the console. To use the plot functions, see basic examples below:
# Scatter plot
Splot(mtcars$wt, mtcars$mpg,
      ylb = "Miles per gallon",
      xlb = "Weight")
# Boxplot
Bplot(as.factor(mtcars$cyl), mtcars$disp,
ylb = "Displacment",
xlb = "Cylinders")# Bland-Altman plot
BAplot(iris$Sepal.Length, iris$Sepal.Width)

