Opioid prescribing patterns among United States medical providers, 2003-17: retrospective, observational study
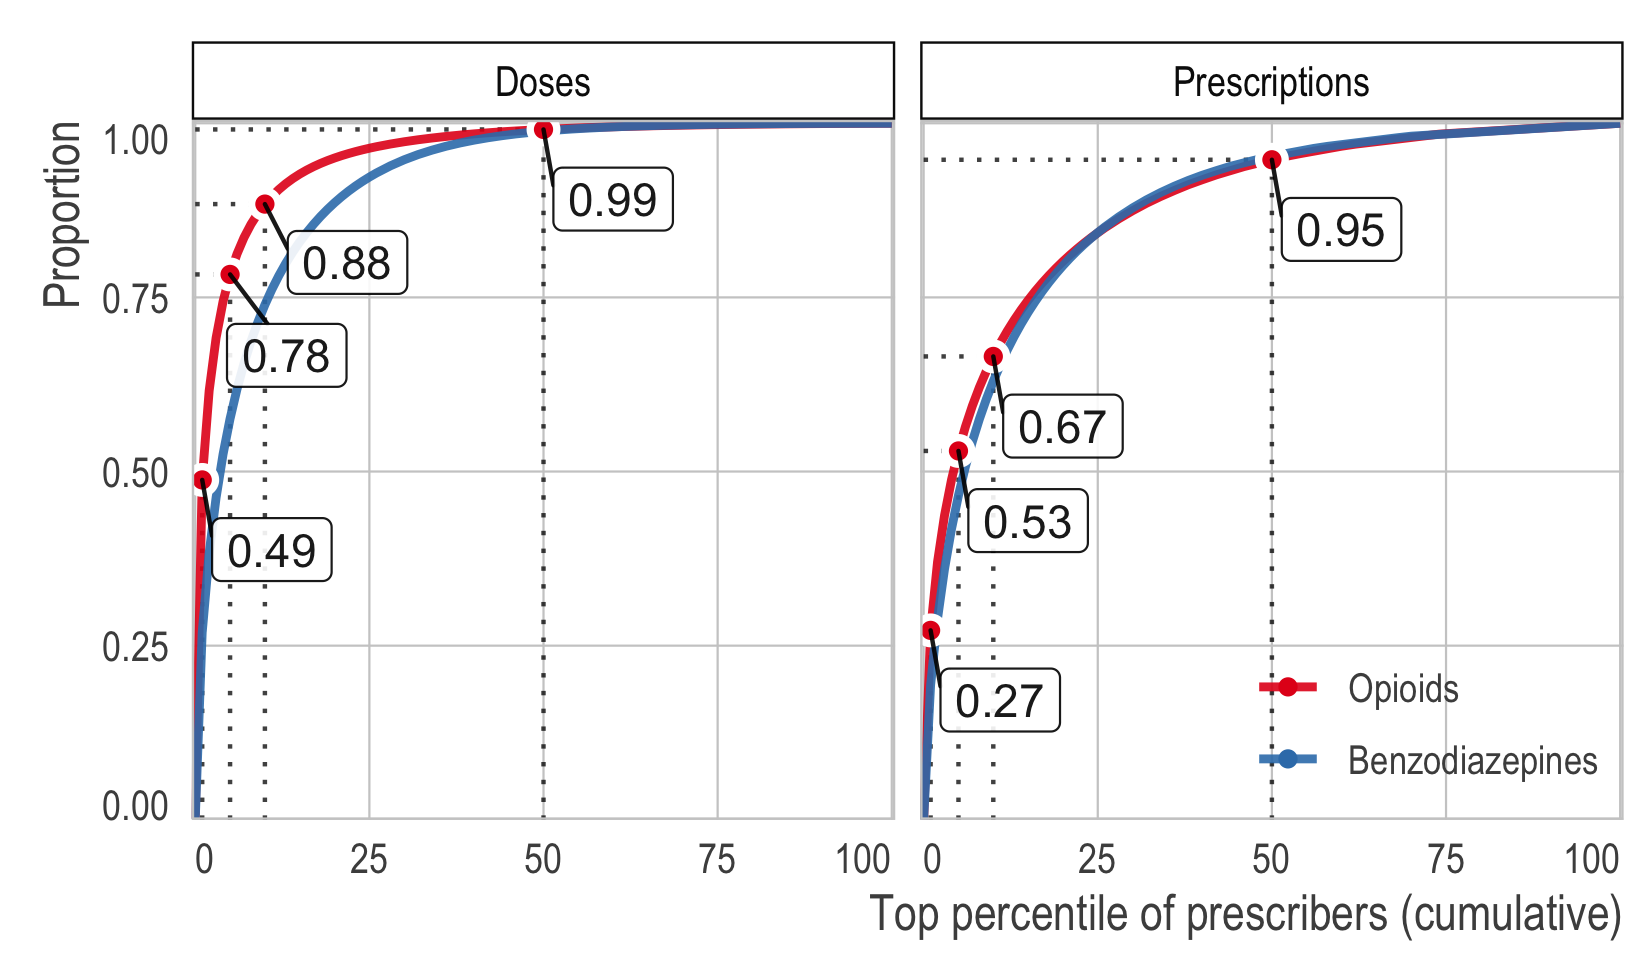
Reproducible code for our paper, Opioid prescribing patterns among medical providers in the United States, 2003-17: retrospective, observational study, which uses prescription and medical claims from Optum — a large, national database of mostly private insurance claims — to characterize trends in opioid prescribing compared to several other drugs. The full citation is:
Kiang MV, Humphreys K, Cullen MR, and Basu S. Opioid prescribing patterns among medical providers in the United States, 2003-17: retrospective, observational study. BMJ 2020;368:l6968. doi: 10.1136/bmj.l6968
We have created several interactive results viewers to assist interested readers in exploring the results and data.
Please report issues via email or the issues page.
Update about data (01/09/19): Due to restrictions on our data use
agreement, we are not able to publicly share aggregated data and summary
results. However, we have provided mechanisms for interested readers to
get both (1) the replication data necessary to reproduce all tables and
plots as well as run the Shiny applications locally; and (2) access to
the raw data to reproduce the entire pipeline. The replication data
(with aggregated data and summary results) are available without charge.
The raw data are available for a fee. Both require approval from an
Optum representative. These data are available through the Stanford
Center for Population Health Sciences Data
Core. Please submit a request to
phsdatacoreatstanforddotedu.
This code is provided so that researchers who have established a data use agreement with Optum are be able to reproduce or extend our analyses. Our code is intended to be run on a Google Cloud Compute instance — modification will be necessary for other computing environments.
- See
./rmds/misc_optum_files_used.htmlfor a list of files used in our analyses as well as the MD5 hash to verify versions. - See
./rmds/misc_setting_up_GCP_instance.htmlfor an example of how to set up a Google Cloud Compute instance. - Lastly, details about exact package versions are available in
./rmds/session_information.html.
Once you have received the replication data (via the mechanisms outlined
above), unzip the data to the project root (./data/). If you need to
run the Shiny applications, you should also run the
./code/99_copy_files_to_shiny_app.R file.
./apps/contains the code needed to run the interactive applications locally. See the./apps/README.mdfile for details../code/contains all code needed to reproduce our analyses. This code is designed to be run in order. Each file is a discrete step in the analytic pipeline and contains a brief description of the file objective at the top. I describe the overarching objective of some of the files below../data/contains all aggregated and/or suppressed data that results from our./code/pipeline../data_private/is not on the public repo and is ignored via.gitignore. It contains the full-sized Optum data that cannot be shared. In addition, it contains other files that cannot be shared due to our data use agreement – for example, member or provider files and lookup tables../data_private_mini/is not on the public repo and is ignored via.gitignore. Because the full diagnostic and prescription files are large and cumbersome, we subset them into just the rows we need (i.e., prescriptions for our defined drugs), saving the files here. These are still individual- and prescription-level data that cannot be shared../data_raw/contains publicly-available data that will be used in the analytic pipeline. See the./data_raw/README.mdfor details../grobs/contains the graphical objects generated by the plotting code. Each object will contain the data and information necessary to regenerate the plots without re-running the code or downloading the data../plots/contains the manuscript-ready plots in bothpdfandpngformats../result_objects/contains the intermediate files generated by our analytic pipeline. This folder is not in the public repo and is ignored via.gitignorebecause it may contain personally identifiable information. Some code files take days to run; therefore, we save all intermediate files, which allows our code to be stopped and resumed without repeating analyses. When a task is completed, the intermediate files are collected and saved into./data/or./data_private/../rmds/contains all the RMarkdown files used to generate our tables.
Each code file is a discrete step in our analytic pipeline, and is designed to be run in order (i.e., some code files depends on files generated in previous code files). Below, I describe the overarching objective of the files. Within each code file, there is a short description of the objective of that file.
00_download_public_data.R: Downloads and copies the public use data file. You only need to run this once.00_install_necessary_packages.R: Our compute environment is based on a docker image, which is wiped clean with every restart. This helper script simply (re-)installs the necessary packages to run the code.01to03: Download the full prescription data and tabulate the number of unique prescriptions, providers, and patients.04to08: Subset the full prescription data based on drug type and then tabulate the number of unique prescriptions, providers, and patients for each drug type.09: Import, clean, and munge the provider specialty data.10: Summarize the doses of each drug type by state and provider category. This includes descriptives such as the mean, median, standard deviation, and various quantiles.11: Describe the inequality of the prescribing patterns nased on global inequality metrics (e.g., Gini coefficient) and the Lorenz curve.12to19: Describe the prescribing patterns by centile including the top centile of patients, providers, and patient-provider pairs.20to21: Rank the specific opioids and benzodiazepines that were prescribed in our data.22to24: Download and subset the full diagnostic history files. Then tabulate the proportion of top centile patients who have history of cancer diagnosis as well as recent primary diagnoses.25to28and99: Additional files that are not strictly necessary for the main manuscript.fig*: These files generate the figures used in the manuscript and supplemental materials.
- Mathew Kiang
(
: mkiang |
: @mathewkiang)
- Keith Humphreys
(
: @KeithNHumphreys)
- Mark Cullen
(
: @MarkCullen_PHS)
- Sanjay
Basu
(
: sanjaybasu)


