Racial/ethnic disparities in opioid-related mortality in the US, 1999-2019: The extreme case of Washington DC
This is reproducible code for our forthcoming paper “Racial/ethnic disparities in opioid-related mortality in the US, 1999-2019: The extreme case of Washington DC”, which uses restricted-access multiple cause of death data to systematically examine racial/ethnic disparities in the trajectory of opioid-related deaths by geography. The full citation is:
Kiang MV, Tsai AC, Alexander MJ, Rehkopf DH, Basu S. Racial/Ethnic Disparities in Opioid-Related Mortality in the USA, 1999–2019: the Extreme Case of Washington DC. J Urban Heal. Published online 2021:1-7. doi: 10.1007/s11524-021-00573-8
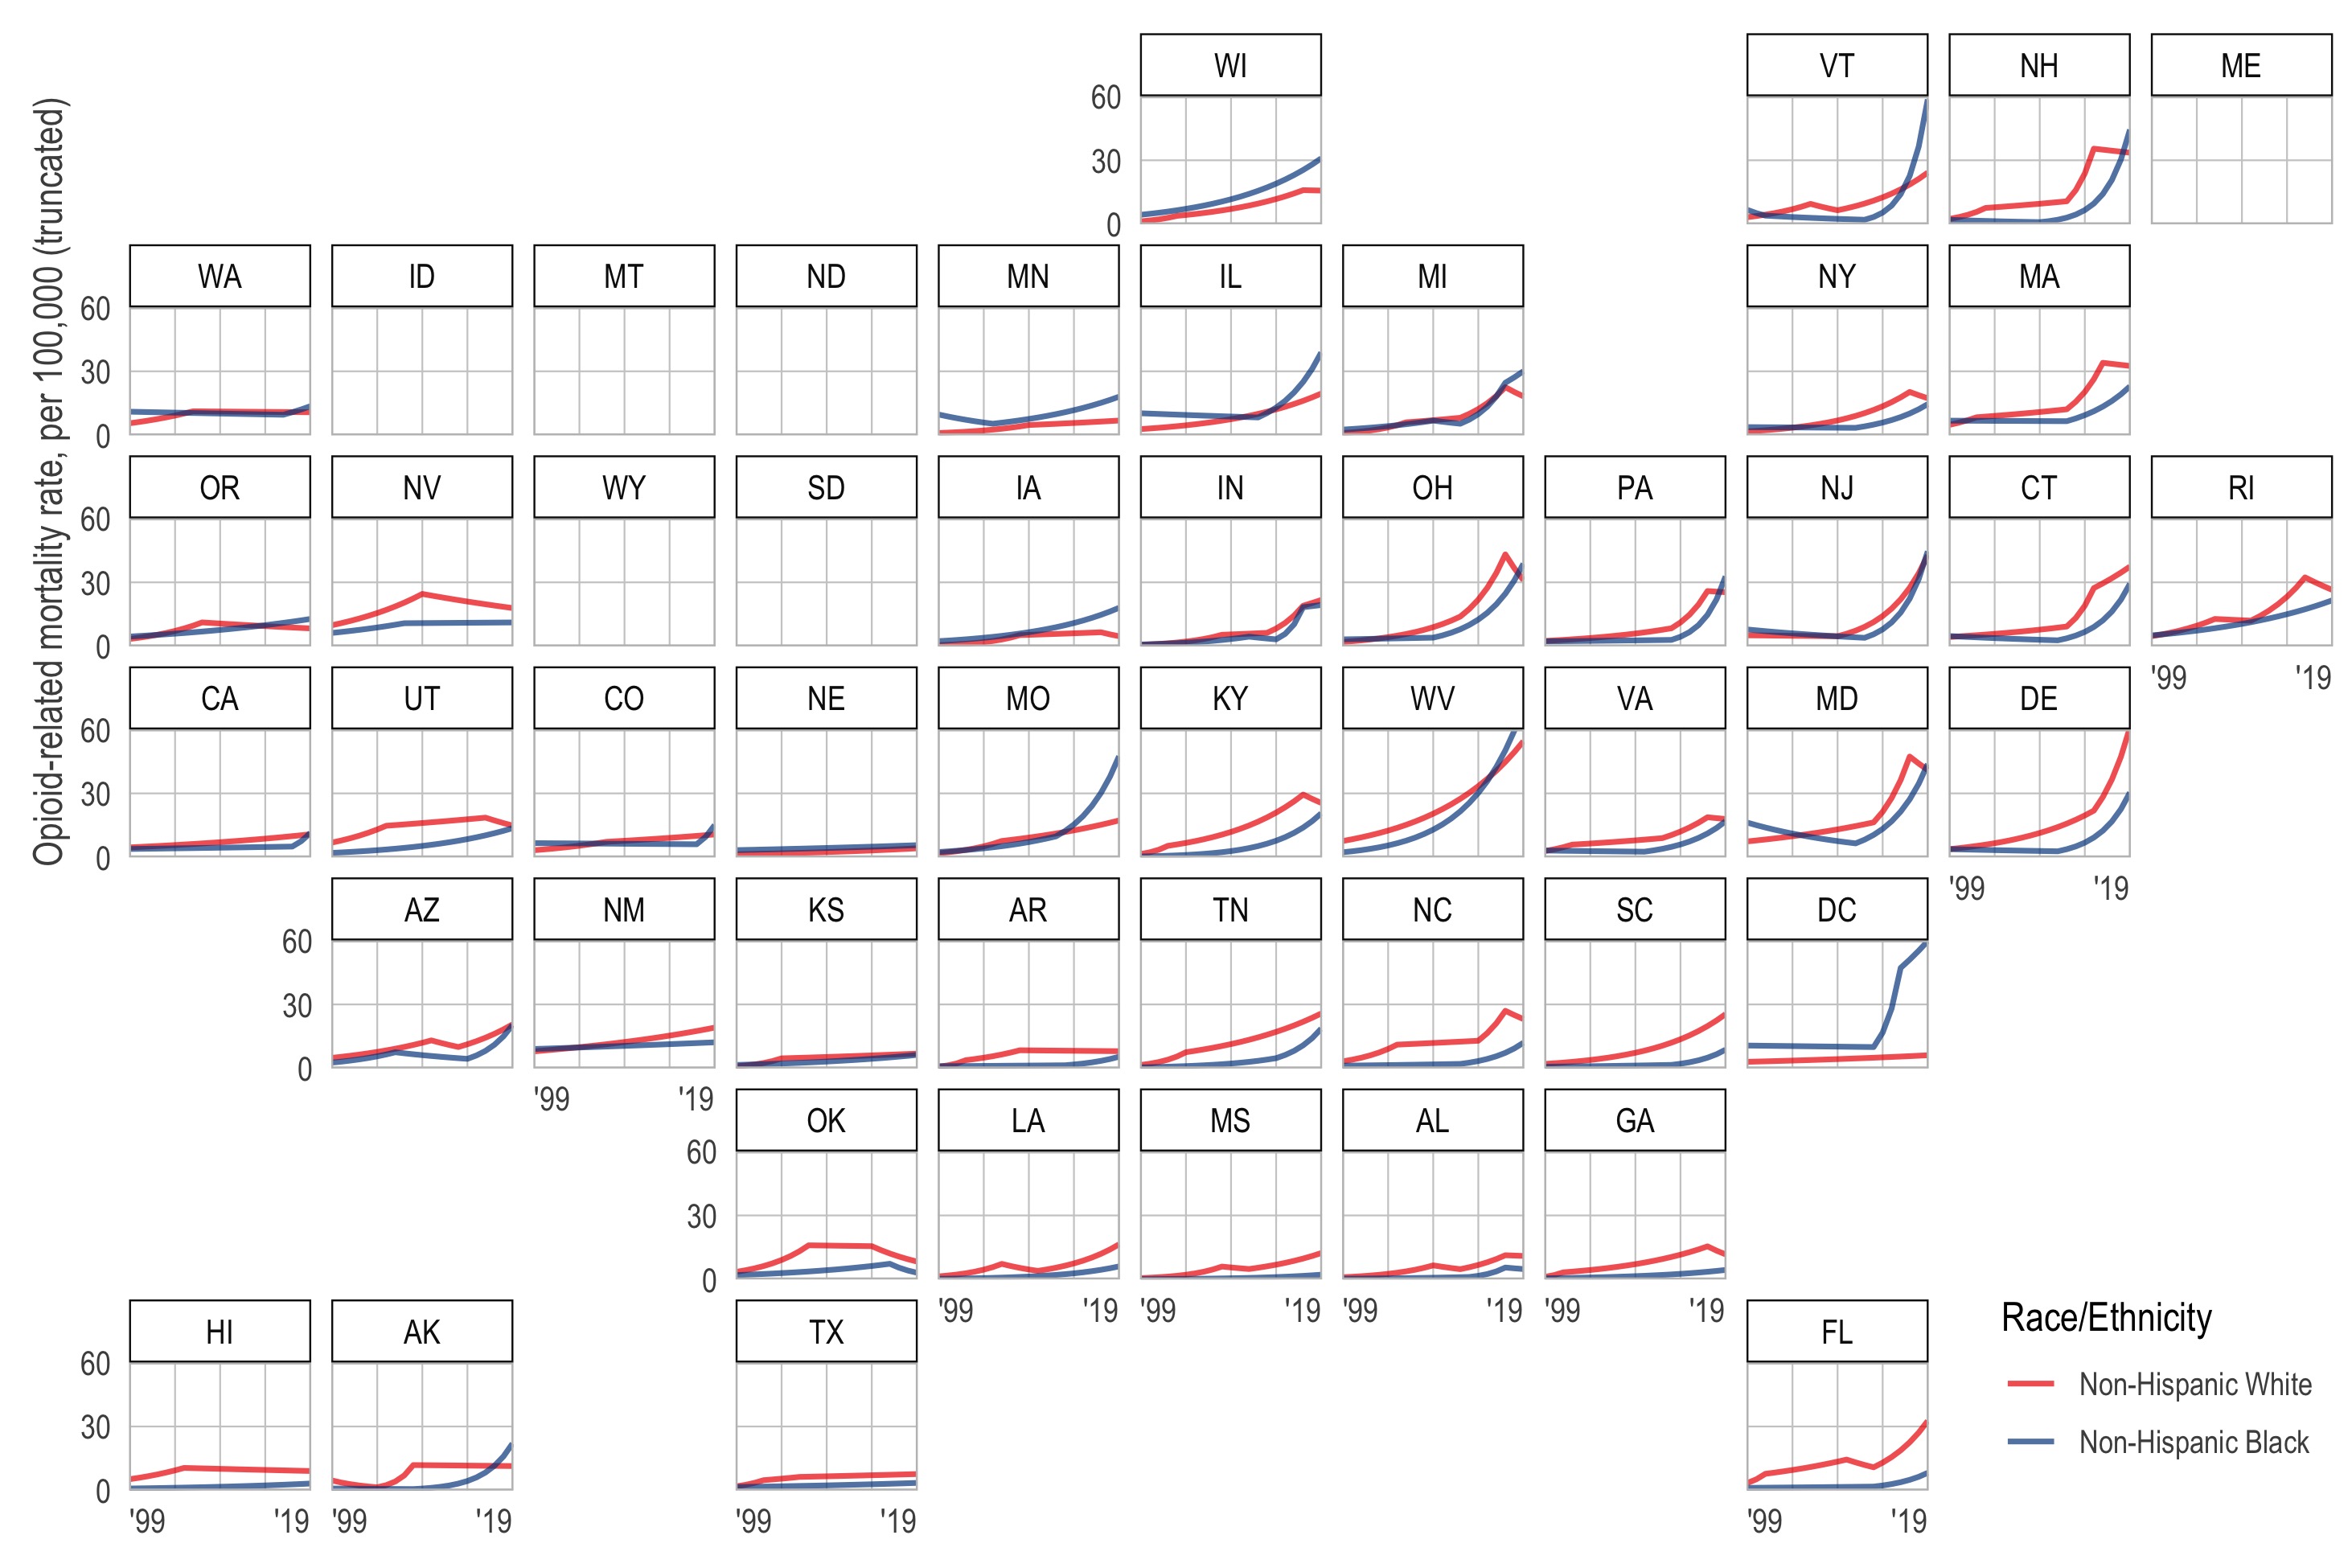
In 2019, there were nearly 50,000 opioid-related deaths in the US, with substantial variation across sociodemographic groups and geography. To systematically investigate patterns of racial/ethnic inequities in opioid-related mortality, we used joinpoint regression models to estimate the trajectory of the opioid epidemic among non-Hispanic Black versus non-Hispanic white residents in Washington DC, 45 states, and 81 sub-state areas. We highlight the unique inequities observed in Washington DC. In 2019, the observed opioid-related mortality rate among Black DC residents was 11.3 times higher than white DC residents, resulting in 56.0 more deaths per 100,000 (61.5 vs. 5.5 per 100,000). This inequity was substantially higher than any other jurisdiction on both the relative and absolute scales. Most opioid-related deaths in DC involved synthetic opioids, which was present in 92% (N=198) of deaths among Black DC residents and 69% (N=11) of deaths among white DC residents. Localized, equitable, culturally-appropriate, targeted interventions are necessary to reduce the uniquely disproportionate burden of opioid-related mortality among Black DC residents.
Additional model results including sortable versions of our appendix
tables can be found in the ./rmds/ folder.
Please submit issues via Github or via email.
In accordance with our data use agreement with the National Center for Health Statistics, we cannot share all data. When possible, we provide raw data as well as estimated data. In the cases where observations have fewer than 10 deaths, we suppress the rate. This restriction means this pipeline is not fully reproducible without the restricted-access data. (See Requirements.)
Unfortunately, for years after 2004, the multiple cause of death data do not include geographic identifiers. Therefore, state-level analysis using the public-access data is not possible. To get restricted data, you must apply through NVSS.
If you have the restricted data, they should either (1) in a subfolder
named ./data_private/ with the following names, or (2) you must
modify the regex command on line 33 of
./code/01_retrieve_opioid_deaths.R such that it returns a vector of
file paths to the restricted-access data. The vector should look like
something below:
fs::dir_ls("./data_private/")
#> ./data_private/MULT1999.AllCnty.zip
#> ./data_private/MULT2000.AllCnty.zip
#> ./data_private/MULT2001.AllCnty.zip
#> ./data_private/MULT2002.USPSAllCnty.zip
#> ./data_private/MULT2003.USPSAllCnty.zip
#> ./data_private/MULT2004.USPSAllCnty.zip
#> ./data_private/MULT2005.USPSAllCnty.zip
#> ./data_private/MULT2006.USPSAllCnty.zip
#> ./data_private/MULT2007.USPSAllCnty.zip
#> ./data_private/MULT2008.USPSAllCnty.zip
#> ./data_private/MULT2009.USPSAllCnty.zip
#> ./data_private/MULT2010.USPSAllCnty.zip
#> ./data_private/MULT2011.USPSAllCnty.zip
#> ./data_private/MULT2012.USPSAllCnty.zip
#> ./data_private/MULT2013.USPSAllCnty.zip
#> ./data_private/MULT2014.USPSAllCnty.zip
#> ./data_private/MULT2015.USPSAllCnty.zip
#> ./data_private/MULT2016.USPSAllCnty.zip
#> ./data_private/MULT2017.USPSAllCnty.zip
#> ./data_private/MULT2018.USPSAllCnty.zip
#> ./data_private/MULT2019.USAllCnty.zipAll analyses are conducted using R, which can be downloaded via
CRAN, and the Joinpoint Regression
Program, which can be downloaded from the National Cancer
Institute.
We also recommend the use of
RStudio when
running R, which will allow users to take advantage of
renv for dependency
management.
The analysis pipeline is divided into three discrete steps.
In Step (1), we clean, subset, munge, and calculate mortality rates
using the raw (restricted-access) data. This results in a working
dataframe that contains the data necessary for the joinpoint regression
program to fit models for each year, state, and opioid type for the
non-Hispanic White and non-Hispanic Black populations. These are held in
the 01 to 03 code files.
In Step (2), the joinpoint regressions are fit in an external program
(NCI Joinpoint Regression Program) and the results are exported. The
./joinpoint_analyses/age_std_rates_long.jps file contains our session
information to reproduce our analysis and requires the
./joinpoint_analyses/age_std_rates_long.csv file generated from the
step above.
In (3), the resulting (exported) joinpoint files are combined into a
single file for plotting and to create tables. These are code files 04
to 10.
All files should be run sequentially.
See ./rmds/session_info.html for more reproducibility information.
- Monica Alexander
(
: mjalexander |
: @monjalexander)
- Sanjay
Basu
(
: sanjaybasu |
: @sanjaybmdphd)
- Mathew Kiang
(
: mkiang |
: @mathewkiang)
- David Rehkopf
(
: @drehkopf)
- Alexander Tsai
(
: @drdrtsai)


