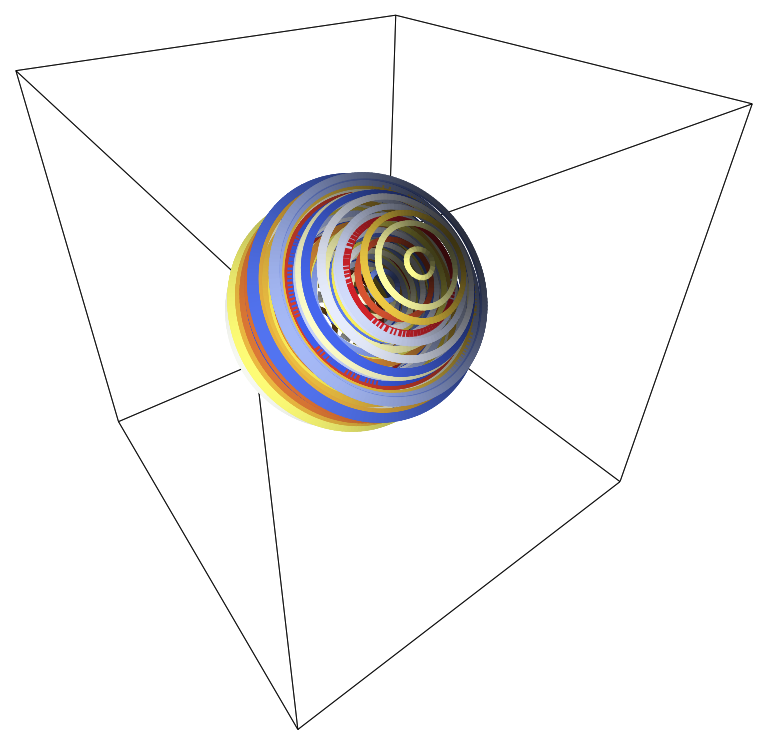
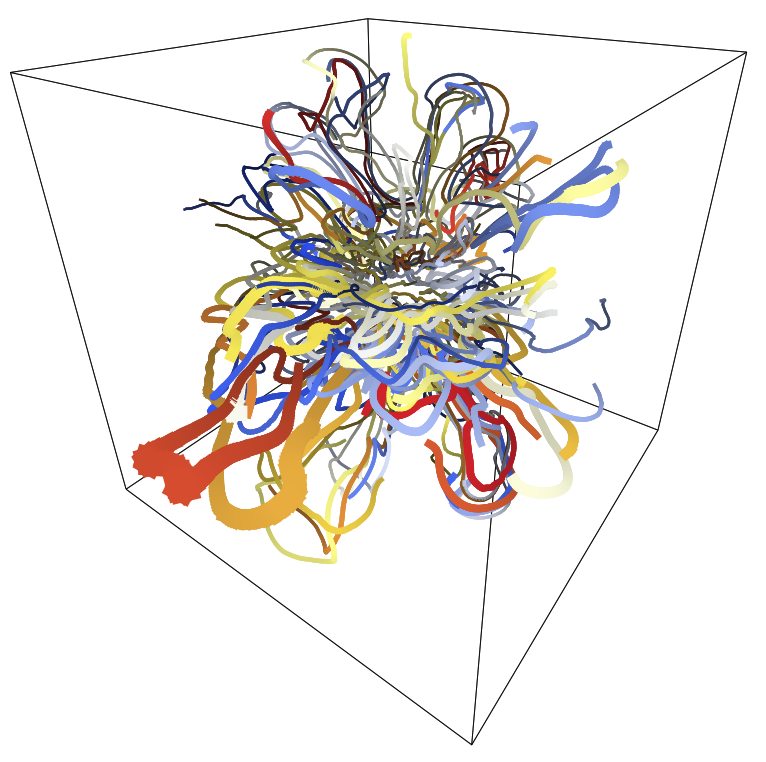
This is a program for plotting streamlines of 3D vector fields. My goal is to be able to include lots of field lines without having the plot become confusing. I wasn’t happy with any of the plotting packages I tried, so I decided to write this one.
I settled on a method using brightly colored lines and an exaggerated sense of perspective – I think this strikes a nice balance and shows the most detail in the field. Check out the examples below to see if you agree.
The project really comprises two programs: there’s a c code which reads in the simulation data and integrates the field lines. And there’s a mathematica script which makes the plots. Each can be used quite independently; see the implementation section below for more information.
I tried to make the integration accurate enough for the field lines to follow the flow. So you can use this code to make meaningful movies of magnetic field lines. Here’s a movie of a ball of tangled field lines unwinding. And here’s a movie of a ball of field loops advecting through periodic boundary conditions.
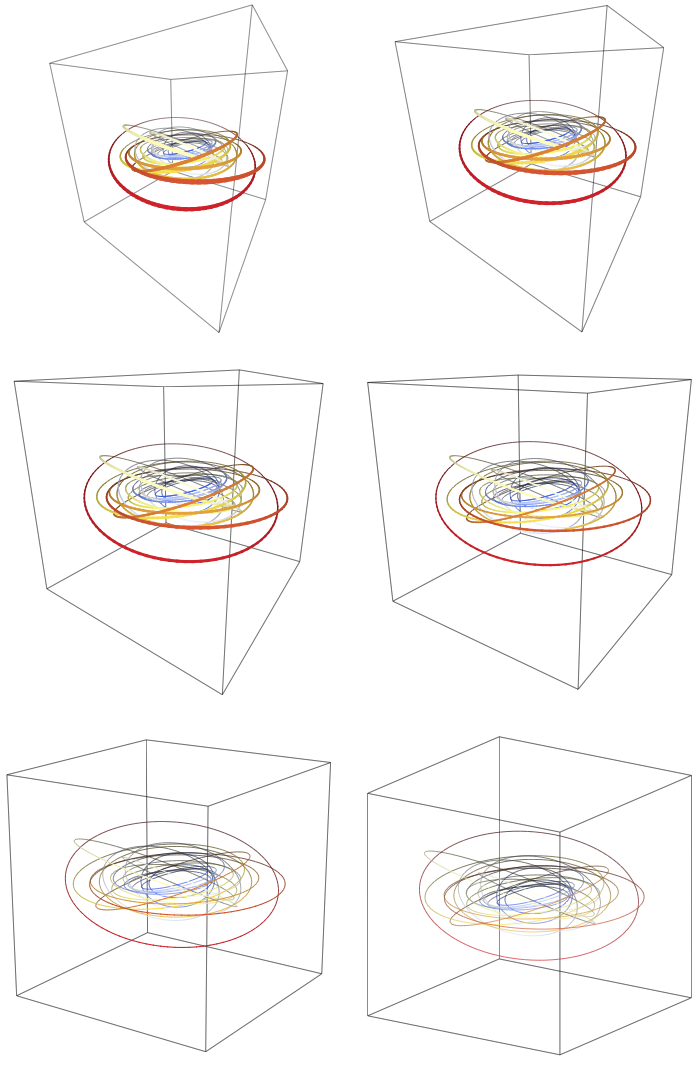
The mathematica code for plotting trajectories isn’t specifically tied to this project. Here’s an example plotting a random set of Keplerian orbits with different amounts of perspective:
As mentioned above this is really two programs: I wrote a c program to read in the vtk data and integrate the field lines, and a mathematica program to make the plots.
The c program borrows heavily from the Athena source code (GPL license). In particular, I use its functions for managing arrays, for processing input, and for reading vtk files. After reading in the data, I use a basic linear interpolation to get the values of the magnetic field along the streamline. And I integrate streamlines using a 4th order Runge-Kutta solver with an adaptive step size.
I attempt to cut off the integration when the streamlines either close, or become chaotic. The latter is not necessary for still images, but essential for making movies.
I plot the streamlines using a simple mathematica script. The core
of the program is the project function which builds a camera
matrix and uses it to project the lines onto an image plane:
project[dist_, alpha_, beta_, pts_] :=
    With[{
        (* location of the camera (assumed to be looking at the origin) *)
        camera = dist {Cos[beta] Cos[alpha], Cos[beta] Sin[alpha], Sin[beta]},
        (* mat1 rotates through -beta about the y axis *)
        mat1 = {
            {Cos[-beta], 0, -Sin[-beta]},
            {0, 1, 0},
            {Sin[-beta], 0, Cos[-beta]}},
        (* mat2 rotates through -alpha about the z axis *)
        mat2 = {
            {Cos[-alpha], -Sin[-alpha], 0},
            {Sin[-alpha], Cos[-alpha], 0},
            {0, 0, 1}}},
         (* loop over points: *)
         (* - first rotate through z, then y, to align x-axis with camera axis. *)
         (* - then project onto y-z plane and scale like 1/r. *)
         Map[Block[{v1 = mat1.mat2.#, v2 = mat1.mat2.camera, r},
                   r = Abs[First[v1 - v2]];
                   (1/r) {{0, 1, 0}, {0, 0, 1}}.v1] &, pts]]
The rest of the script essentially just calls this function, joins pairs of points into line segments, and colors them.
dist is the distance to the camera in units of the focal length.
I prefer a small-ish values to exaggerate the perspective. I also
scale the width and brightness of the lines with distance to make
them look more 3D.
I’ve only tested the c program with the Athena MHD code, but it should work with any vtk file. If not, only minor modifications should be needed to get it working. The mathematica code is more general; it should plot any list of 3D points.
To get started, you can clone this repository and run make:
git clone git@github.com:mkmcc/flines.git
cd flines
make
Make makes the directory bin and puts everything you need in
there.
flines assumes the vtk data is all in a single file. If you run
your simulation under MPI, you’ll need to join the outputs from
different processors first. If you put join_vtk.x and
join-vtk.rb in the simulation directory, running
ruby join-vtk.rb
will do this for you. It makes a merged directory with the
joined vtk files.
If you put flines and mk-flines.rb in the merged directory,
you can solve for the field lines:
ruby mk-flines.rb
This produces a “flines” file corresponding to every “vtk” file
(e.g., cloud.0100.vtk -> cloud.0100.flines). mk-flines.rb runs
in parallel if you have gnu parallel installed; otherwise it runs
in serial.
To make plots, copy the movie.m script into merged and run it
mash movie.m
(this is using the awesome mash script. If you don’t want to use
mash, you can either do something like this: MathKernel -noprompt
-run << movie.m, or you can copy the contents of movie.m into a
mathematica notebook and run it there). movie.m produces a
series of images which you can make into a movie.
If you don’t want to use the mathematica script, you can also use
gnuplot. For example, splot 'cloud.0100.flines' w l.
join-vtk.rb, mk-flines.rb, and movie.m all check whether the
output they’d produce is up to date. So you can run them
repeatedly as your simulation progresses without wasting any work.
You can also use the mathematica script on its own. The most important function to know about is
plotproject[dist_, alpha_, beta_, orbits_, defaultcolor_: False]
Here dist is the distance from the camera to the origin in units
of the focal length. alpha and beta are the angles from the
camera to the x-axis. orbits is a list of trajectories to plot;
each trajectory is a list of 3D points:
{{x1, y1, z1}, {x2, y2, z2}, {x3, y3, z3}, ...}
plotproject will work with any list of lists of points you give
it. If you want to read the points in from a file, the function
mkfig might be useful for you. It takes a file name as input and
saves a plot as a png image. The format is consistent with
gnuplot’s splot command.
This code is an early prototype, and it may never mature beyond that. In particular, it’s written for my own working style and for the types of data I work with. I’ve made no attempt to make this generally applicable or in any way user-friendly.
You are of course free to use this code if you like, but you shouldn’t expect to use it at this point without modifying the source at some level. That being said, I do want it to be useful, so I’ll help you get it working if I can. Of course I welcome patches, bug reports, or feature requests. At the moment, I just don’t have the resources to turn this into a finished application.
Since I’ve used code from the Athena project, this project is also released under the GPL license. You should use and modify it in any way you see fit.
- currently, field lines are drawn on top of the frame. would be nice to fix
- change color along field lines, according to strength?
- I tried this, and I think it made the plot too confusing. constant colors help tell the lines apart
- write a script to run
movie.min parallel.- this should be trivial in the mathematica code:
Map->ParallelMap. that works for me in mathematica 7, but not mathematica 9. annoying, but easy to solve withxargs…
- this should be trivial in the mathematica code:
Plotting field lines essentially involves threading matrix multiplication across a list of points and then drawing a bunch of line segments. Mathematica is almost ideally suited to this task. Unfortunately, it also has a number of problems:
- mathematica is closed source, expensive, and not available everywhere.
- mathematica has an awkward syntax – sort of half-lisp, half-c – which may seem unfamiliar and hard to modify
- mathematica doesn’t give you explicit control over the size or centering of images, which is really annoying for making movies
Also, Mathematica 9 seems to have trouble running movie.m in
parallel, at least on my computer. That is annoying.
So I’m contemplating rewriting the plotting code in a different language. One option is to use clojure with quil. But clojure isn’t widely used among scientists, and it’s kind of a pain to install. Another option is to write it in c, using the cairo graphics library. But I don’t like to write in c unless I have to. I may write it in ruby using the wonderful Tioga graphics library.
- see the tioga/ directory for a start using ruby and tioga
- weight seed-point sampling by field strength? seems like a good idea.
- add support for velocity streamlines?


