============================ This is a high-level lib built on D3js to allow for easy and quick development of dynamically populated charts, especially thought to represent live, real-time data.
- Minified : https://raw.github.com/mlarocca/Dynamic-Charts/master/dynamic_chart.min.js
- Docs: http://mlarocca.github.com/Dynamic-Charts/
Showcase #1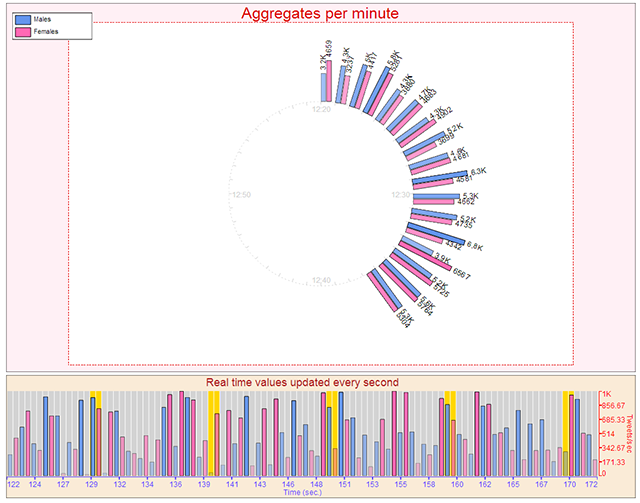 |
Showcase #2 |
- Every Constructor's parameters list has been modified, so take care, if you need support for older version, you just need to update your src field to point to version 0.1 folder (see below).
- Some methods have been renamed (see documentation for a list of deprecated methods), and many new methods have been added.
Since I realize how painful it could get to review all of your code in order to switch to a new version, support to the old versions of the libs will be maintained; from now on, each release minified version will be uploaded to two locations:
- /Dynamic-Charts/master/dynamic_chart.min.js will always point to the most recent version;
- /Dynamic-Charts/master/vX_Y/dynamic_chart.vX_Y.min.js will point to version X.Y; this release will only be updated to fix bugs, but no change in the interface will be made, so that the permalink to the lib will work over time.
I apologize for the hassle, but some change was needed to improve the lib, which was not in a stable release yet. We'll try to keep these changes to a minimum in the future.
- setAbbreviatedLabel, setExtendedLabel: For each subcomponent of the data, labels can be abbreviated using scientific notation for numbers whose absolute value is smaller than 1, or standard abbreviations (like 1.3K or 43.8M) for numbers greater than 1.
- The layout of the chart has been enhanced to include the appropriate space for four margin areas: One above the core of the chart, one on its left, one on its right, and one below it.
-
The size of these margins can be set on construction ONLY (a new parameter has been added to the charts' contructors); -
The Title of the chart is added to the top area; -
The x axe is added by default to the left area, but can also be moved to the right; -
The y axe is added to the bottom area.
-
- setInnerBackgroundColor, setOuterBackgroundColor, setInnerBorder, setOuterBorder: Background color and border can be set for the outer area, including the 4 axes, and the main chart area, where the data will actually be plot.
- setVerticalAxe, setHorizontalAxe: vertical and horizontal axes are now supported and can be added or hidden at runtime.
###Downloads