The census transform is a non-parametric kernel-based intensity order descriptor and is invariant to global intensity changes. Every pixel of an image is represented by a binary vector, which encodes the spatial relationship of a center pixel with respect to the gray values of pixels in a local neighborhood. Considering the 8 neighbors of a reference pixel in a 3 x 3 neighborhood, every bit of the 8 bit binary vector encodes, which pixel has higher or lower intensity.
We implemented the census transform as layer operation for PyTorch and show its effect in the following example. We load the famous camera man image and add 0.1 to every pixel to simulate global intensity change. The difference between img1 and img2 is greater than 0. However, after census transforming both images, the difference is 0.
import torch
from census_transform import CensusTransform
from skimage import data, img_as_float
from matplotlib import pyplot as plt
import numpy as np
img1 = img_as_float(data.camera())
plt.figure()
plt.imshow(img1)
plt.show()
# add global intensity change (you won't see it though due to matplotlib's color mapping)
img2 = (img1 + 0.1)
plt.figure()
plt.imshow(img2)
plt.show()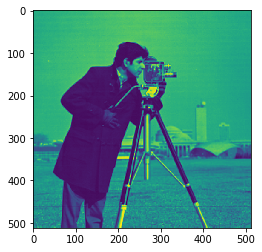
print(np.linalg.norm(img2 - img1))51.2000000000005
img1_t = torch.Tensor(img1).unsqueeze(0).unsqueeze(0)  # inputs need to be 4D array with [N x C x H x W]
img2_t = torch.Tensor(img2).unsqueeze(0).unsqueeze(0)
census = CensusTransform()
img1_tc = census(img1_t)[0, 0]
img2_tc = census(img2_t)[0, 0]
plt.figure()
plt.imshow(img1_tc)
plt.figure()
plt.imshow(img2_tc)
plt.show()
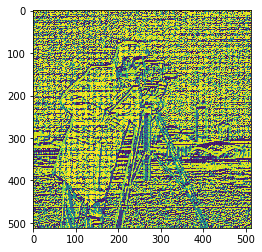
print(np.linalg.norm(img2_tc - img1_tc))0.0
Max-Heinrich Laves
laves@imes.uni-hannover.de
@MaxLaves
Institute of Mechatronic Systems
Leibniz Universität Hannover
Appelstr. 11A, 30167 Hannover, Germany