In this tutorial, you will walk through an introduction to OpenShift Container Platform (OCP) from both the web console and the OpenShift command line interface, oc. This tutorial is based on the Getting Started portion of the OpenShift Container Platform documentation, but modified to run on various platform architectures (including IBM Z, IBM Power, and x86) as well as adding more explanations for the concepts it covers.
- Introduction to Red Hat OpenShift
- Table of Contents
- Pre-Requisites
- OpenShift Overview
- Overview of the OpenShift Web Console
- Connect to the OpenShift Console
- The Administrator Perspective
- The Developer Perspective
- Deploying a Container Image
- Examining the Pod
- Scaling the Frontend Application
- Introduction to the
ocCLI - Logging in with the
ocCLI - Exploring the
ocCLI - Use
octo Deploy a Python Application from Source Code - Deploying and Configuring MongoDB
- Providing Sensitive Application with Secrets
- Persistent Storage with OpenShift Data Foundation (ODF)
- Metering, Monitoring, and Alerts
- Cleanup
- Conclusion
- Glossary of Terms
- Access to an OpenShift cluster
ocCLI installed- Projects created for each user with the names
userNN-project(NNbeing each user number). Administrators can create this ahead of time with any limitations or quotas they wish, or administrators can allow users to create their own projects.
If you are going through this lab during a workshop provided by the IBM Z Washington Systems Center, these pre-requisites are already fulfilled in the environment you were provided.

OpenShift Container Platform is an enterprise-grade container platform based on Kubernetes. OpenShift is designed to allow applications and the data centers that support them to expand from just a few machines and applications to thousands of machines that serve millions of clients.
With its foundation in Kubernetes, OpenShift Container Platform incorporates the same technology that serves as the engine for massive telecommunications, streaming video, gaming, banking, and other applications. Its implementation in open Red Hat technologies lets you extend your containerized applications beyond a single cloud to on-premises and multi-cloud environments.

OpenShift Container Platform, commonly referred to as OpenShift or OCP, is a Kubernetes environment for managing the lifecycle of container-based applications and their dependencies on various computing platforms, such as bare metal, virtualized, on-premises, and in cloud. OpenShift deploys, configures and manages containers. OpenShift offers usability, stability, and customization of its components.
OpenShift utilizes a number of computing resources, known as nodes. Each node runs a lightweight, secure operating system based on Red Hat Enterprise Linux (RHEL), known as Red Hat Enterprise Linux CoreOS (RHCOS).
After a node is booted and configured, it obtains the CRI-O container runtime for managing and running the images of container workloads scheduled to it. The Kubernetes agent, or kubelet schedules container workloads on the node. The kubelet is responsible for registering the node with the cluster and receiving the details of container workloads.
OpenShift configures and manages the networking, load balancing and routing of the cluster. OpenShift adds cluster services for monitoring the cluster health and performance, logging, and for managing upgrades.
The container image registry and OperatorHub provide Red Hat certified products and community-built software for providing various application services within the cluster. These applications and services manage the applications deployed in the cluster, databases, frontends and user interfaces, application runtimes and business automation, and developer services for development and testing of container applications.
You can manage applications within the cluster either manually by configuring deployments of containers running from pre-built images or through resources known as Operators. OpenShift can also build and deploy custom images from source code so you developers can focus on developing - without learning new skills such as containerizing their code.
The OpenShift Container Platform web console is a user interface accessible from a web browser.
Developers can use the web console to visualize, browse, and manage the contents of projects.

Administrators can use the web console to manage and monitor applications running on the cluster, along with the cluster itself.

The web console can be customized to suit an organization's needs, and when you log into the web console, you will only see the cluster resources that are available to you as allowed by the OpenShift Role Based Access Control (RBAC).
The web console runs as a group of pods on the control plane nodes in the openshift-console project, along with a service exposed as a route. Like any other OpenShift application the service is an internal load balancer that directs traffic to one of the OpenShift console pods. The route is what allows external access into the service, and it is the address you connect to when accessing the OpenShift web console.
The OpenShift web console is a great example of how OpenShift itself is run and managed as pods inthe same way as workloads running on the cluster.
-
Open a web browser such as Firefox or Google Chrome.
-
In the browser, navigate to your OpenShift console.
If you are going through this lab during a workshop provided by the IBM Z Washington Systems Center, you can find this address in the access page in this respository.
The OpenShift console typically begins with
https://console-openshift-console-. Reach out to your OpenShift administrator if you do not have this address.You will now see the OpenShift console login page.

-
Log in with your OpenShift credentials.
Take a moment to notice the following elements in the navigation bar:

These buttons display on each page of the OpenShift console. Note that the Applications button might be missing from your screen, depending on your credentials and which applications are currently deployed on the cluster.
By default, the menu on the left side of the page should be activated and displaying the cluster menu. However, if your screen is sized too small, you may need to click the Menu button to expand it.
-
In the left-side menu, select the Administrator perspective if it isn't already showing.

With the administrator menu showing, you are provided with a broad range of options to manage the OpenShift cluster and the applications running on it.

The Administrator perspective is the default view for the OpenShift console for users who have an administrative access level. This perspective provides visibility into options related to cluster administration, the cluster operators running the OpenShift cluster itself, as well as a broader view of the projects associated with the currently authenticated user.
Your user credentials have the
cluster-readerroleBinding. This is a read-only roleBinding that allows you to see most of what OpenShift has to offer administrators without allowing you to modify cluster objects. For example, typical non-admin users would not be able to complete the following few steps. -
In the menu at the very bottom, click Administration -> Cluster Settings.

The cluster settings page is where administrators can see what OpenShift versions are available, and also update the cluster from within the console. OpenShift completely automates the cluster update once triggered by an administrator, including updating all of the cluster operators and the CoreOS operating system running on the nodes.
-
On the Cluster Settings page, select the ClusterOperators tab.

Each clusterOperator is responsible for managing resources related to a specific OpenShift function. For example, the
authenticationclusterOperator manages all of the resources (pods, routes, secrets, etc.) related to the LDAP authentication you are using to log in with theuserNNusername. -
In the Menu, click Compute -> Nodes.

As you see on the Nodes page, the OpenShift cluster is made up of control plane nodes and compute nodes.
- Control Plane nodes are responsible for most of the core Kubernetes and OpenShift services such as etcd, the Kubernetes and OpenShift apiservers, the scheduler, and more. There are all vital tasks that make it possible to run the cluster and schedule application workloads to Compute Nodes.
- Compute nodes are where application containers run. The containers for the sample application that you will build and deploy later in this lab will run on the compute nodes.
In production environments, nodes are typically run on multiple machines (physical and/or virtual) in order to be more highly available and fault-tolerant.
-
On the Nodes page, click the hyperlink for one of the Compute nodes.

When looking at a specific node, you are provided a view similar to the OpenShift cluster overview page, but now it is scoped to display only the pods, events, metrics, etc. for the specific node of interest.
-
On the Compute Node's page, click the Details tab.

On the node details tab, you are provided more information about the node including the architecture it is running on. In the screenshot above, the
s390xarchitecture indicates that the node is running the Linux on IBM Z (s390x) architecture.One of the many benefits of OpenShift (and Kubernetes more broadly) is that they abstract away the underlying infrastructure from the end users - developers and Kubernetes administrators. It does not take any traditional or specialized skills to run containers on platforms such as IBM Z.
-
In the Menu, click Home -> Projects.

The rest of the page is populated by projects. A project has been created for you to work in named
userNN-project(where 'NN' is your user number). If your OpenShift administrator did not create this project for you, you should be able to do so yourself with theCreate Projectbutton in the top right of the projects page.Any project starting with
openshift-orkube-contain the workloads running the OpenShift platform itself. -
Click the userNN-project hyperlink (where 'NN' is your user number).
Tip: With so many Projects displayed, you can use the search bar to find yours more easily.
You will now see the Dashboard for your project.

OpenShift automatically creates a few special serviceAccounts in every project. The
defaultserviceAccount takes responsibility for running the pods. OpenShift uses and injects this serviceAccount into every pod that launches.The following step creates a RoleBinding object for the
defaultserviceAccount object. The serviceAccount communicates with the OpenShift Container Platform API to learn about pods, services, and resources within the project. -
Click the RoleBindings tab of your project, and then click Create Binding.

-
Fill out the form as follows.
- Name:
sa-user-account - Role Name:
view - Subject:
ServiceAccount - Subject namespace:
userNN-projectwhereNNis your user number - Subject Name:
default

Then click create.
Now, the pods you create in this project that use the
defaultserviceAccount will have the proper permissions needed for the sample application. - Name:
-
Look through the Overview tab of your project.
This displays information about what’s going on in your project, such as CPU and memory usage, any alerts or crashlooping pods, an inventory of all the Kubernetes resources deployed in the project, and more. You won’t see much information yet, as no workloads should be running in this project.
-
Click the Workloads tab to the right of YAML.
This page displays all of the workloads in your project, so it’s empty for now.
All objects in OpenShift can be generated using [YAML(https://yaml.org/)] files. YAML is a human-readable language for configuration files. Most OpenShift object such as Deployments, Services, Routes, etc. can be modified by directly editing their YAML file in either the console or command line.
Workloads are typically created by developers, so in the next section, you will swap to the developer perspective to deploy an application. You will return to the administrator perspective later in this lab.
-
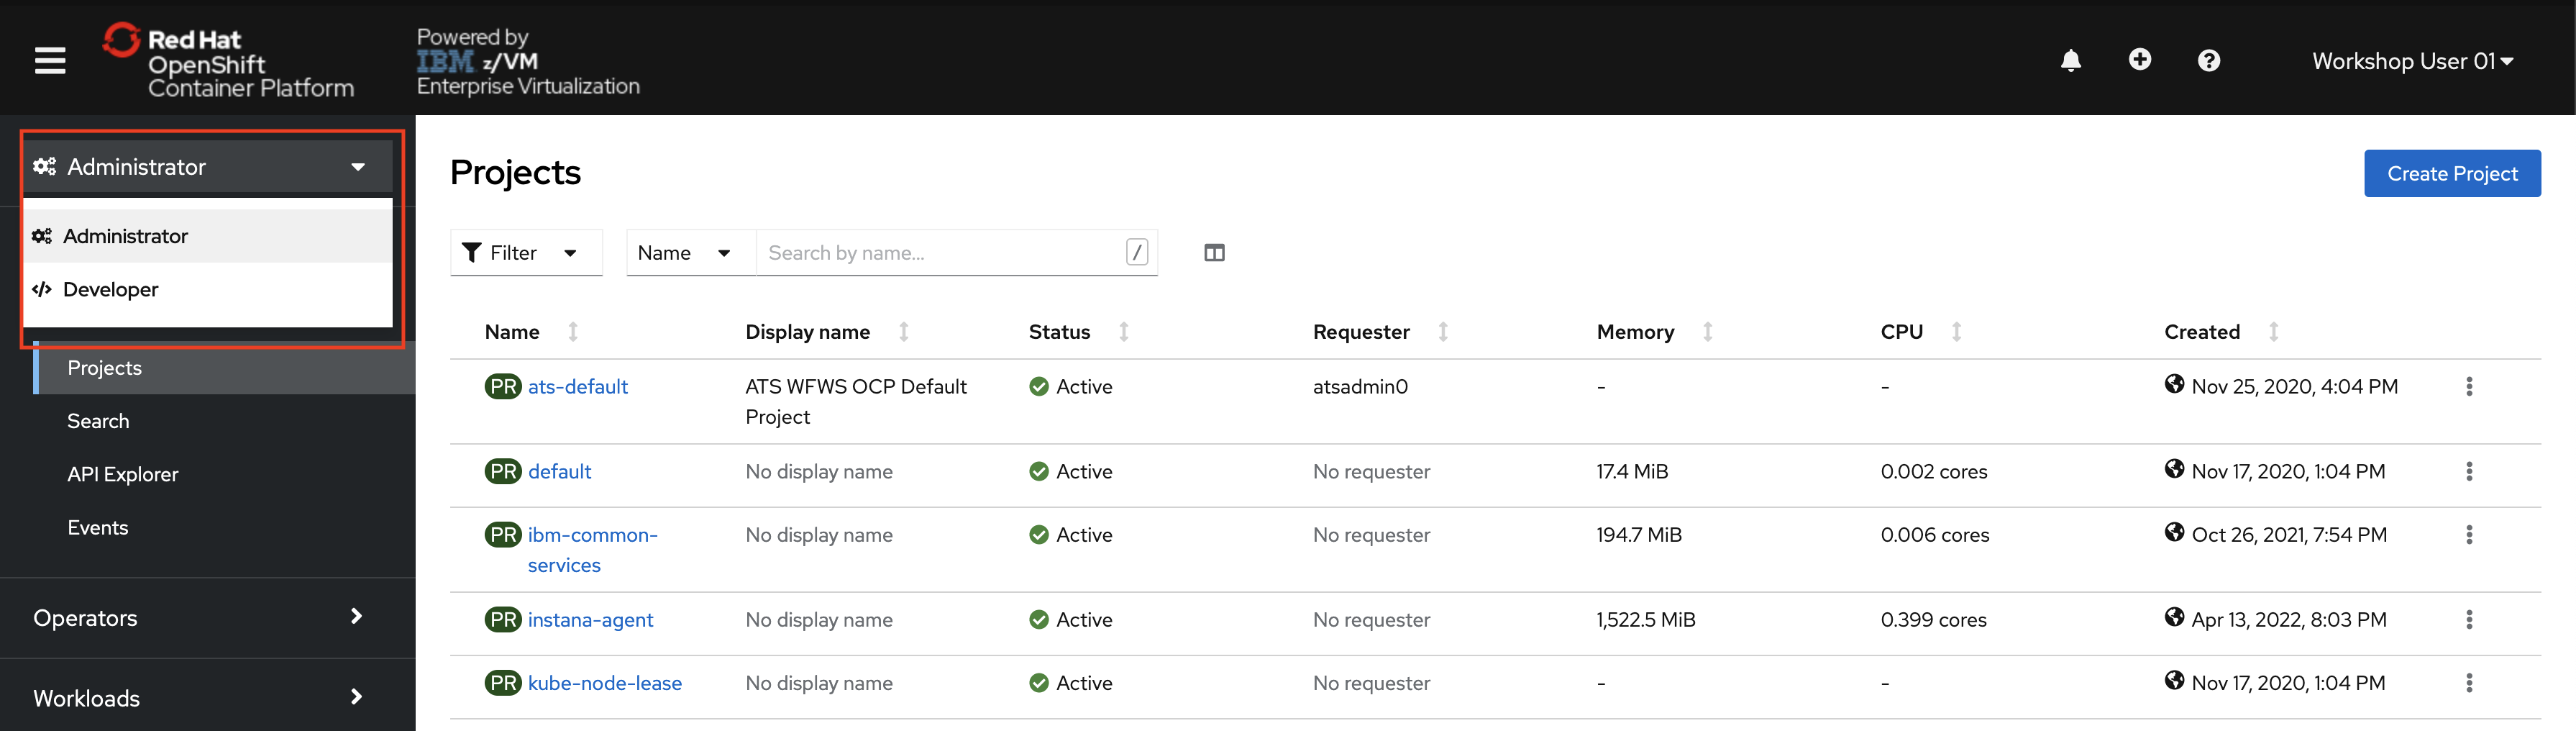
In the left-side Menu, click the Administrator dropdown, and select Developer.

The Developer perspective provides views and workflows specific to developer use cases, while hiding many of the cluster management options typically used by administrators. This perspective provides developers with a streamlined view of the options they typically use.

Switching to the Developer perspective should take you to the Topology view. If this isn't the case, select the Topology item in the left-side menu. If no workloads are deployed in the selected project, options to start building an application or visit the +Add page or are displayed.
-
Click the +Add button in the menu.

There are multiple methods of deploying workloads from the OpenShift web browser, including from raw source code hosted in a Git repository, from a pre-built container image, or from an operator.
The simplest way to deploy an application in OpenShift Container Platform is to run an existing container image. The following procedure deploys a front end component of an application called national-parks-app. This frontend web application displays an interactive map which shows the location of national parks across North America.
-
From the +Add view in the Developer perspective, click Container images.
-
Enter the following values:
- Image name from external registry:
quay.io/mmondics/national-parks-frontend:latest - Application name:
national-parks-app - Name:
parksmap
Keep the default target port as well as the route option checked.
In the Advanced Options section, click Labels and add labels to better identify this deployment later. Labels help identify and filter components in the web console and in the command line. Add the following labels:
app=national-parks-appcomponent=parksmaprole=frontend
Note: you can hit the
enterortabkey to enter each individual label. - Image name from external registry:
-
Click Create.
You are redirected to the Topology page where you will shortly see the
parksmapdeployment in thenational-parks-appapplication.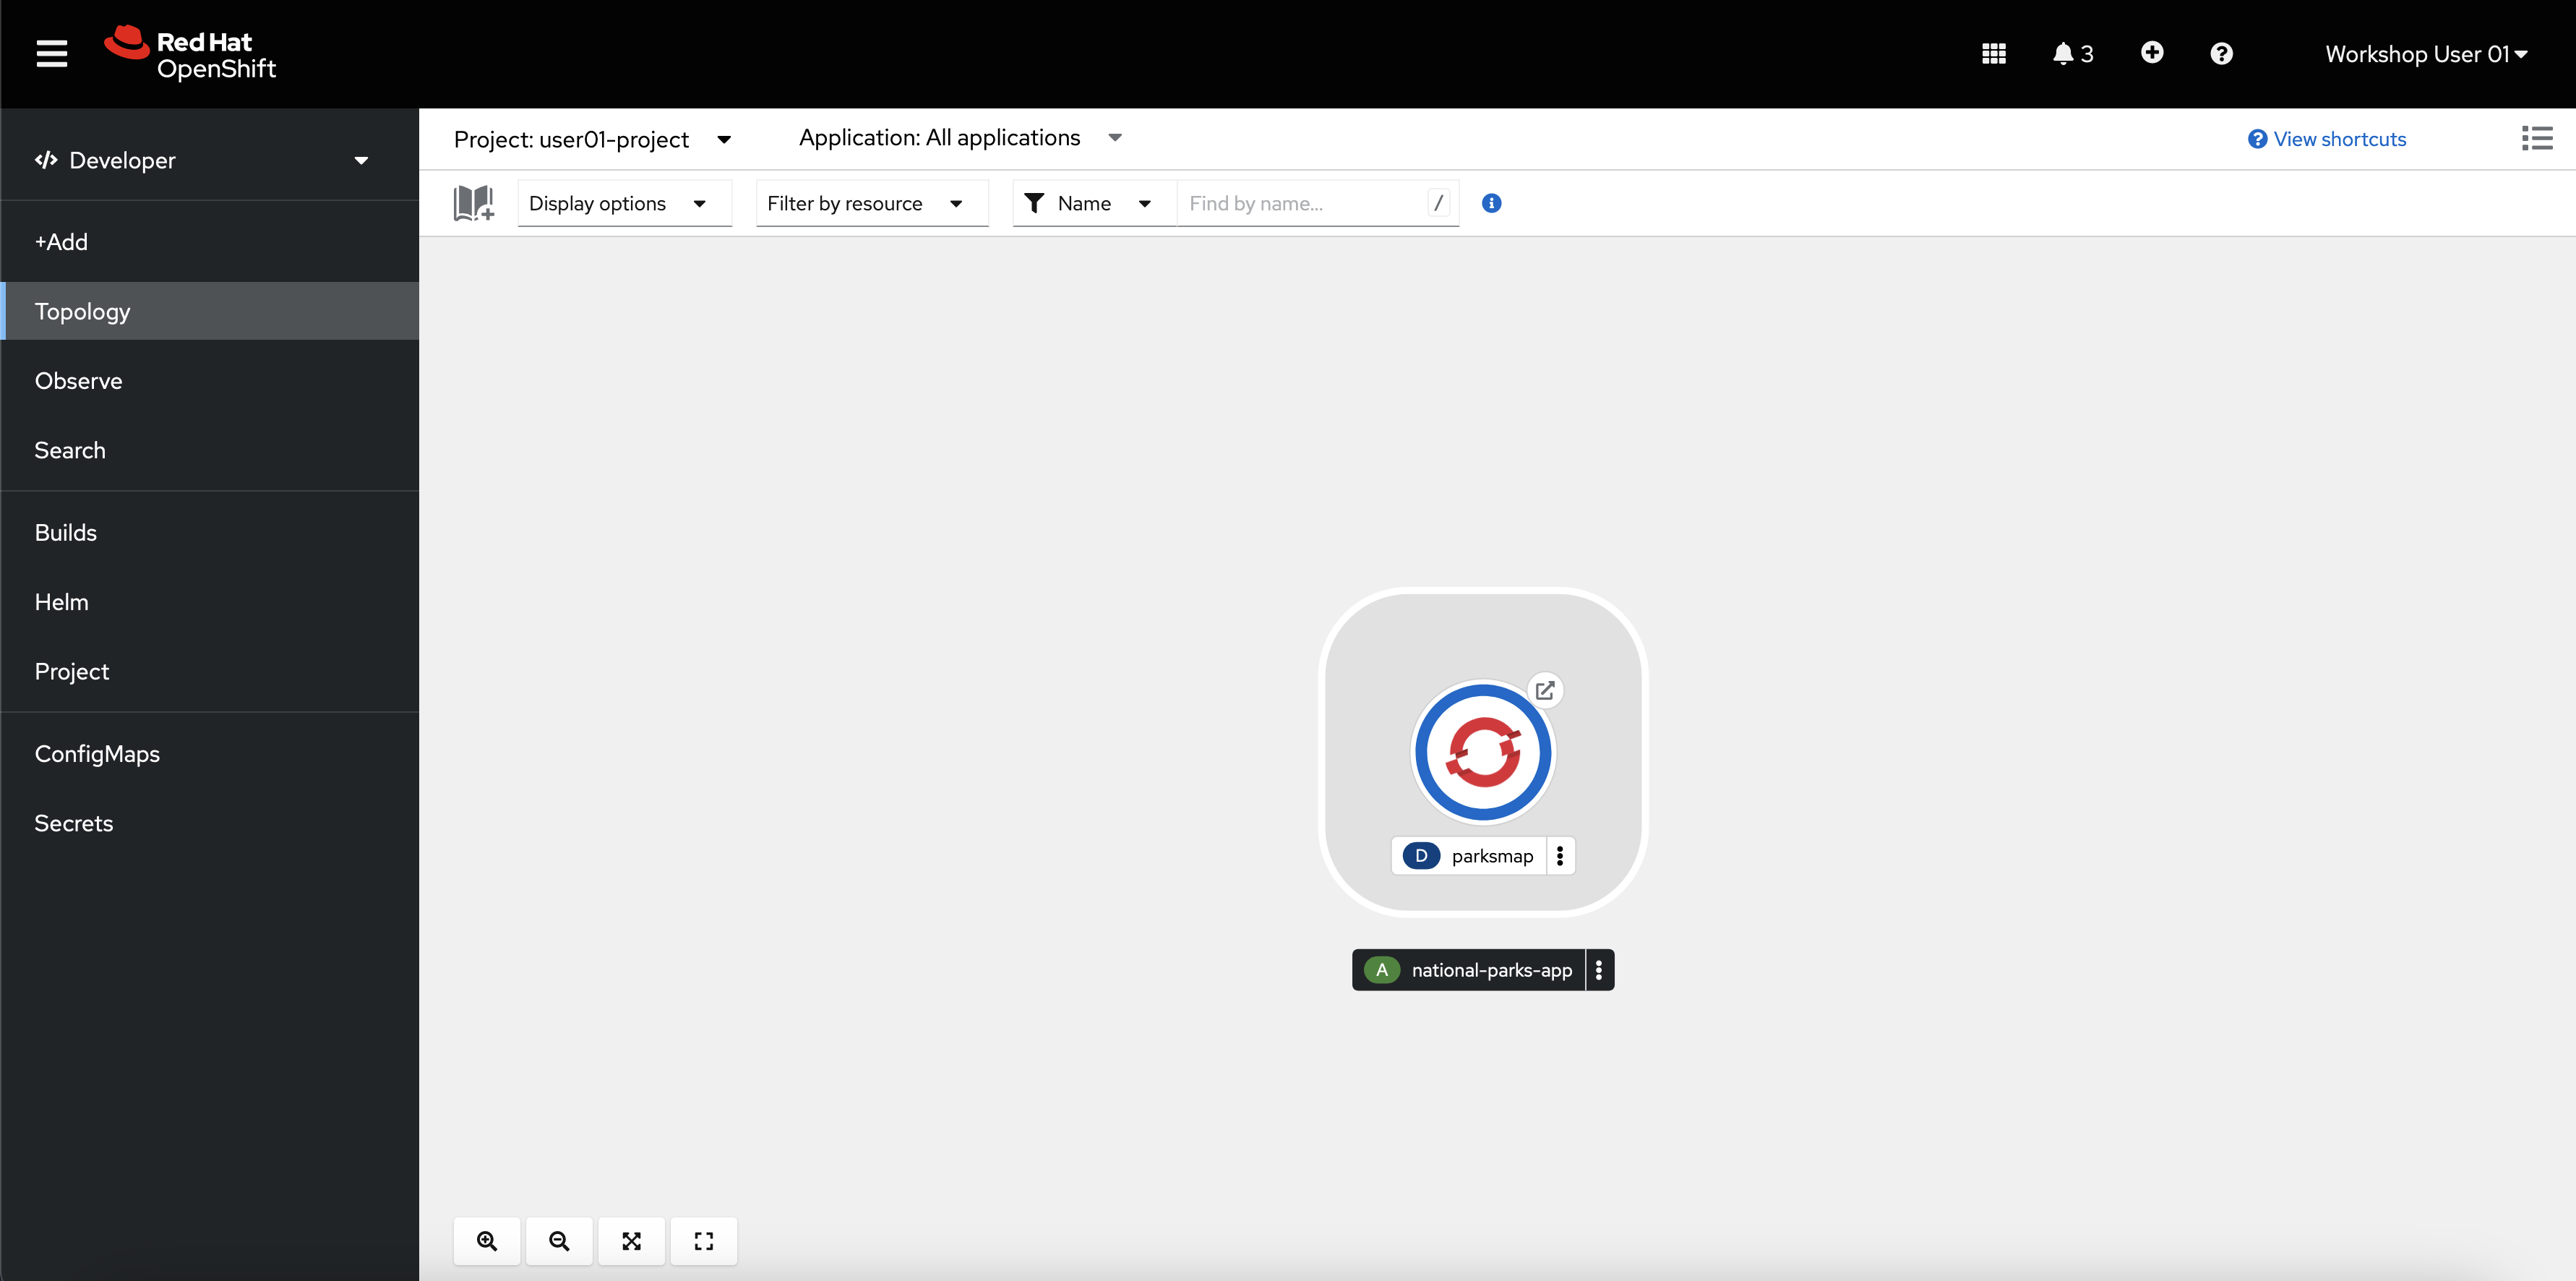

The topology page gives you a visual representation of your application where you can view and monitor its components.
-
Click the circular icon for your
parksmapdeployment.This brings up a window on the right side of the screen with more options for the deployment.
-
Click the details tab, if not already on it.
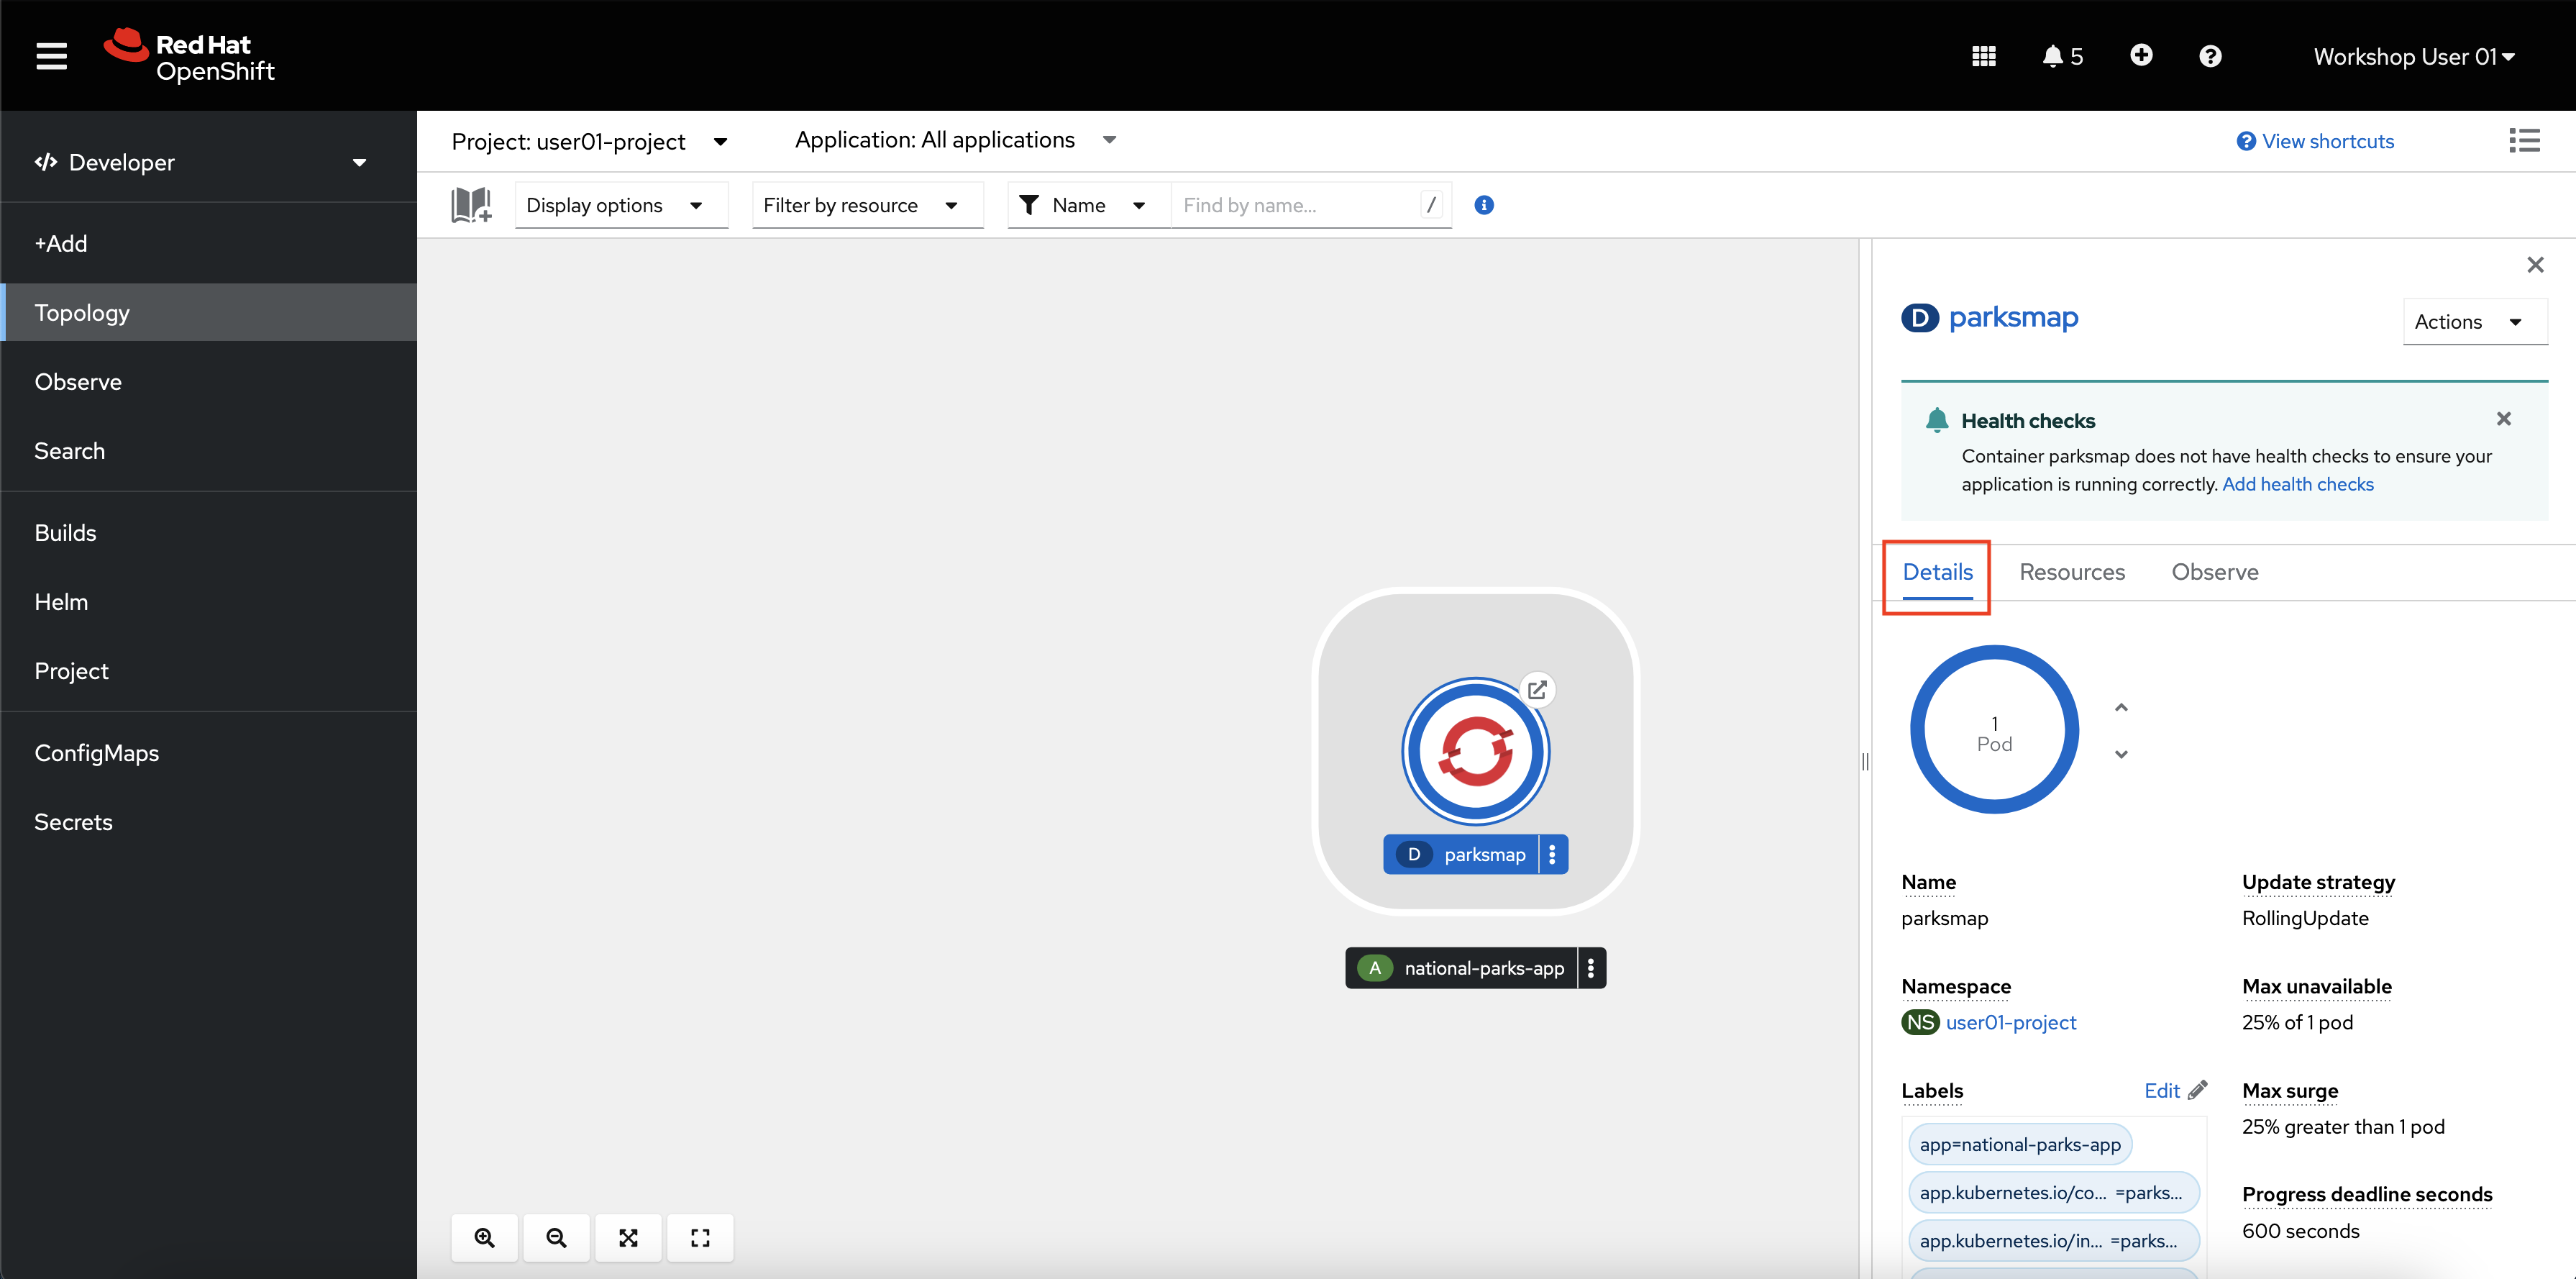

Here you can manage its properties including number of copies, labels, or storage.
-
Click the Resources tab.
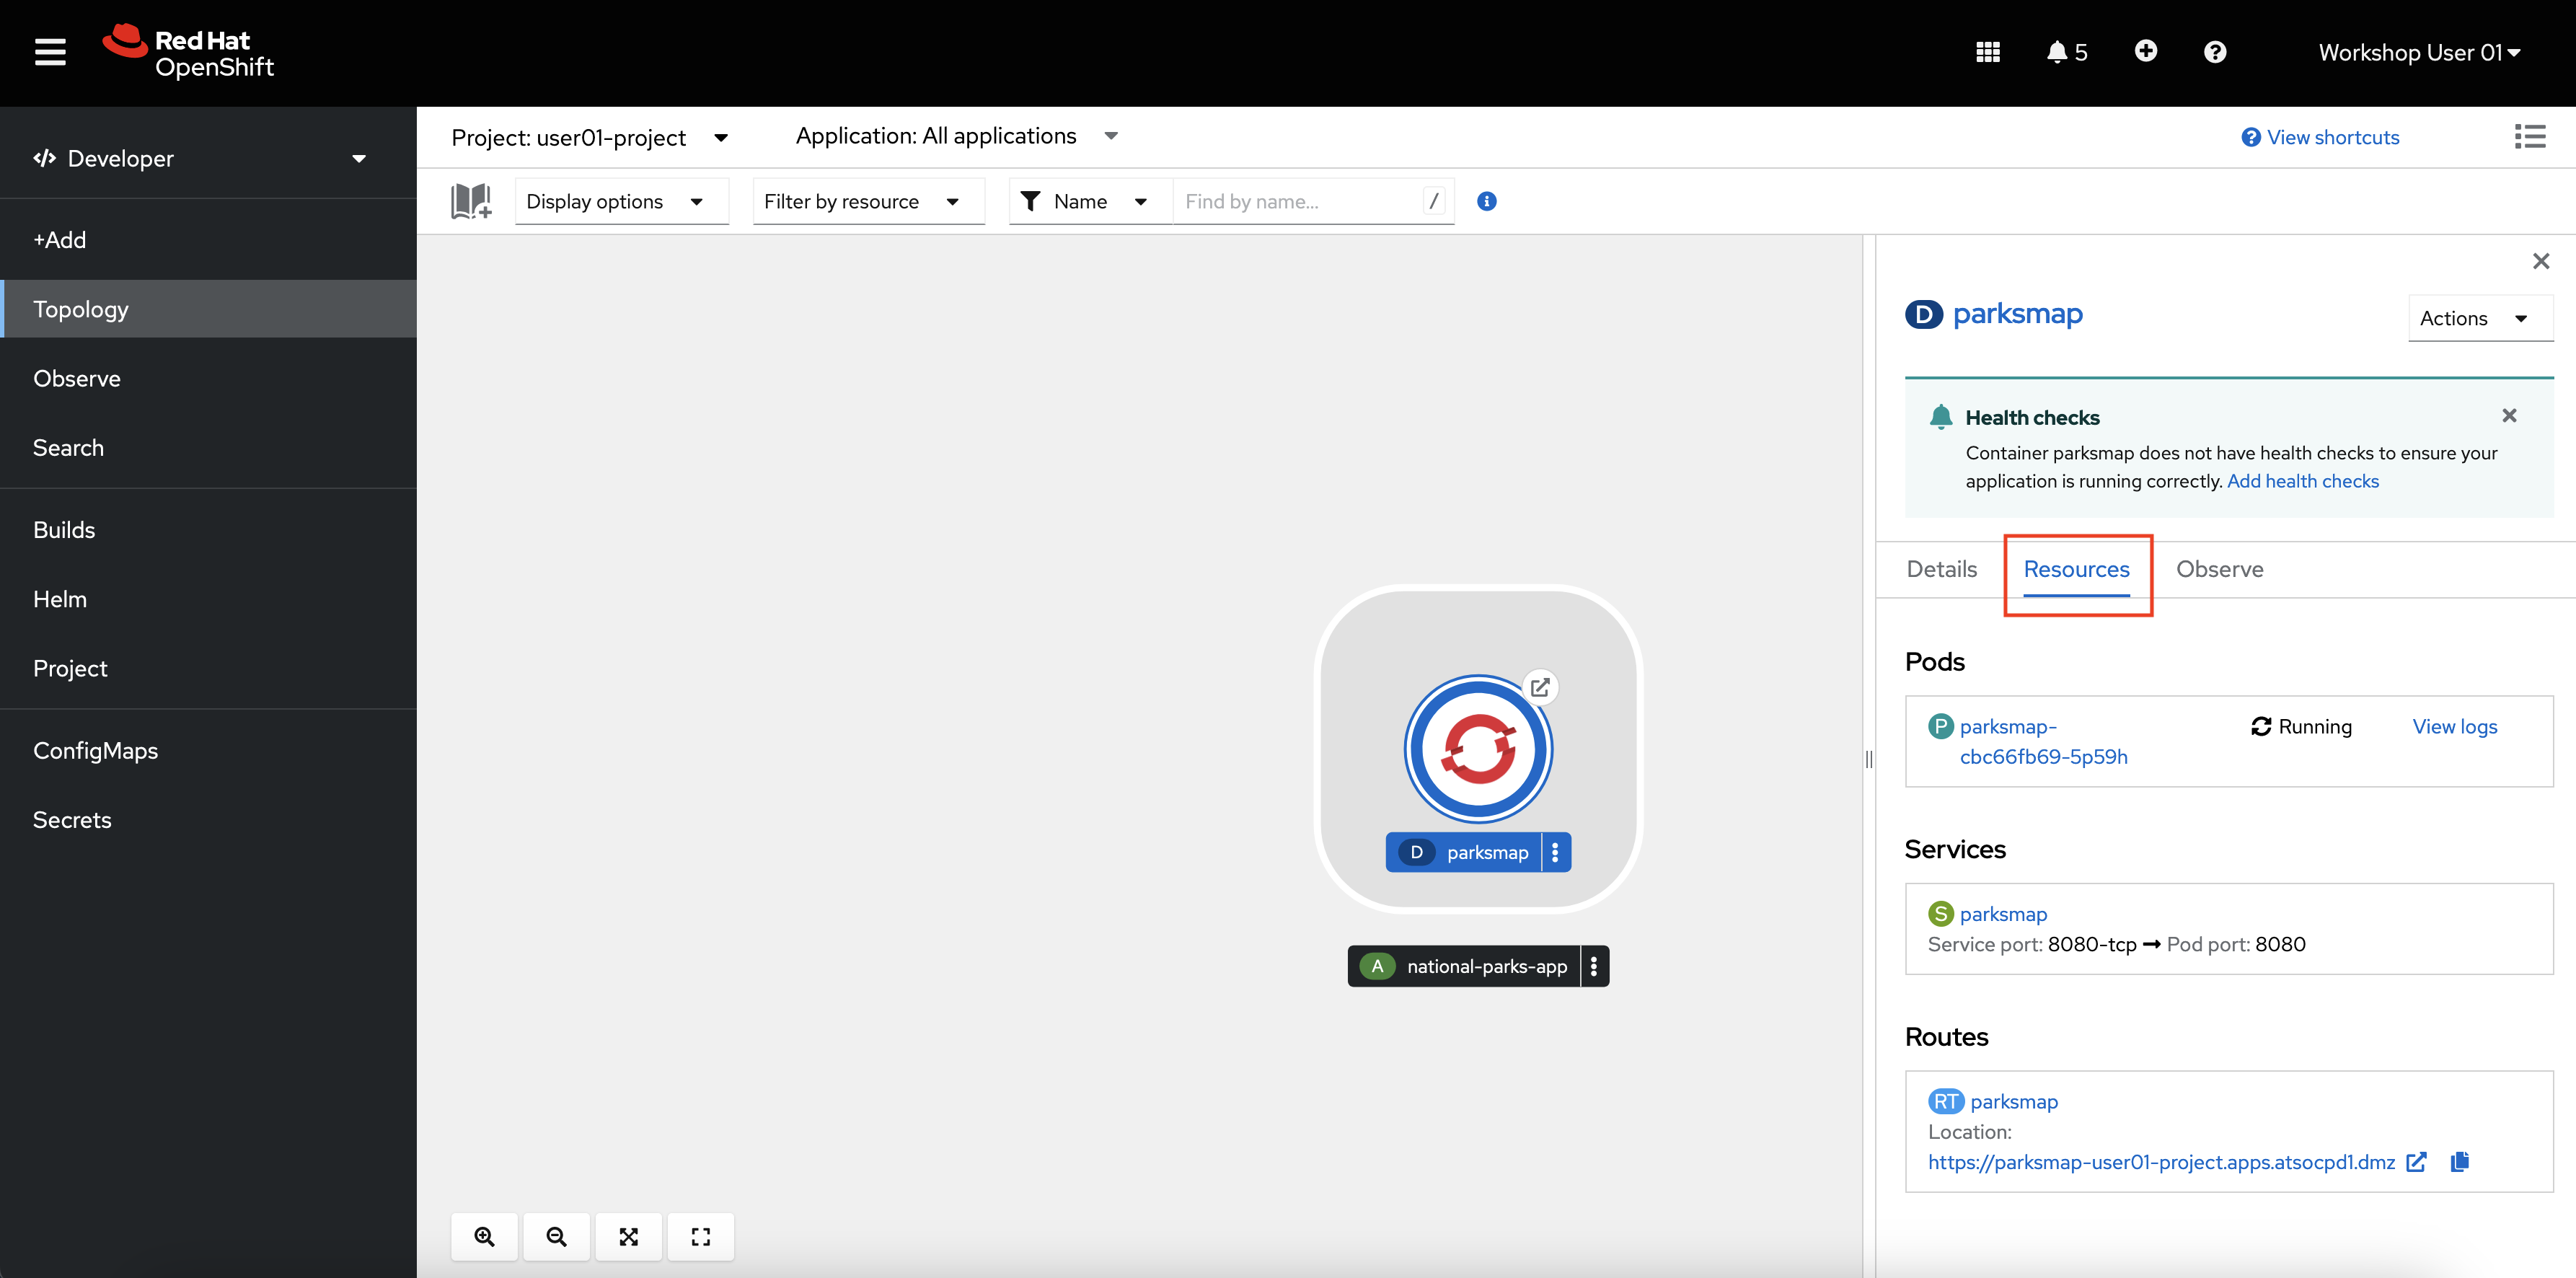
Here you can access the pod or its logs as well as the route where the application is accessible.
-
Click the Actions dropdown menu.
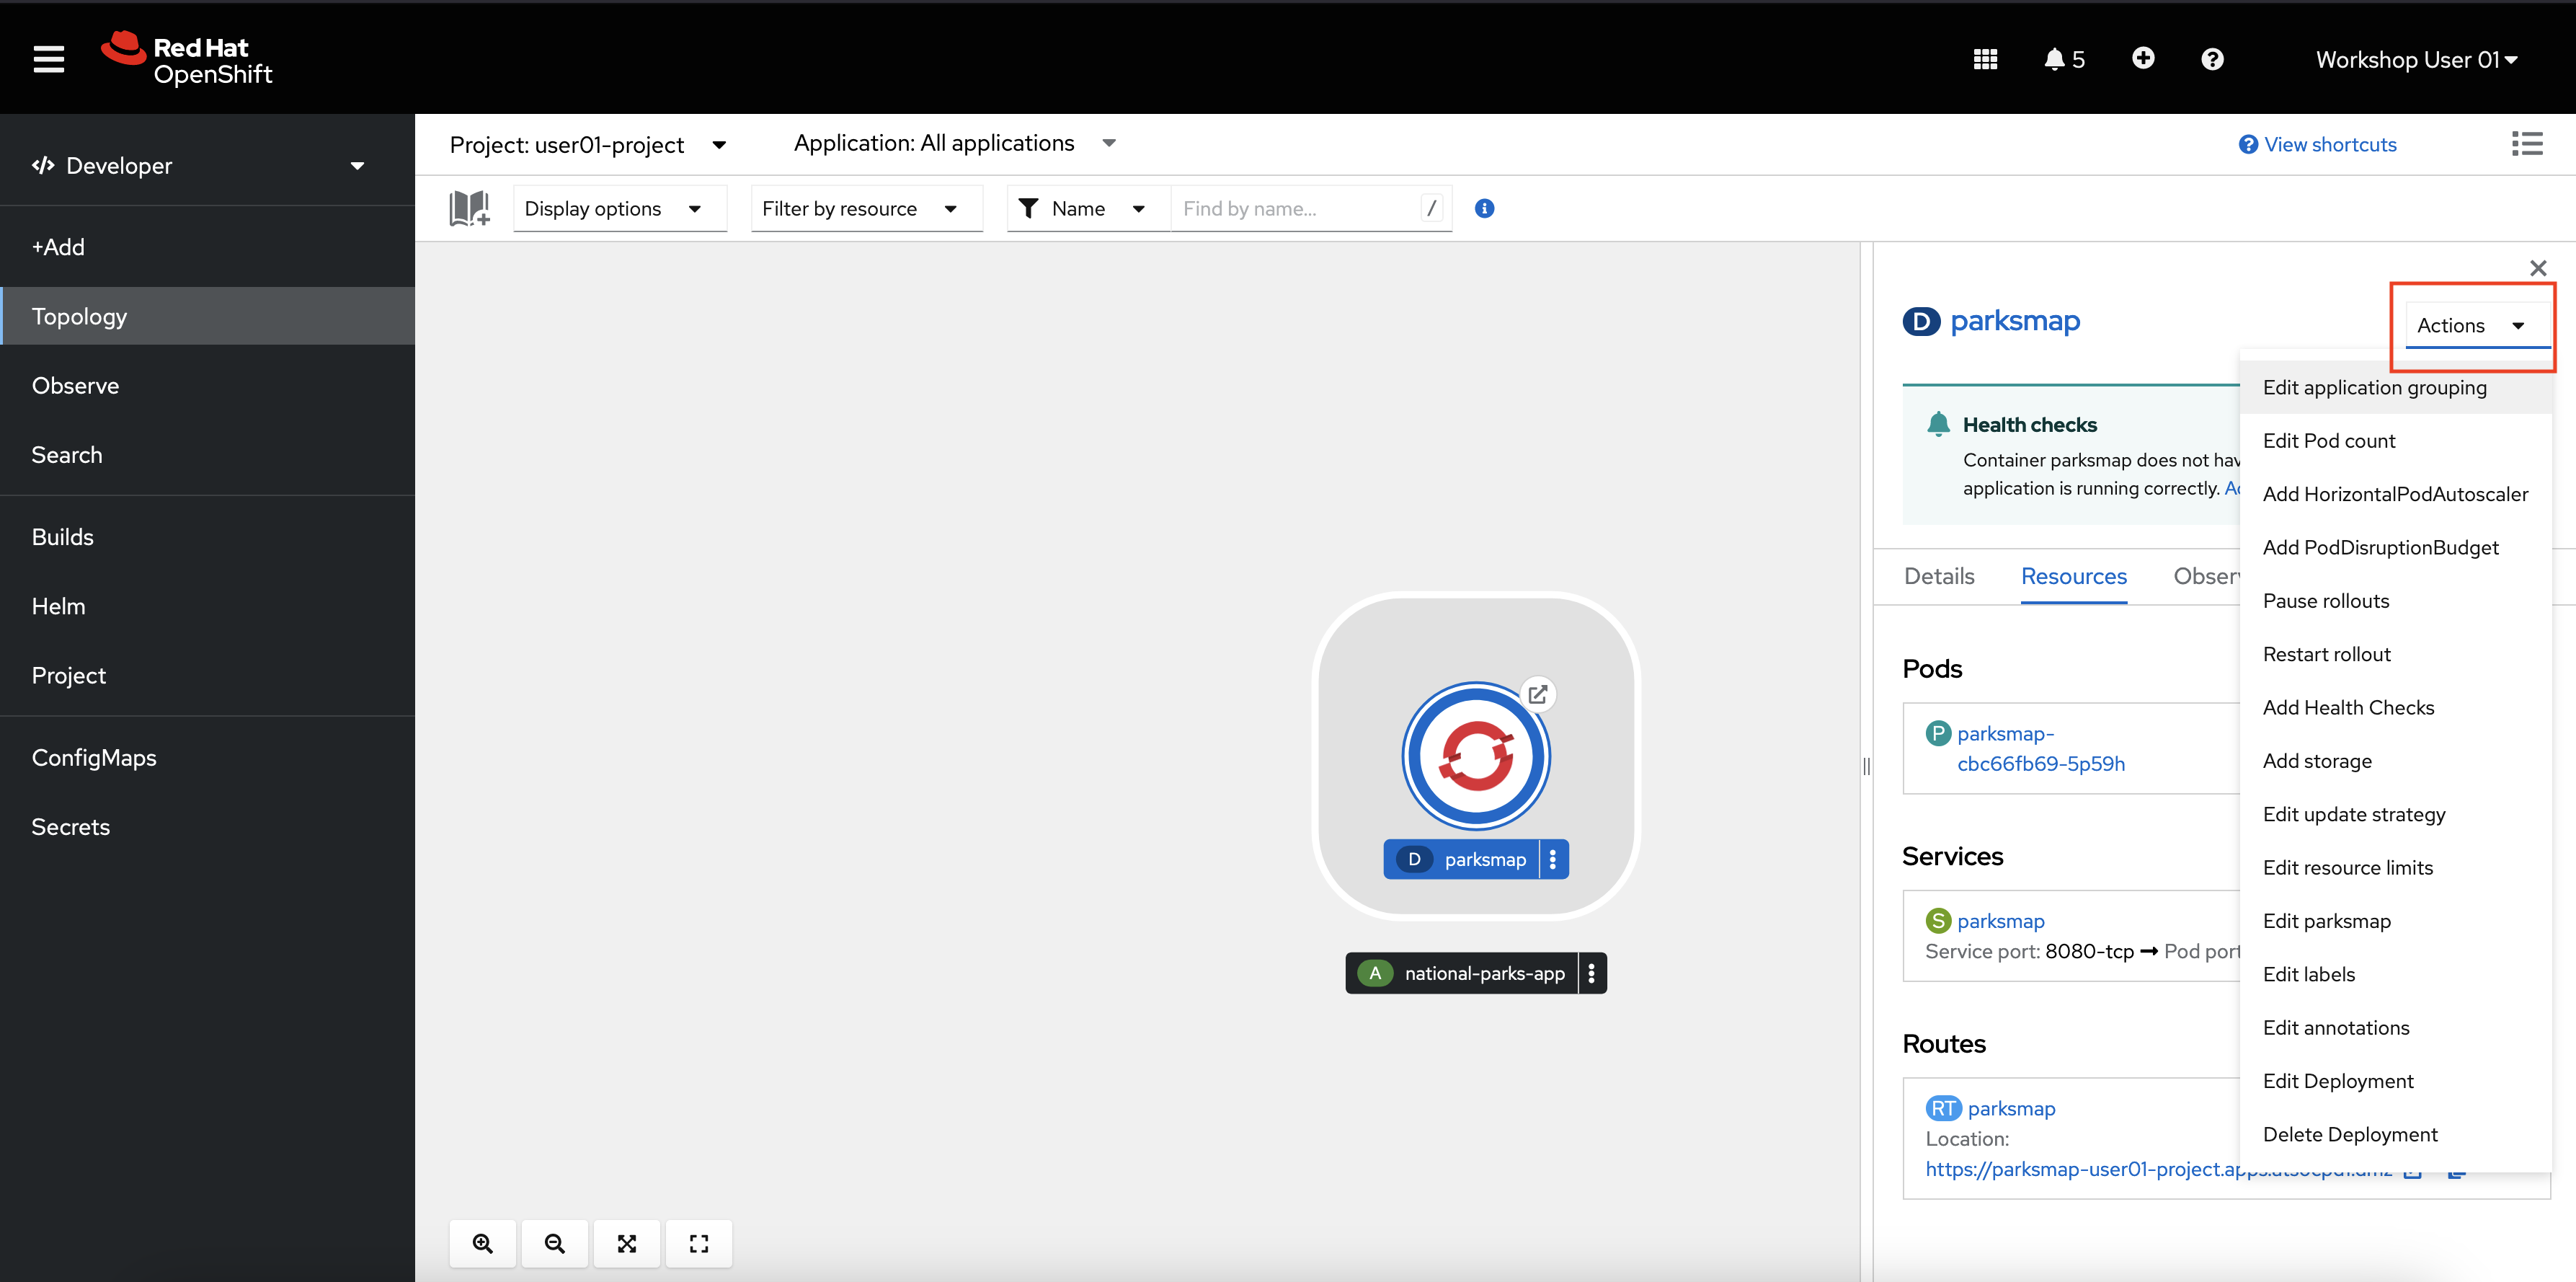
This menu provides many options for how to manage or modify your
parksmapdeployment. Most of these options can be set either at the time you deploy the application, or afterwards as in this case.


In Kubernetes, a Deployment object defines how an application deploys. In most cases, users use Pod, Service, ReplicaSets, and Deployment resources together. As in the previous section, OpenShift Container Platform creates each of these dependent resources for you, rather than you having to configure each one manually.
When you deployed the national-parks-frontend image, a deployment resource was created with only one pod deployed. However, in most cases, users will want to scale their application to have multiple copies running at the same time. This is one of the core features of Kubernetes and OpenShift that build a more highly available application by creating multiple copies of it across different physical or virtual hosts.
-
On the details tab for the
parksmapdeployment, click the up arrow next to the blue circle that says1 pod.
This scales your application from one pod to two pods.

This is a simple demonstration of horizontal scaling with Kubernetes. You now have two instances of your pod running in the OpenShift cluster. Traffic to the
parksmapapplication will now be distributed to each pod, and if for some reason a pod is lost, that traffic will be redistributed to the remaining pods until a Kubernetes starts another. If a whole compute node is lost, Kubernetes will move the pods to different compute nodes.OpenShift and Kubernetes also support horizontal autoscaling of pods based on CPU or memory consumption, but that is outside the scope of this lab.
Now that you are more familiar with the OpenShift web console, the next section will introduce you to the OpenShift command line interface (CLI) oc. You will use the oc CLI to deploy a backend python application to serve data to the frontend parksmap as well as to deploy a containerized MongoDB application.
The oc CLI is an incredibly powerful tool to manage OpenShift clusters and applications. It is capable of performing any task you can do in the web console, and some tasks are only possible to do with oc.
oc is ideal in situations where you:
- Work directly with project source code.
- Script OpenShift Container Platform operations.
- Are restricted by bandwidth resources and cannot use the web console.
Furthermore, many people familiar with Linux and/or Kubernetes tend to find the oc command line an easier and more efficient method of performing tasks, rather than the web-based console.
Like with the OpenShift web console, the OpenShift command line includes functions both for developers and for administrators.
For those who are familiar with Kubernetes and its kubectl CLI tool, the oc tool is essentially analogous but with additional features.
The frontend application, parksmap, needs a backend. In this section, you will deploy a python application named nationalparks. This application performs 2D geo-spatial queries against a MongoDB database to locate and return map coordinates of all national parks in North America.
NOTE for those in the WSC hands-on lab session, you must complete the following steps from within the WSC linux guest. Refer to the access.md page. If you try to connect directly from the Windows virtual machine terminal, the command will result in an error.
-
From the OpenShift web console, click your username in the top right corner (i.e.
Workshop User NN) and selectCopy login command.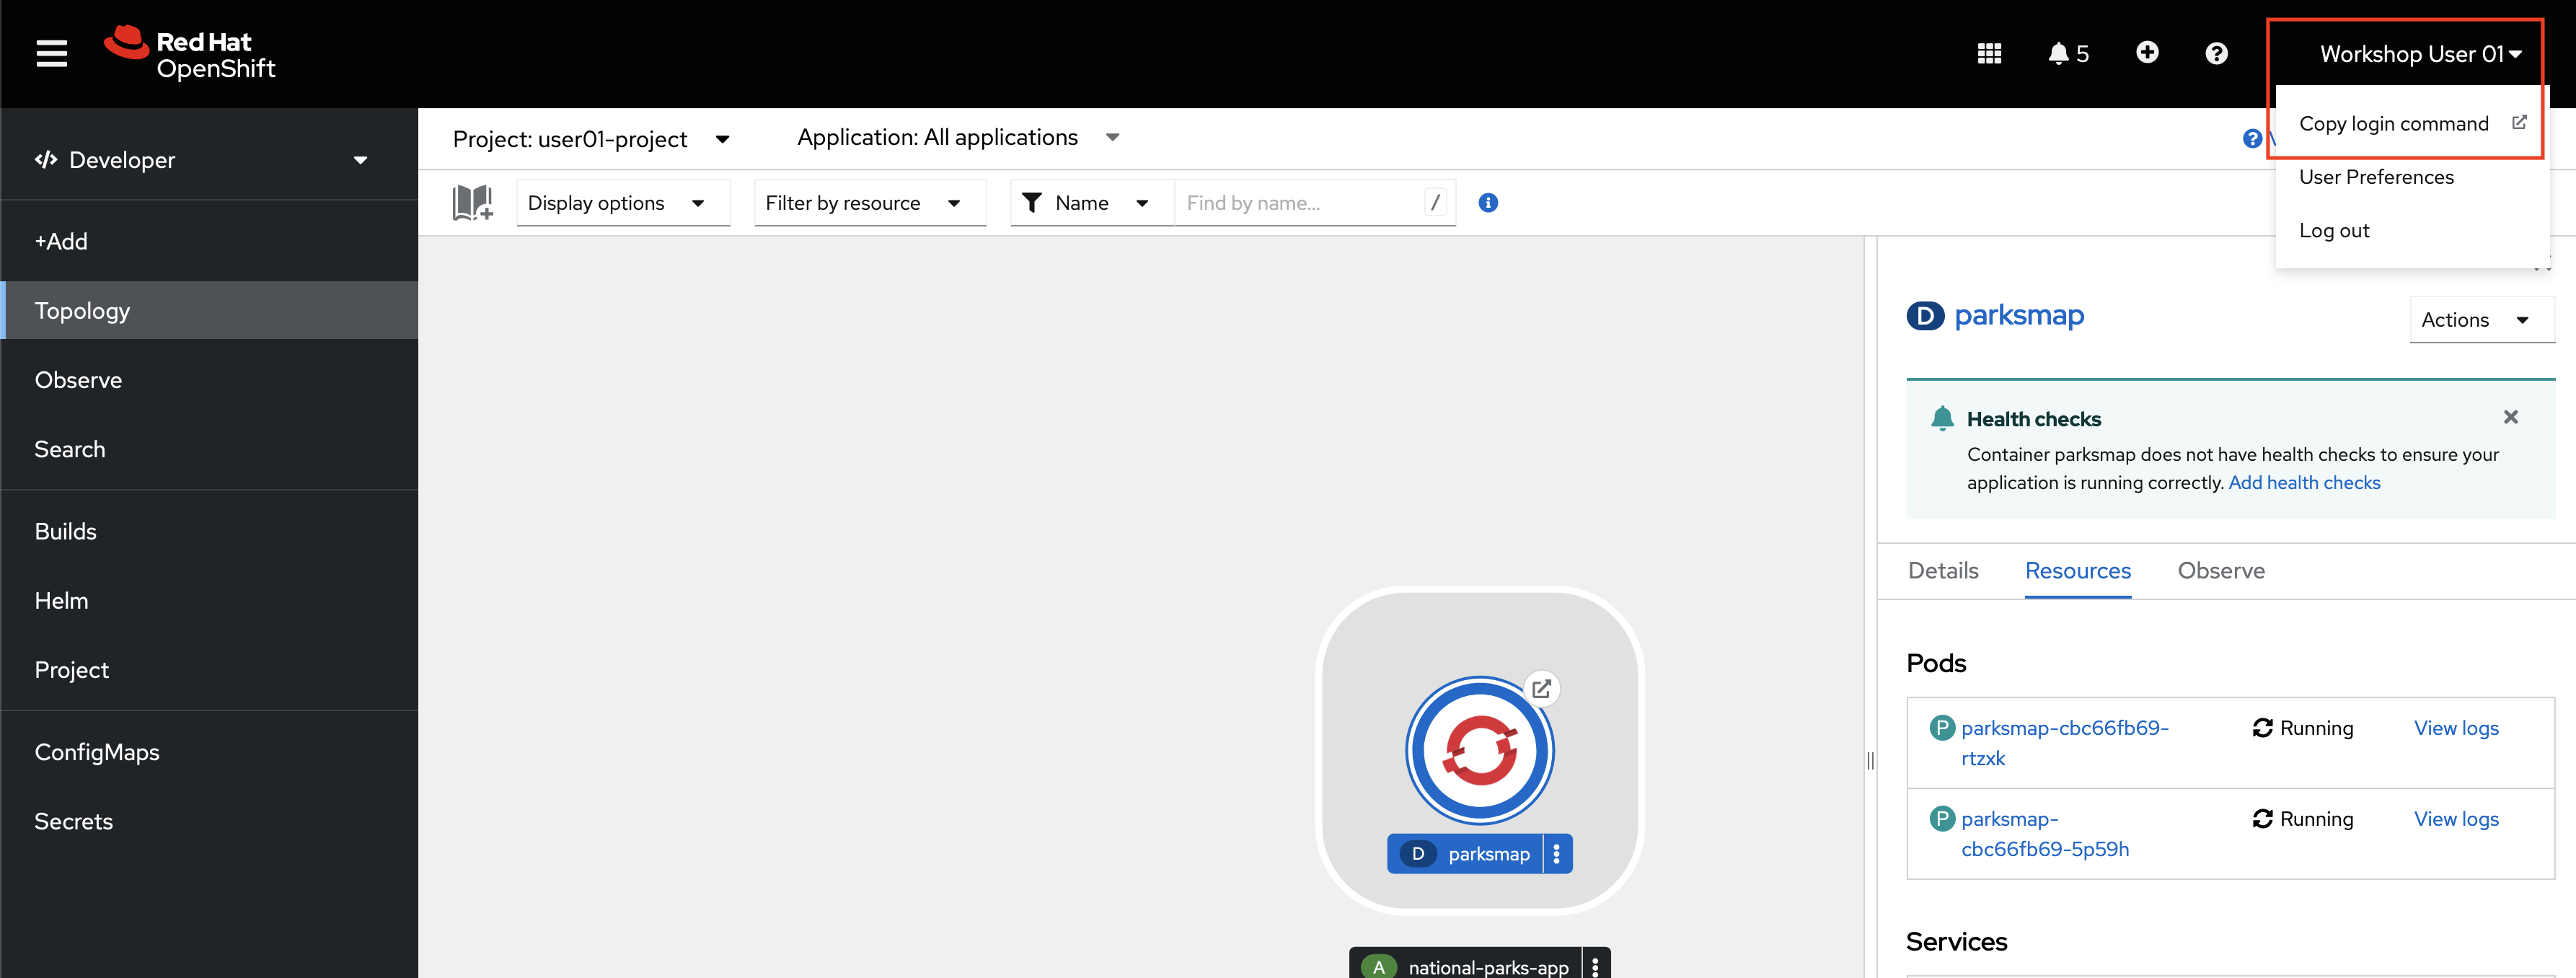
-
Log in with your OpenShift credentials and click the Display Token hyperlink.

NOTE if the copied command fails, try adding the following flag to the end of the oc login command:
--insecure-skip-tls-verify
-
Copy the line that begins with
oc login, paste it into a terminal session, and execute the command.Sample output:
$ oc login --token=uL3fHEPSGH3io0kljsgRfAMAPIIY44BhwnGxCMA3dei4 --server=https://api.example.com:6443
Logged into "https://api.example.com:6443" as "user01" using the token provided.

You have access to 161 projects, the list has been suppressed. You can list all projects with 'oc projects'

Using project "user01-project".
You are now logged into the cluster via the
ocCLI, and you are told which project you are using.If you’re in a project other than your own
userNN-project, use the following command to move into it:oc project userNN-project, whereNNis your user number.
-
In your terminal, test out the
ocCLI.oc --helpSample output:
user01@lab061:~$ oc --help
OpenShift Client

This client helps you develop, build, deploy, and run your applications on any
OpenShift or Kubernetes cluster. It also includes the administrative
commands for managing a cluster under the 'adm' subcommand.

Usage:
oc [flags]

Basic Commands:
login           Log in to a server
new-project     Request a new project
new-app         Create a new application
status          Show an overview of the current project
project         Switch to another project
projects        Display existing projects
explain         Documentation of resources

Build and Deploy Commands:
rollout         Manage a Kubernetes deployment or OpenShift deployment config
rollback        Revert part of an application back to a previous deployment
new-build       Create a new build configuration
start-build     Start a new build
The
--helpflag will display all of the available options the oc CLI. -
Enter the following command
oc new-app --helpSample output:
user01@lab061:~$ oc new-app --help
Create a new application by specifying source code, templates, and/or images

This command will try to build up the components of an application using images, templates, or code
that has a public repository. It will lookup the images on the local Docker installation (if
available), a container image registry, an integrated image stream, or stored templates.

If you specify a source code URL, it will set up a build that takes your source code and converts
it into an image that can run inside of a pod. Local source must be in a git repository that has a
remote repository that the server can see. The images will be deployed via a deployment
configuration, and a service will be connected to the first public port of the app. You may either
specify components using the various existing flags or let new-app autodetect what kind of
components you have provided.

If you provide source code, a new build will be automatically triggered. You can use 'oc status' to
check the progress.

Usage:
oc new-app (IMAGE | IMAGESTREAM | TEMPLATE | PATH | URL ...) [flags]

Examples:
# List all local templates and image streams that can be used to create an app
oc new-app --list

# Create an application based on the source code in the current git repository (with a public
remote) and a Docker image
oc new-app . --docker-image=repo/langimage
The
--helpflag now displays all of the available options for the oc new-app command. If you get confused about any of the commands we use in this workshop, or just want more information, using this flag is a good first step.
oc new-app is a powerful and commonly used command in the OpenShift CLI. It has the ability to deploy applications from components that include:
- Source or binary code
- Container images
- Templates
The set of objects created by oc new-app depends on the artifacts passed as an input.
The frontend application, parksmap, needs a backend. In this section, you will deploy a python application named nationalparks. This application performs 2D geo-spatial queries against a MongoDB database to locate and return map coordinates of all national parks in North America.
-
Deploy the python backend with the following
oc new-appcommand.oc new-app python~https://github.com/mmondics/national-parks --context-dir source/nationalparks-py --name nationalparks -l 'app=national-parks-app,component=nationalparks,role=backend,app.kubernetes.io/part-of=national-parks-app,app.kubernetes.io/name=python'A few things to notice about this command:
- The
oc new-appcommand is not being run against a specific container image. It is being run against python source code that exists in GitHub here. Although a Dockerfile exists in the directory, it is not being used due to thepyhon~option in the command. OpenShift is using its source-to-image capability to create its own Dockerfile and containerize the application from its source code. If you wanted to, you could have omitted thepython~option and OpenShift would use the Dockerfile in the directory. --nameflag provides the name for the python Deployment-lsets the following key=value pairs as labels on the deployment
The output from the
oc new-appcommand tells you what all was created - an imagestream, buildconfig, deployment, and service.The buildconfig is the configuration file that will be used to build the
nationalparkscontainer image. This build will automatically begin, and you can check its logs to watch the process. - The
-
Check the
nationalparksbuild log.oc logs build/nationalparks-1 -fThe
-fflag lets you follow the build logs (similar to Linux's 'tail' command). Once you seePush successfulat the end of the build logs, your new container image has been built and pushed into OpenShift's internal registry. It will then automatically be deployed in a pod. -
Check that the
nationalparkspod is running and ready.oc get podsSample output:
➜  ~ oc get pods
NAME                             READY   STATUS      RESTARTS   AGE
nationalparks-1-build            0/1     Completed   0          5m19s
nationalparks-64d57bb8f8-4582b   1/1     Running     0          4m6s
parksmap-cbc66fb69-d29rn         1/1     Running     0          3m25s
parksmap-cbc66fb69-dmnf7         1/1     Running     0          3m24s
Once the
nationalparkspod isRunningand has1/1containers ready, the application is successfully deployed. However, the backend python application is only accessible from within the OCP cluster. It is not exposed to the outside world, as you may have noticed from the output of theoc new-appcommand:Application is not exposed. You can expose services to the outside world by executing one or more of the commands below: -
Create a route that exposes the
nationalparksservice.oc expose service/nationalparksIt's worth understanding a little bit about what you just did. The backend application
nationalparksruns in one pod. However, you could easily scale the number of pods runningnationalparksup as much as you'd like, or you can let OpenShift automatically scale out the number of pods (based on CPU or memory consumption) with a HorizontalPodAutoscaler. Each pod will be assigned its own individual IP address, and furthermore, if and when the pods regenerate, they will get brand new IP addresses. For these reasons, you cannot rely on the application's IP address in order to use it, like you would with many non-containerized applications.To solve this problem, Kubernetes uses services. Services are load balancers internal to the cluster that distribute requests among the application pods using label matching. If you want to access an application, you need to access the service that will then direct the request to one of the pods.
However, services are internal to the cluster. They allow pods to communicate with other pods inside the cluster, but not with the outside world. For external access, we need to introduce another object - routes.
Routes are OpenShift objects - they do not exist in upstream Kubernetes. Routes expose services as publicly-accessible addresses for users and applications to interact with. When you access an OpenShift appliction in a web browser, such as the
parksmapwebpage or even the OpenShift console, you navigate to that pod's route.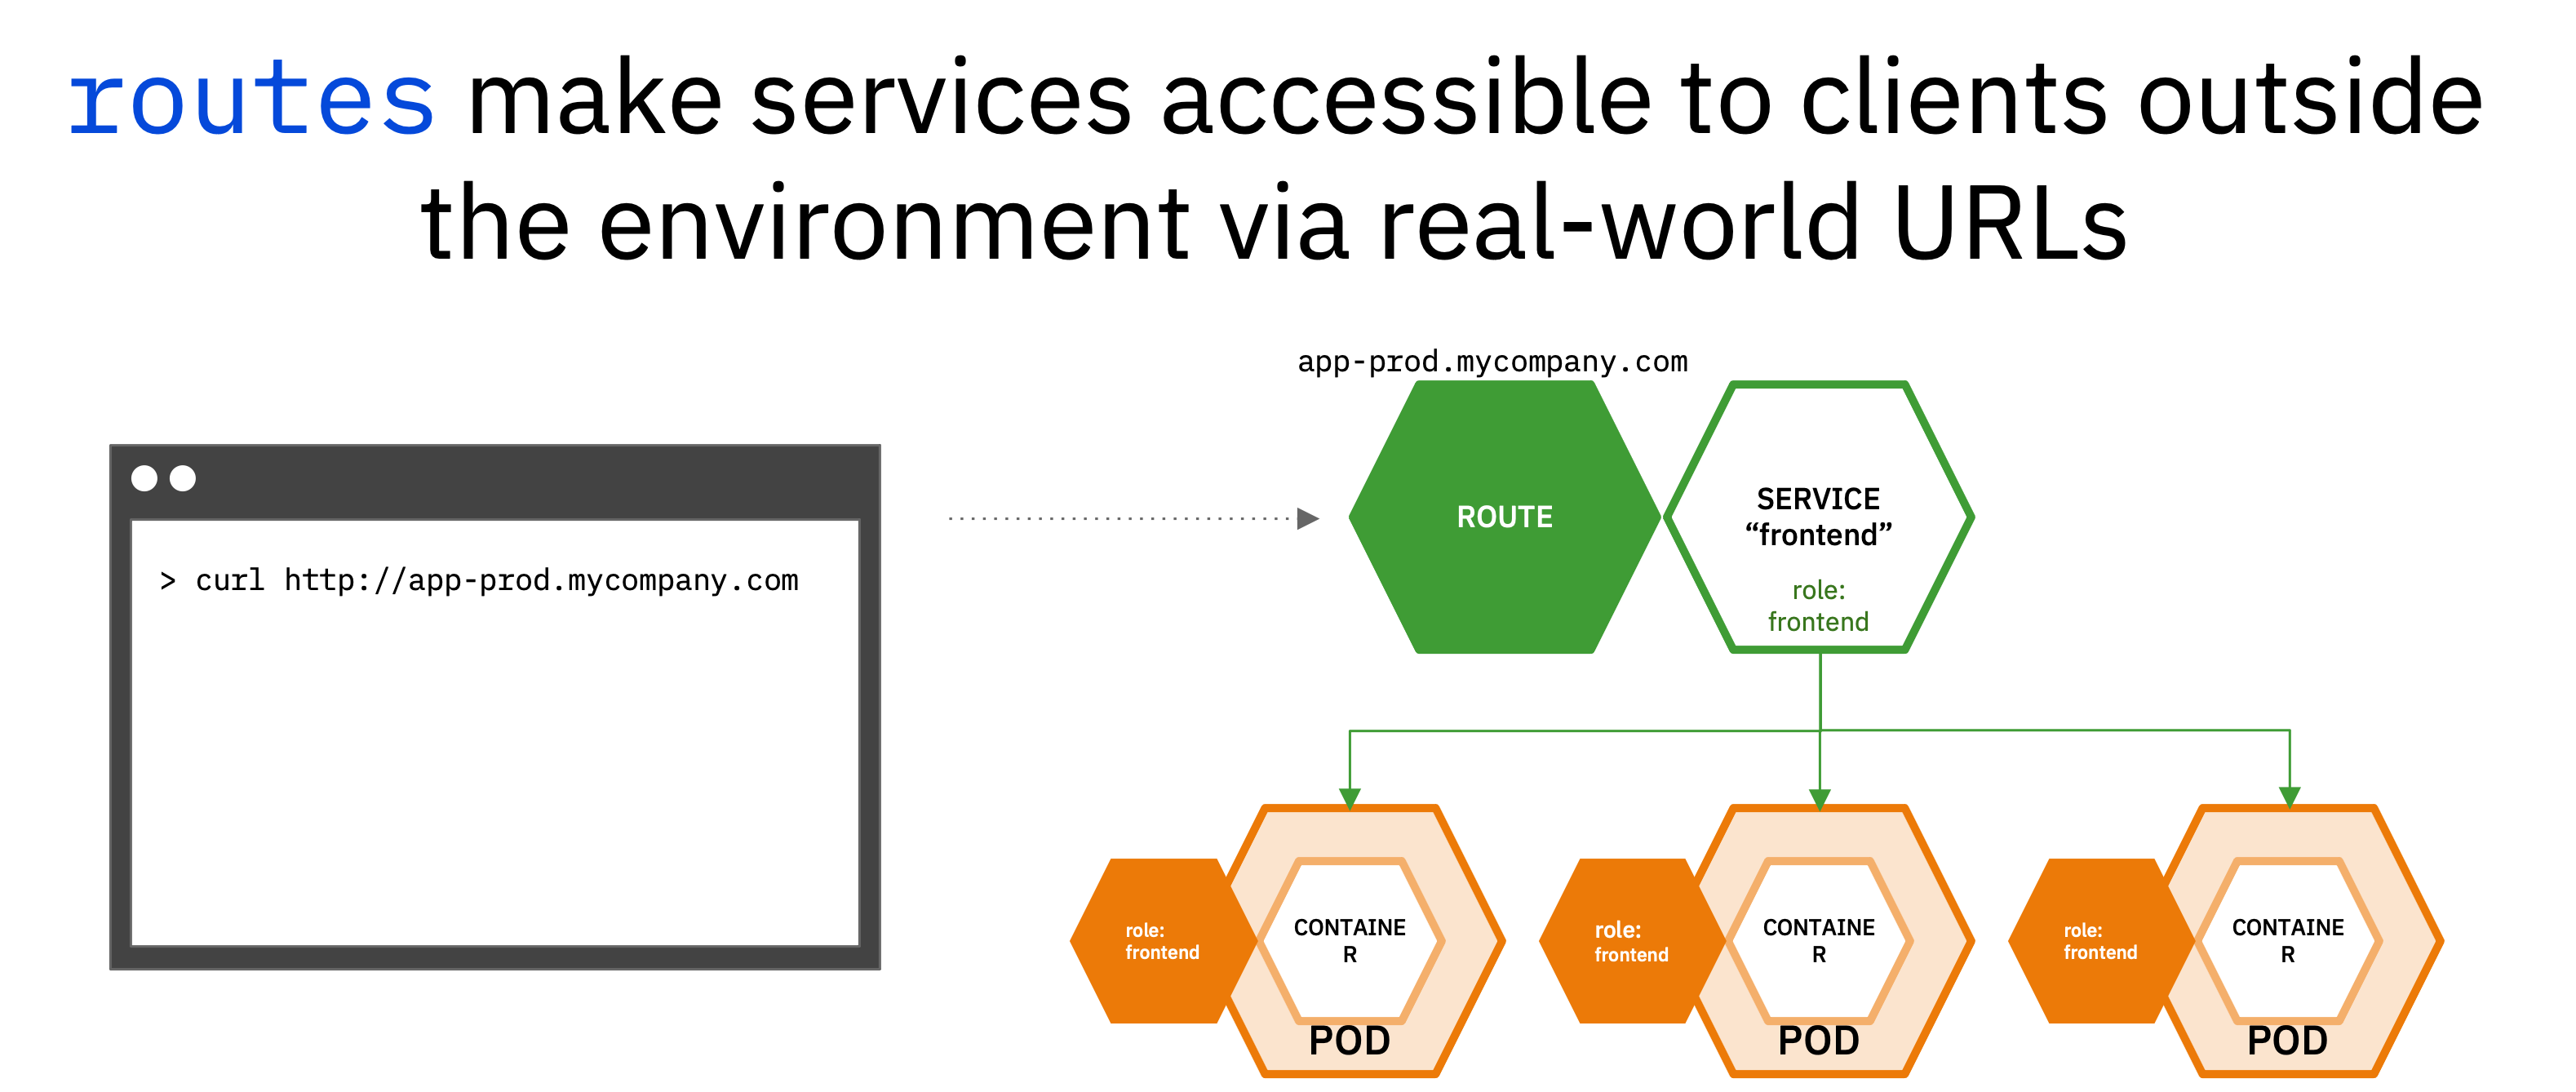
-
See the new route that was created.
oc get routeSample output:
➜ ~ oc get routes NAME HOST/PORT PATH SERVICES PORT TERMINATION WILDCARD nationalparks nationalparks-user01-project.apps.example.com nationalparks 8080-tcp None parksmap parksmap-user01-project.apps.example.com parksmap 8080-tcp edge/Redirect None -
Label the
nationalparksroute as the application backend.oc label route nationalparks type=parksmap-backend -
Navigate to the frontend
parksmaproute in a web browser. Use theparksmapHOST/PORTvalue from theoc get routescommand preceded byhttp://.For example:
http://parksmap-userNN-project.apps.example.comAlternatively, you can click the small arrow button associated with the
parksmapdeployment in the OpenShift web console topology.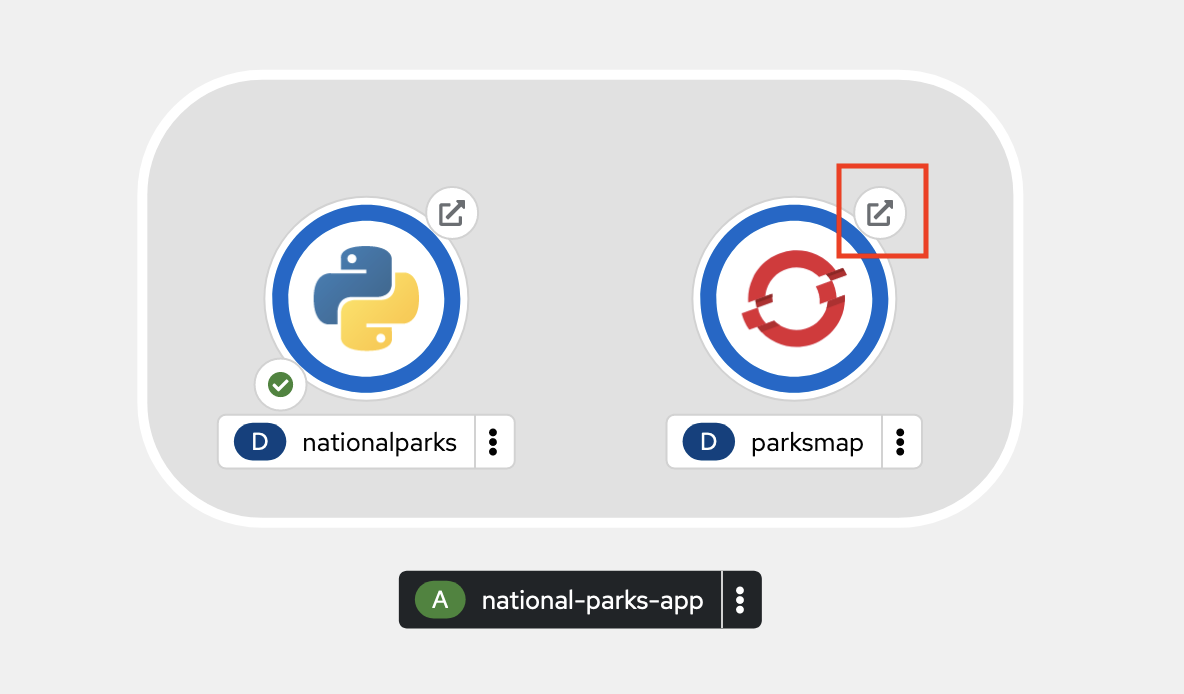
Any way that you get there, your application should display the image below:
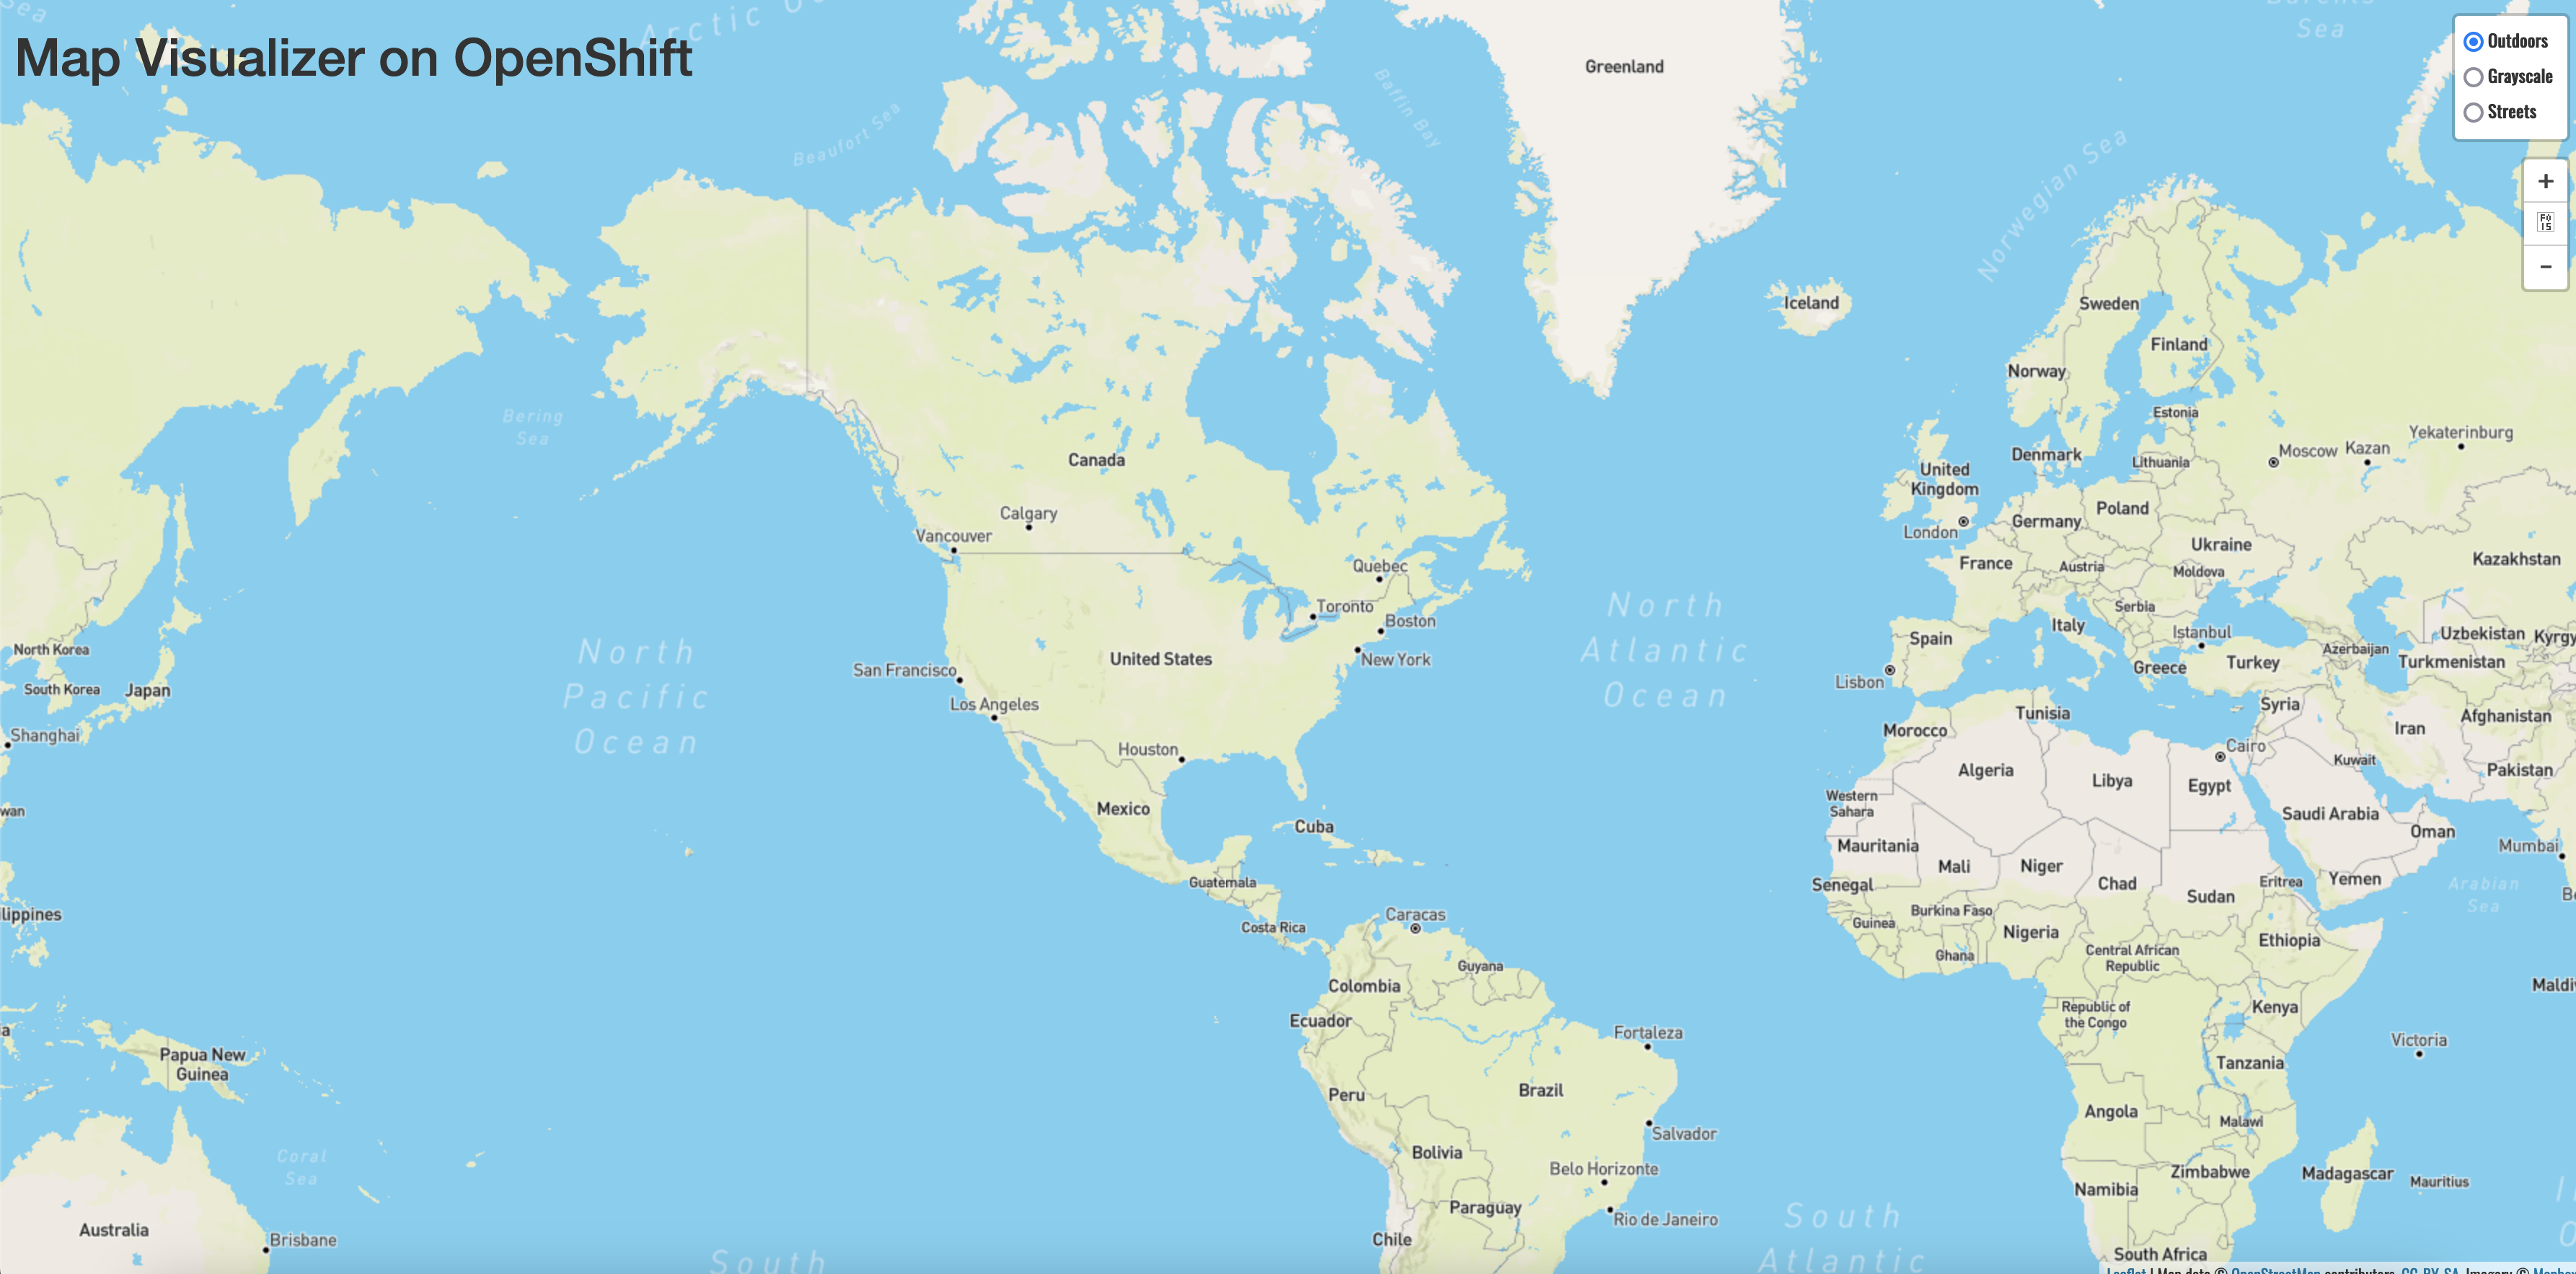
You should see a map of the world, but you will not see any icons for National Parks yet. That's because we have one more application to deploy and configure - the MongoDB database that will store all of the data about National Parks and their locations.


The MongoDB you will deploy in this section will store all information about the National Parks, their names and coordinates.
-
Deploy the MongoDB container.
oc new-app quay.io/mmondics/mongodb:latest --name mongodb-nationalparks -e MONGODB_USER=mongodb -e MONGODB_PASSWORD=mongodb -e MONGODB_DATABASE=mongodb -e MONGODB_ADMIN_PASSWORD=mongodb -l 'app.kubernetes.io/part-of=national-parks-app,app.kubernetes.io/name=mongodb'A few things to notice about this command:
- You're deploying a pre-built container image hosted at <quay.io/mmondics/mongodb>.
--namesets the name of the MongoDB deployment-esets environment variables within the resulting container. These can be used like any other environment variable when the container is running, and you can see them by connecting to the pod and running theenvcommand-lsets labels for this deployment
-
In a later step, you will be adding persistent storage to this MongoDB deployment. Mounting storage requires a certain securityContext, so in preparation, please run the following command to add the proper securityContext.
oc patch deployment mongodb-nationalparks --type='json' -p='[{"op":"add","path":"/spec/template/spec/securityContext","value":{"fsGroup":184,"runAsGroup":184,"runAsUser":184}}]'Once again, you can check
oc get podsto see when the MongoDB pod is ready.NAME READY STATUS RESTARTS AGE mongodb-nationalparks-5d8b6f99f7-4wwst 1/1 Running 0 8s nationalparks-1-build 0/1 Completed 0 58m nationalparks-67b69fc9b7-z5znq 1/1 Running 0 56m parksmap-cbc66fb69-c87k7 1/1 Running 0 39mNow, you may think that you are ready to look at your frontend application again to see the backend data. However, this MongoDB requires authentication before it can be used, so in the next section, you will provide sensitive information to the application using OpenShift secrets.
The Secret object provides a mechanism to hold sensitive information such as passwords, OpenShift Container Platform client configuration files, private source repository credentials, and so on. Secrets decouple sensitive content from the pods. You can mount secrets into containers using a volume plugin or the system can use secrets to perform actions on behalf of a pod. By default, secrets are stored unencrypted in etcd. Therefore secrets are securable by default, not secured. To safely secure secrets, you must turn on etcd encryption as well as configure proper role-based access controls to the secret objects and etcd. Read more about secrets here.
The following procedure adds the secret nationalparks-mongodb-parameters and mounts it to the nationalparks workload.
-
Create a secret holding sensitive information (usernames and passwords).
oc create secret generic nationalparks-mongodb-parameters --from-literal=DATABASE_SERVICE_NAME=mongodb-nationalparks --from-literal=MONGODB_USER=mongodb --from-literal=MONGODB_PASSWORD=mongodb --from-literal=MONGODB_DATABASE=mongodb --from-literal=MONGODB_ADMIN_PASSWORD=mongodb -
Update the environment variable to attach the
nationalparks-mongodb-parameterssecret to thenationalparksworkload.oc set env --from=secret/nationalparks-mongodb-parameters deploy/nationalparksThe
nationalparksdeployment will notice that a change has been made, and it will create a new pod with these changes applied. Check withoc get podsuntil the new pod is up and running. -
Once the
mongodb-nationalparkspod is running and ready, run the following command to load National Park data into MongoDB.Make sure that you are in your own project before running the command.
oc exec $(oc get pods -l component=nationalparks | tail -n 1 | awk '{print $1;}') -- curl -s http://localhost:8080/ws/data/loadIf you see
"Items inserted in database: 204", the data was successfully loaded. -
Finally, return to your frontend
parksmapapplication in a web browser.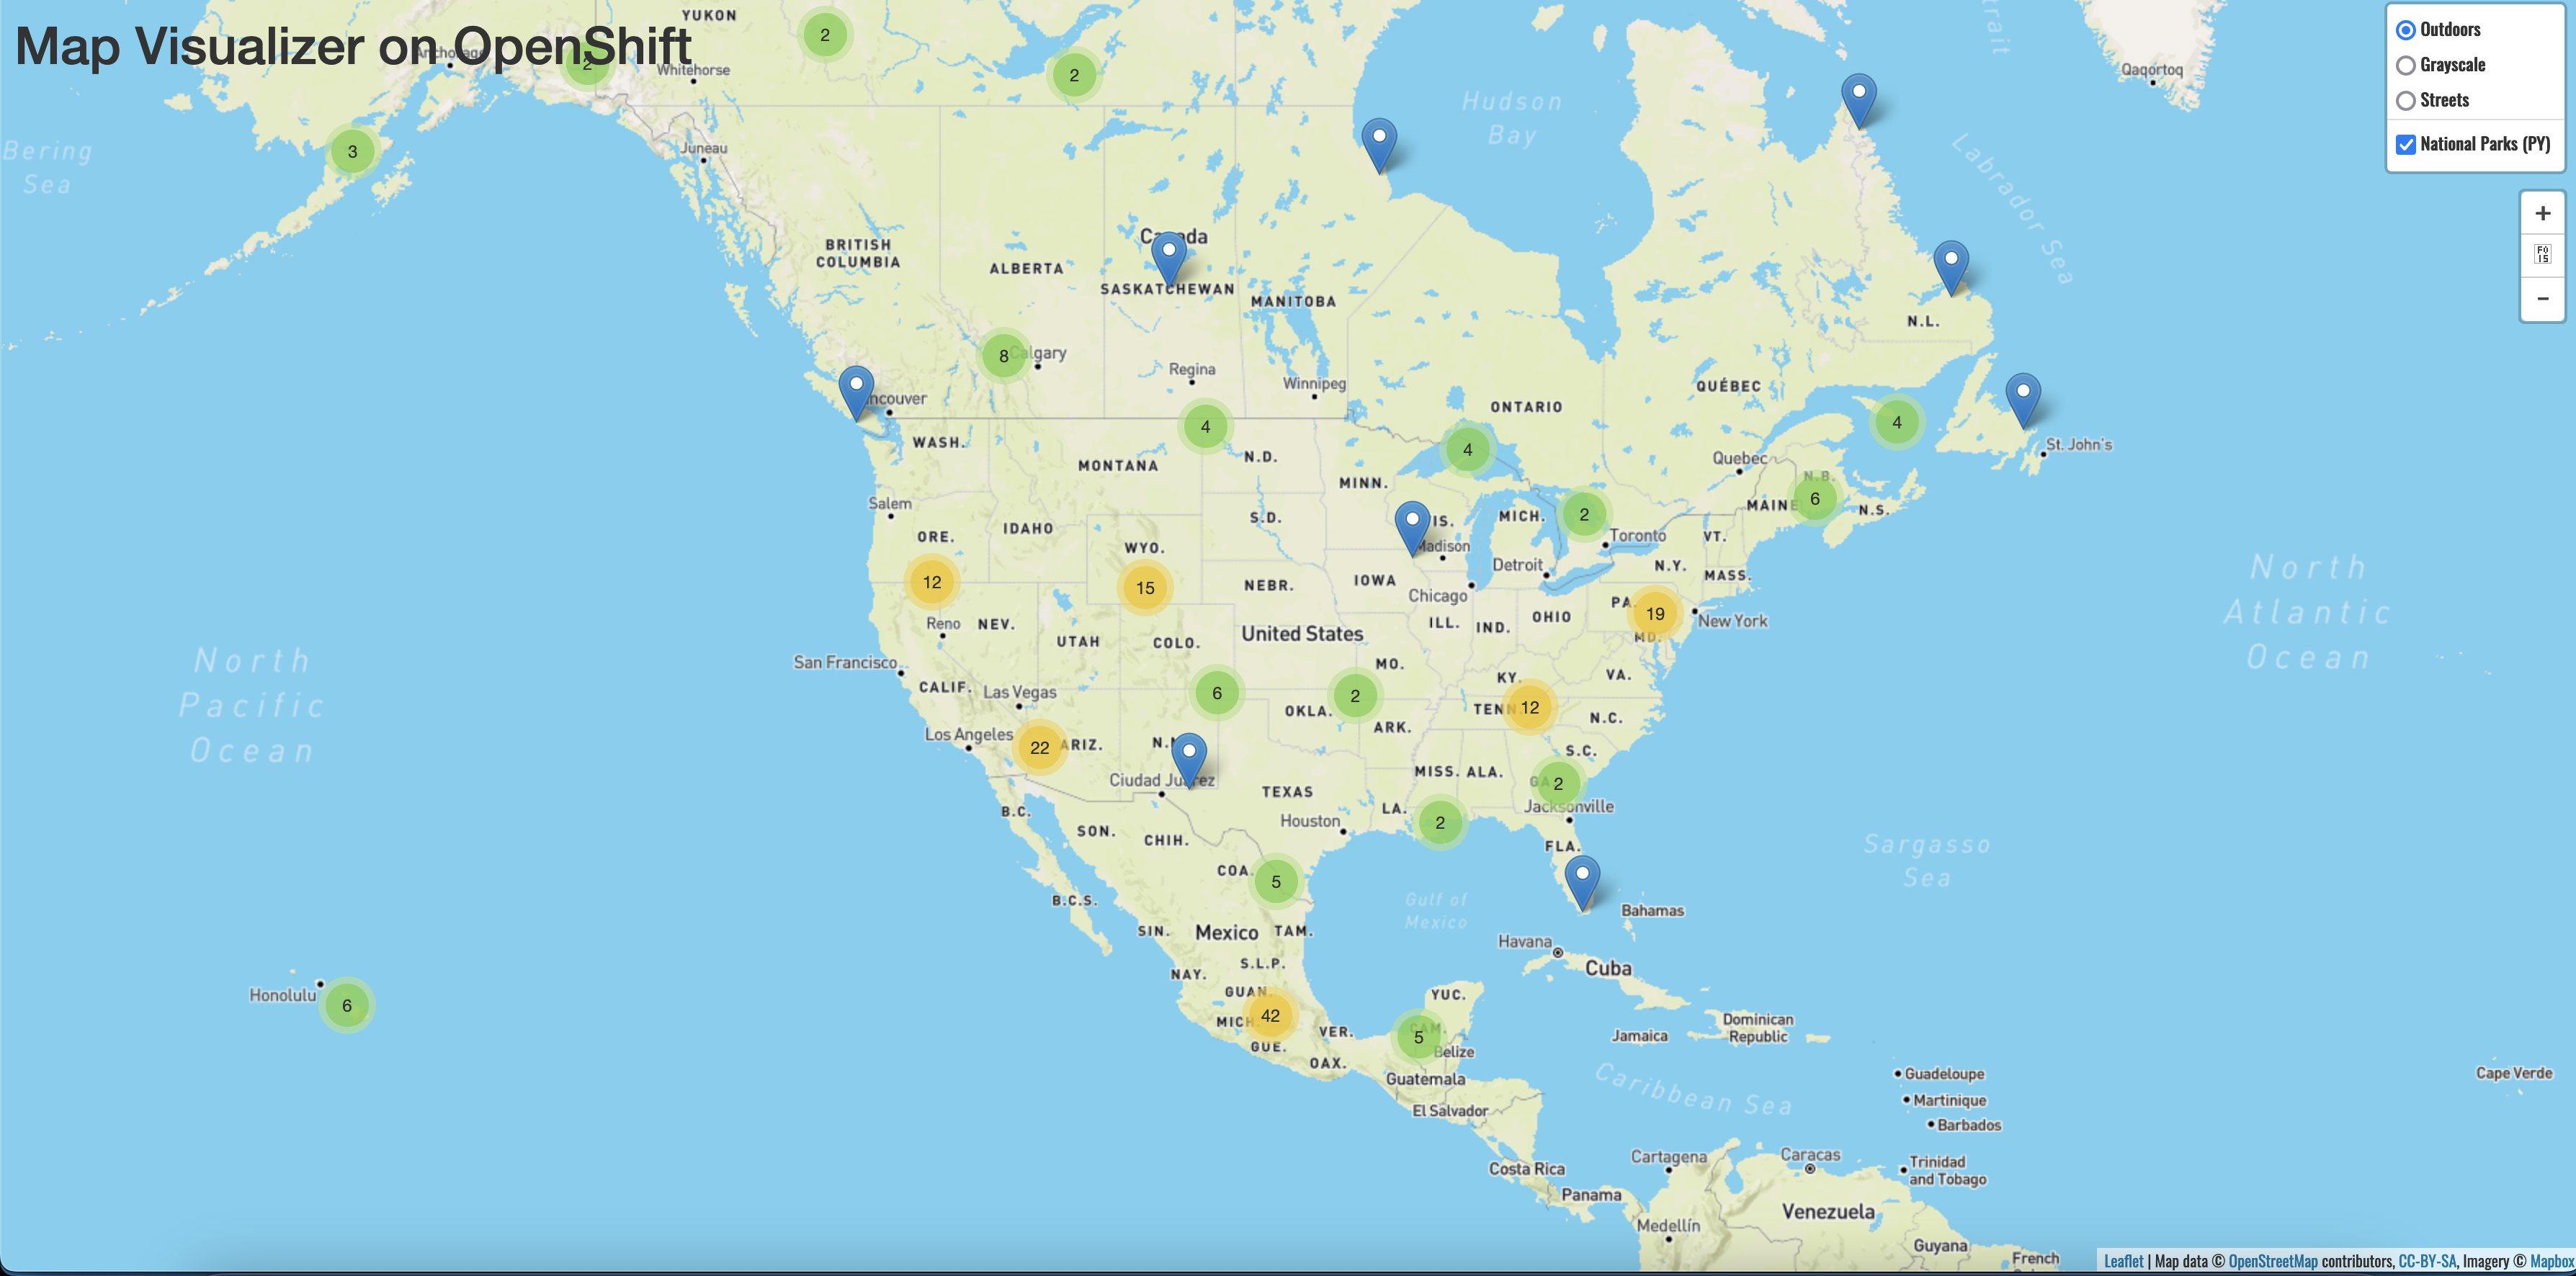

This interactive map is the culmination of all the Kubernetes and OpenShift objects that you created throughout the course of this tutorial. You can click on each icon on the map to see more details about each National Park.
Red Hat OpenShift Data Foundation is software-defined storage that is optimized for container environments. It runs as an operator on OpenShift Container Platform to provide highly integrated and simplified persistent storage management for containers.
Red Hat OpenShift Data Foundation is integrated into the latest Red Hat OpenShift Container Platform to address platform services, application portability, and persistence challenges. It provides a highly scalable backend for the next generation of cloud-native applications, built on a technology stack that includes Red Hat Ceph Storage, the Rook.io Operator, and NooBaa’s Multicloud Object Gateway technology. OpenShift Data Foundation also supports Logical Volume Manager Storage for single node OpenShift clusters.
Red Hat OpenShift Data Foundation provides a trusted, enterprise-grade application development environment that simplifies and enhances the user experience across the application lifecycle in a number of ways:
- Provides block storage for databases.
- Shared file storage for continuous integration, messaging, and data aggregation.
- Object storage for cloud-first development, archival, backup, and media storage.
- Scale applications and data exponentially.
- Attach and detach persistent data volumes at an accelerated rate.
- Stretch clusters across multiple data-centers or availability zones.
- Establish a comprehensive application container registry.
- Support the next generation of OpenShift workloads such as Data Analytics, Artificial Intelligence, Machine Learning, Deep Learning, and Internet of Things (IoT).
In this lab, you will use ODF to store the National Park locations that are inside the MongoDB database pod. By making this database persistent, the data will continue to exist even if the MongoDB pod restarts, is moved to another node, or otherwise experiences an outage.
-
In the Administrator perspective of the OpenShift console, navigate to Storage -> PersistentVolumeClaims and click the Create PersistentVolumeClaim button.
-
Fill out the form as follows:
- StorageClass:
ocs-storagecluster-cephfs - PersistentVolumeClaim name:
pvc-userNN(whereNNis your user number) - Access mode:
Shared access (RWX) - Size:
500 MiB - Volume Mode:
Filesystem
and click Create.
You now have a claim of 500MB out of the pool of filesystem storage provided by OpenShift Data Foundation.
Before adding a persistent volume to the database pod, we must first remove the ephemeral volume that currently exists.
- StorageClass:
-
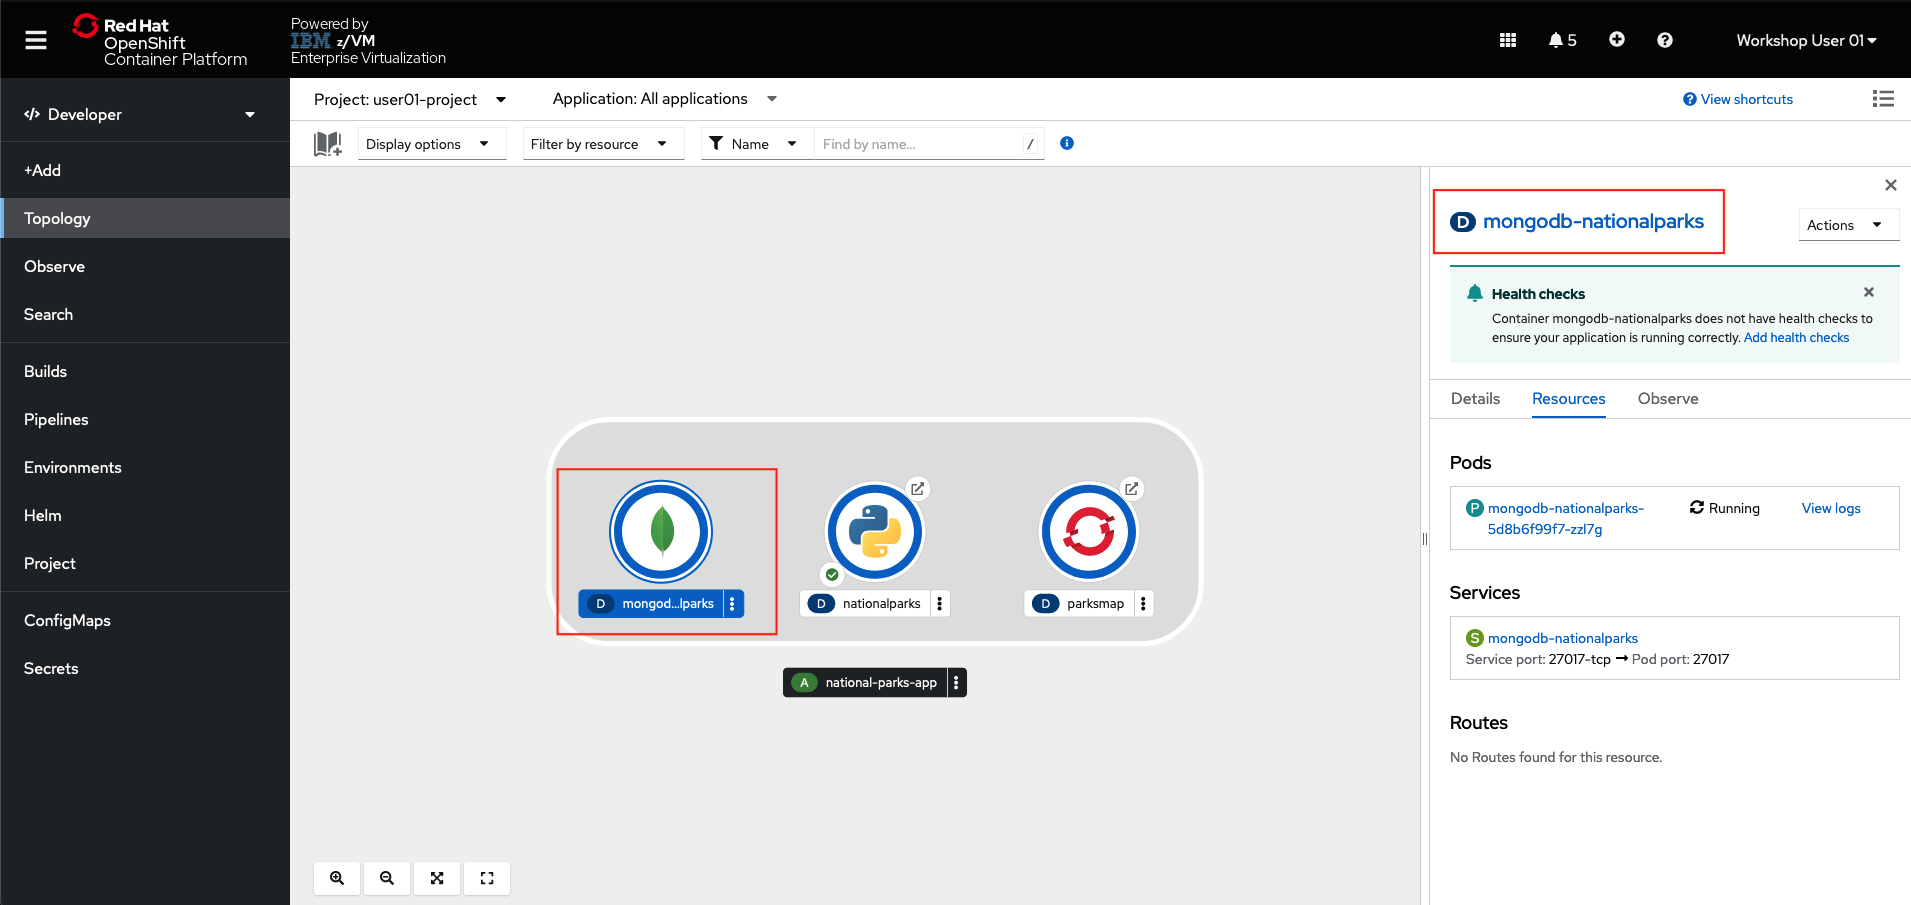
From the OpenShift developer topology page, click the icon for the MongoDB application, then the link for the deployment.
-
Scroll down to the Volumes section, and remove the single volume named
mongodb-nationalparks-volume-1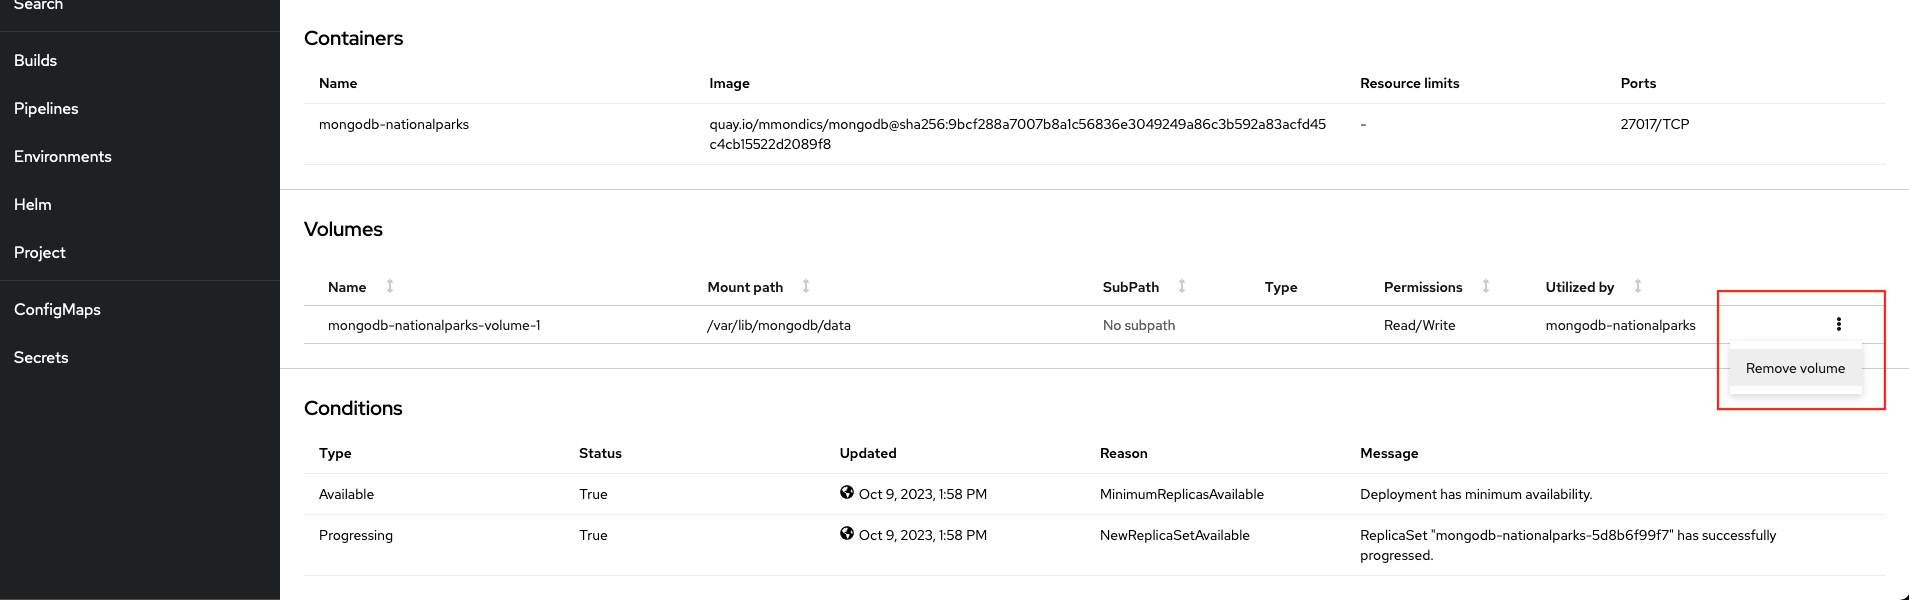
-
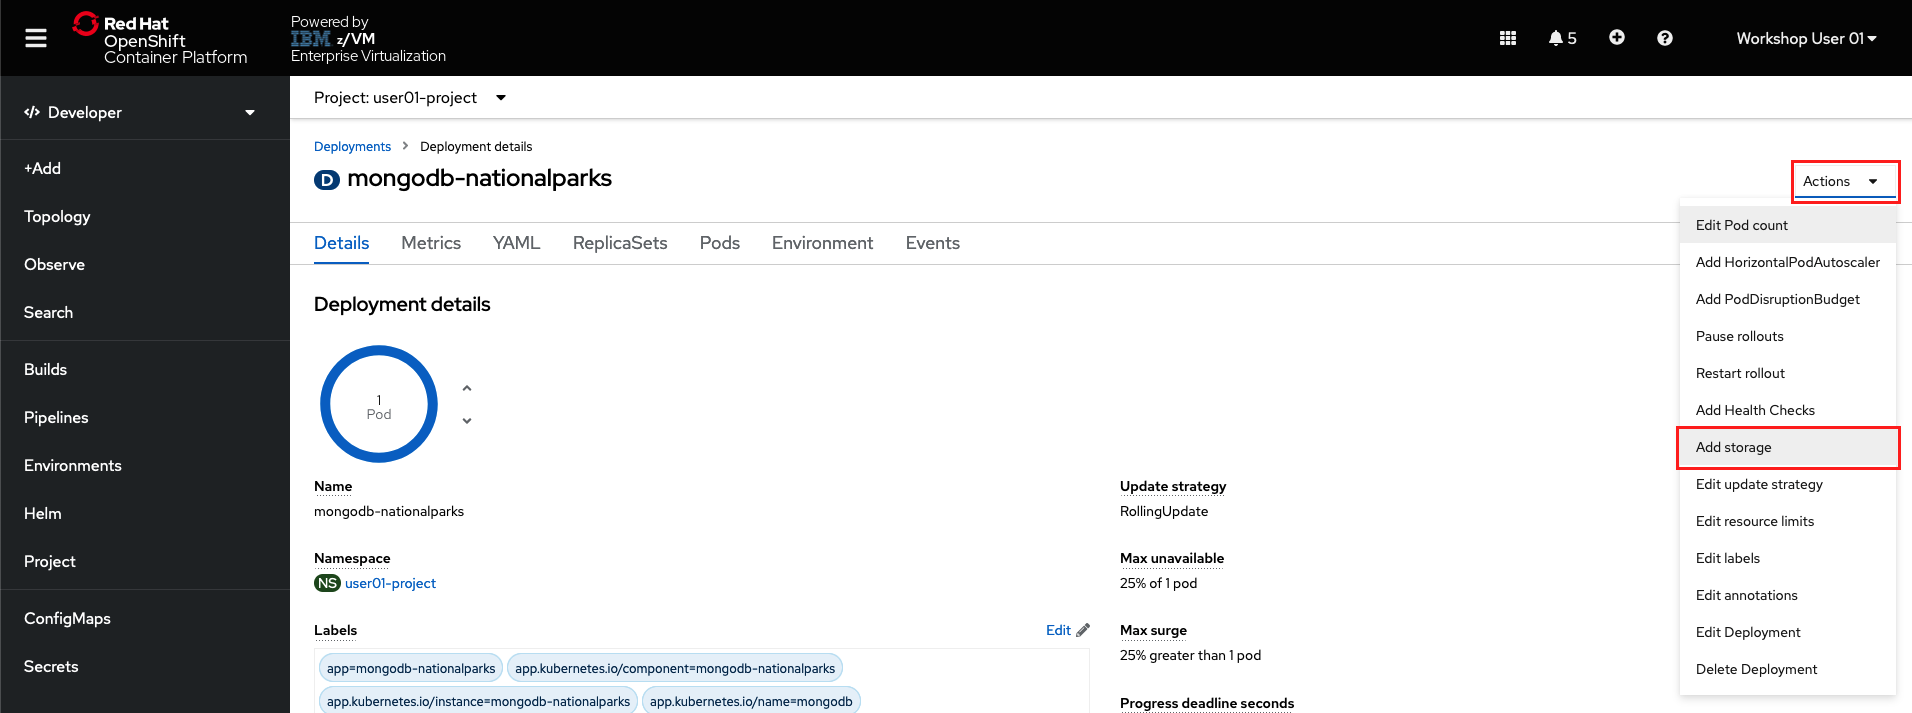
Scroll back to top of the MongoDB deployment page, click the Actions dropdown, and select Add Storage.
-
Fill the form as follows:
- Storage type:
PersistentVolumeClaim - PersistentVolumeClaim:
Use existing claim->pvc-userNN - Device Path:
/var/lib/mongodb/data
and click Save.
Your MongoDB database is now persistent and the data will continue to exist after the pod restarts or is moved.
- Storage type:
-
Load the MongoDB database again. The data was deleted when you removed the existing volume.
oc exec $(oc get pods -l component=nationalparks | tail -n 1 | awk '{print $1;}') -- curl -s http://localhost:8080/ws/data/load -
Delete your MongoDB pod so that it recycles. You can do so either via the OpenShift console, or by entering the following command in the
ocCLI:oc delete po -l deployment=mongodb-nationalparks -
Once the pod is back up and running, refresh the webpage for your National Parks application and see that all of the icons and locations of parks have persisted through the pod restart.


-
In the OpenShift Administrator perspective, navigate to Storage -> Data Foundation.
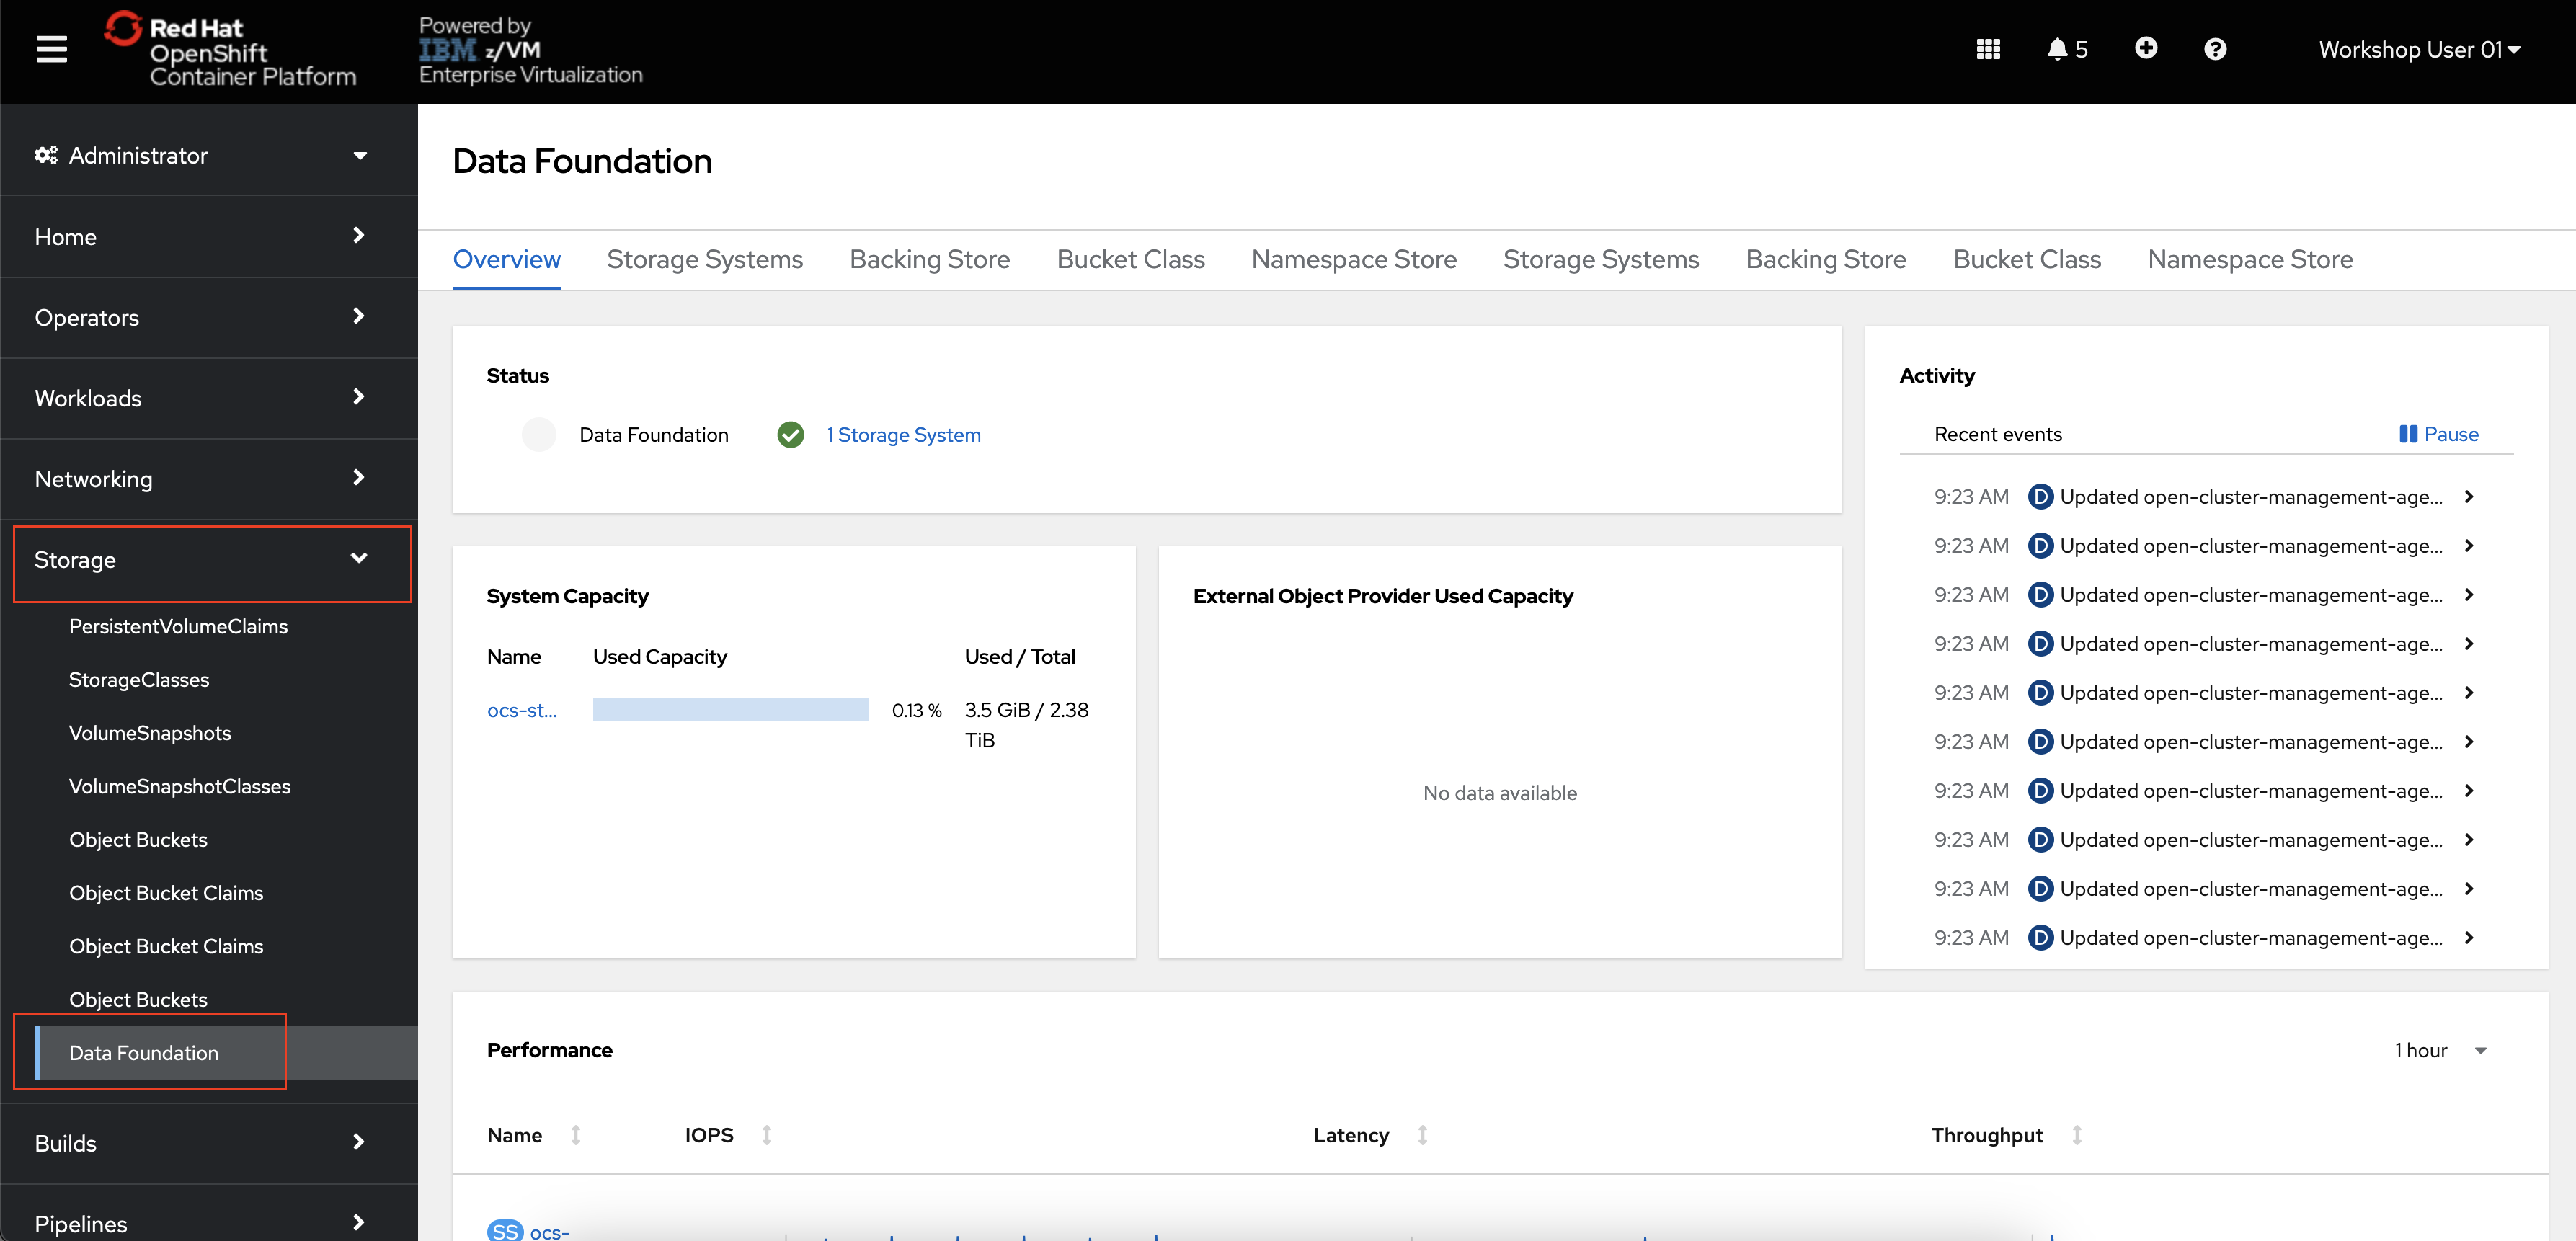
This is the main page for OpenShift Data Foundation where you can see the status of your storage system, its capacity, performance, and more.
-
Navigate to the
Storage Systemstab, and then click theocs-storagecluster-storagesystemhyperlink.On the Block and File tab, you can see information about the capacity and performance of block and file storage. You should also see your
userNN-projectlisted as a storage consumer under Used Capacity Breakdown.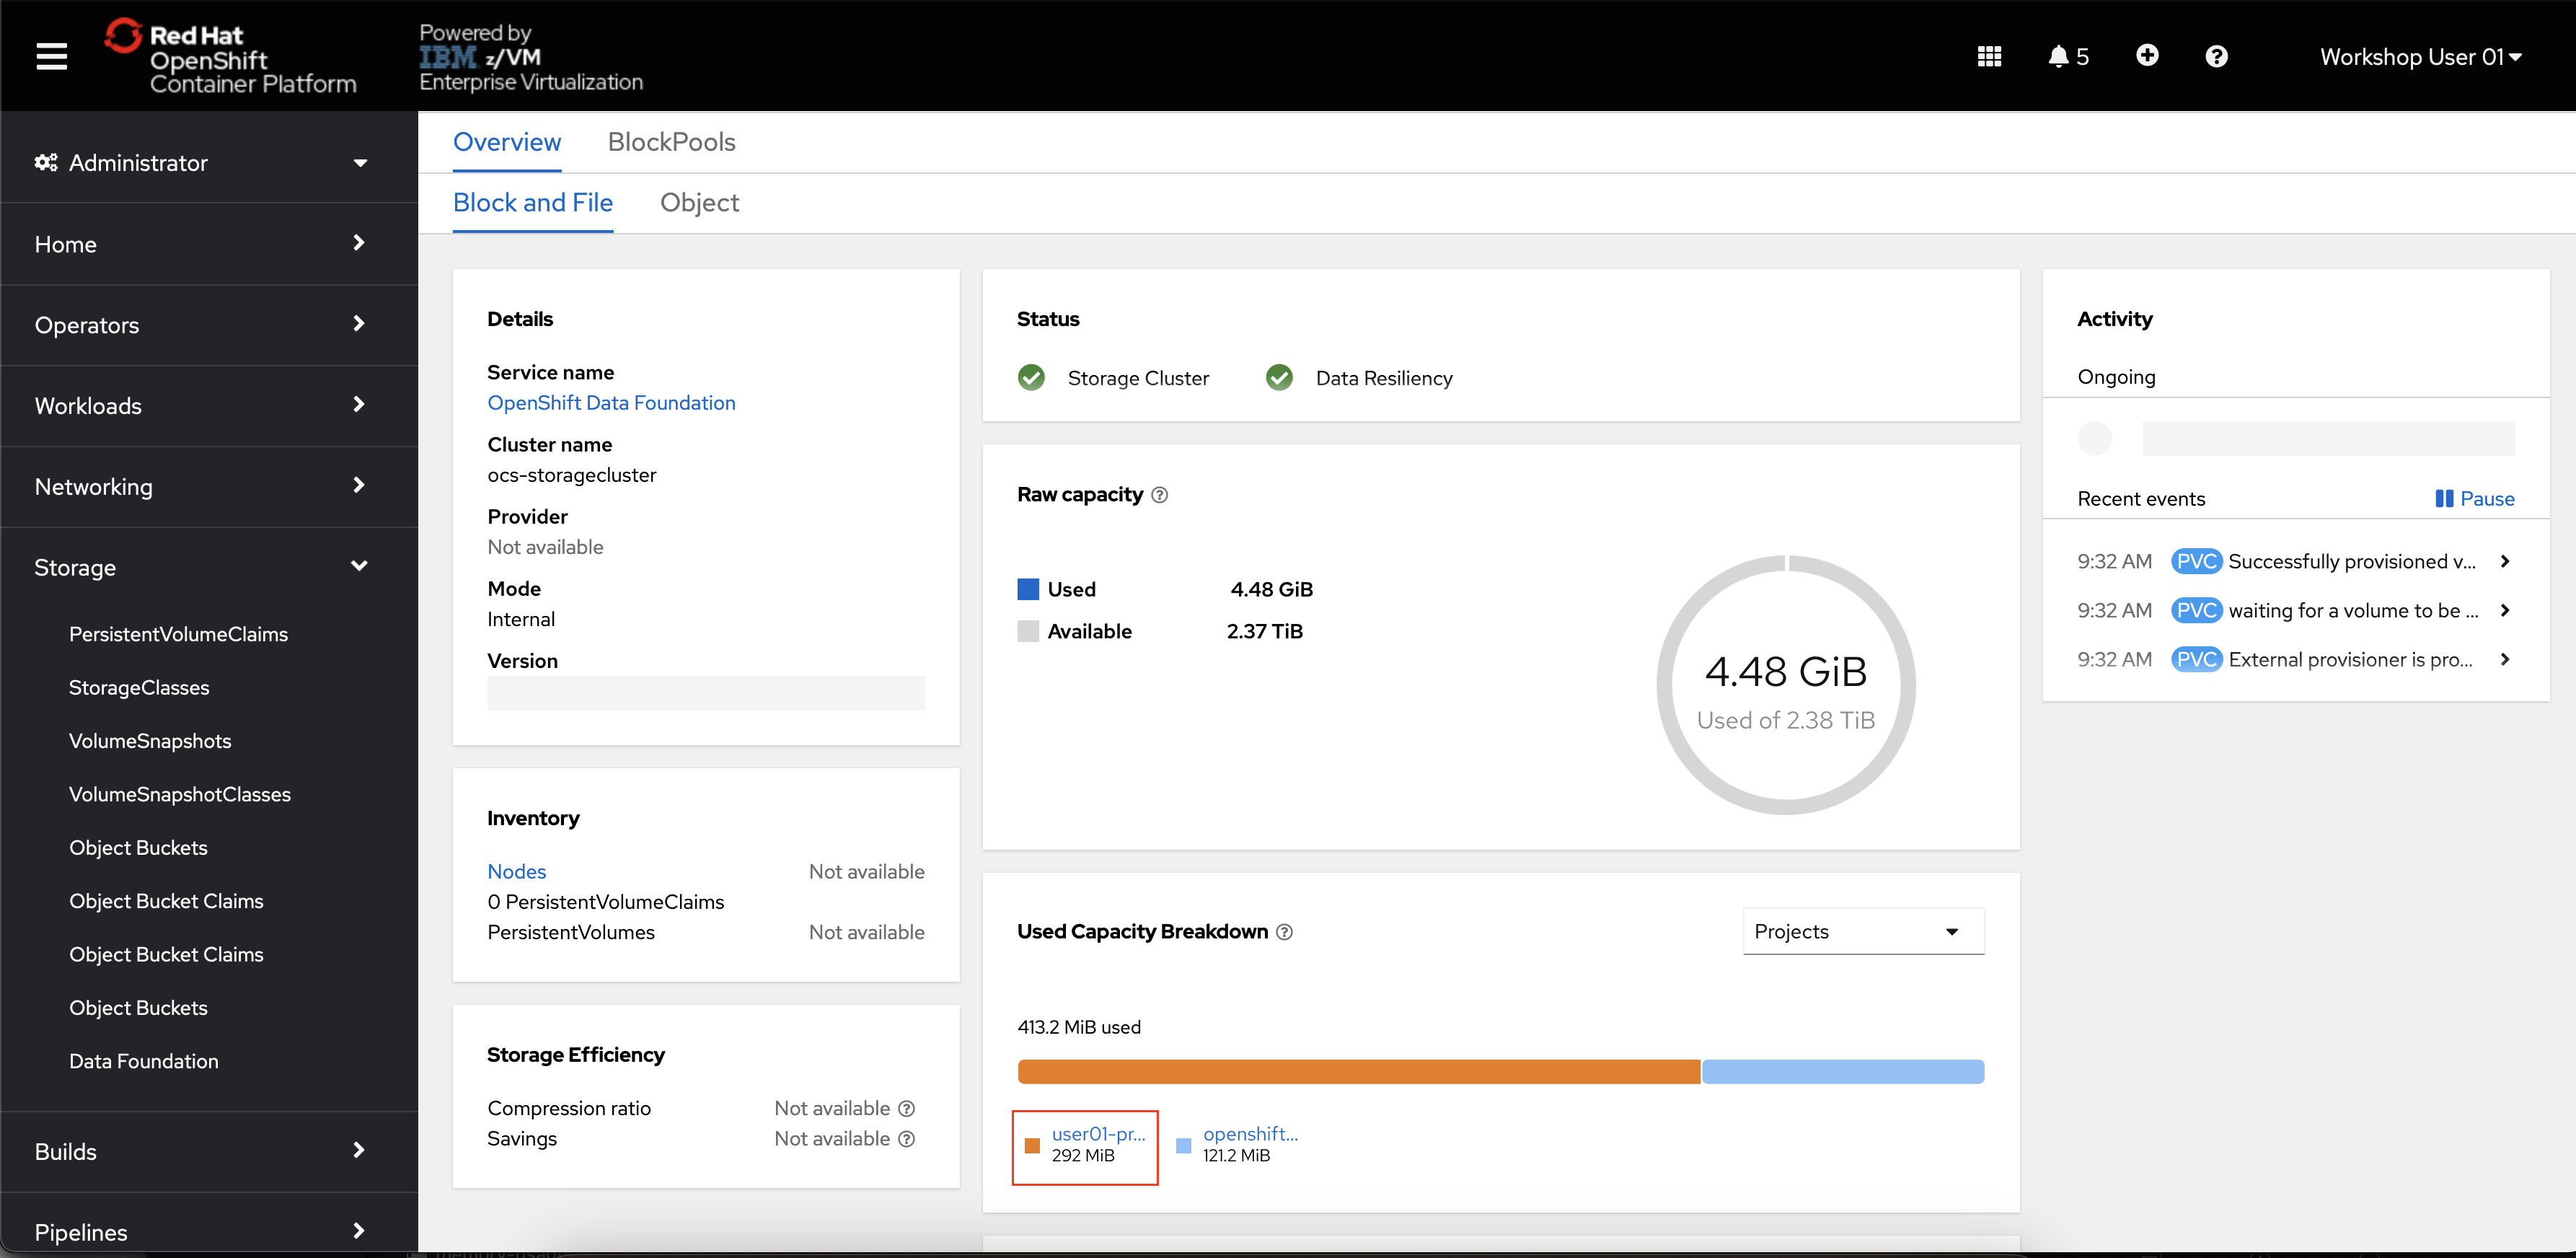


OpenShift Data Foundation is a powerful software-defined storage solution for storage administrators who need visibility into the consumption and performance of storage in an OpenShift environment.
A significant architectural shift toward containers is underway and, as with any architectural shift, this brings new operational challenges. It can be challenging for many of the legacy monitoring tools to monitor container platforms in fast moving, often ephemeral environments. The good news is newer cloud-based offerings can ensure monitoring solutions are as scalable as the services being built and monitored. These new solutions have evolved to address the growing need to monitor your stack from the bottom to the top.
From an operations point of view, infrastructure monitoring tools collect metrics about the host or container, such as CPU load, available memory and network I/O.
The default monitoring stack is the 3-pronged open source approach of, Grafana, Alertmanager, and Prometheus.
Prometheus gives you finely grained metrics at a huge scale. With the right configuration, Prometheus can handle millions of time series.
Grafana can visualize the data being scraped by Prometheus. Grafana comes with pre-built dashboards for typical use cases, or you can create your own custom ones.
Alertmanager forwards alerts to a service such as Slack or another webhook . Alertmanager can use metadata to classify alerts into groups such as errors, notifications, etc.
The Grafana-Alertmanager-Prometheus monitoring stack provides a highly configurable, open source option to monitor Kubernetes workloads.

OpenShift provides a web interface to Prometheus, which enables you to run Prometheus Query Language (PromQL) queries and visualize the metrics on a plot. This functionality provides an extensive overview of the cluster state and helps to troubleshoot problems.
-
In the OpenShift console, switch to the Administrator perspective if you are not already on it.
-
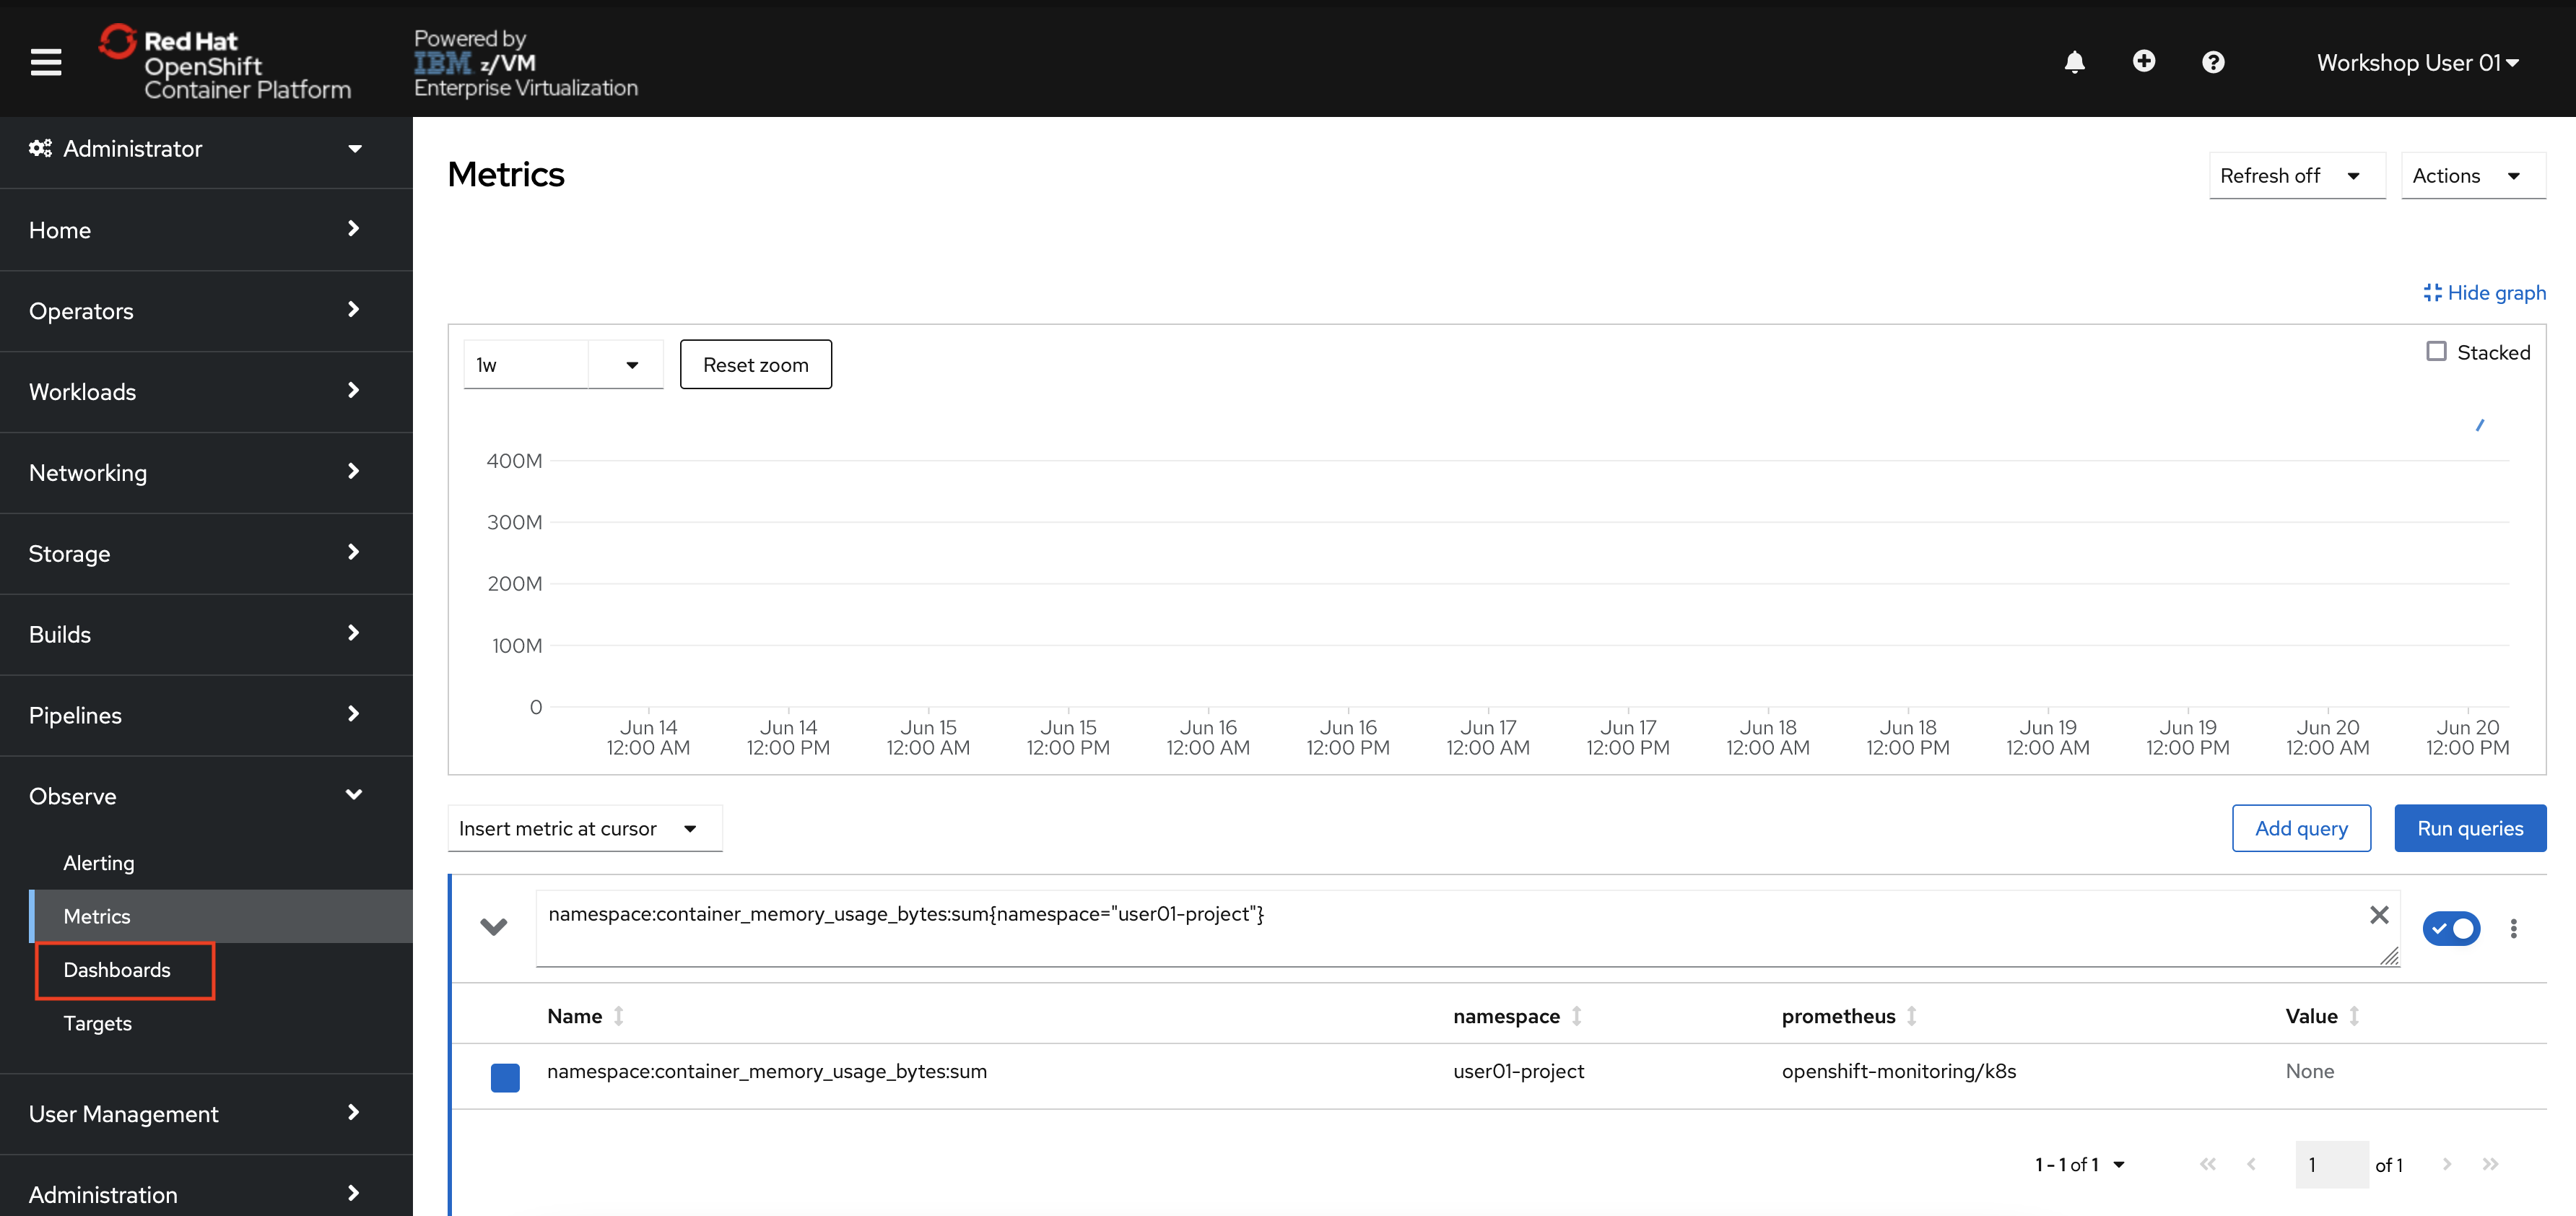
In the menu bar on the left side of the page, click Observe and then Metrics.
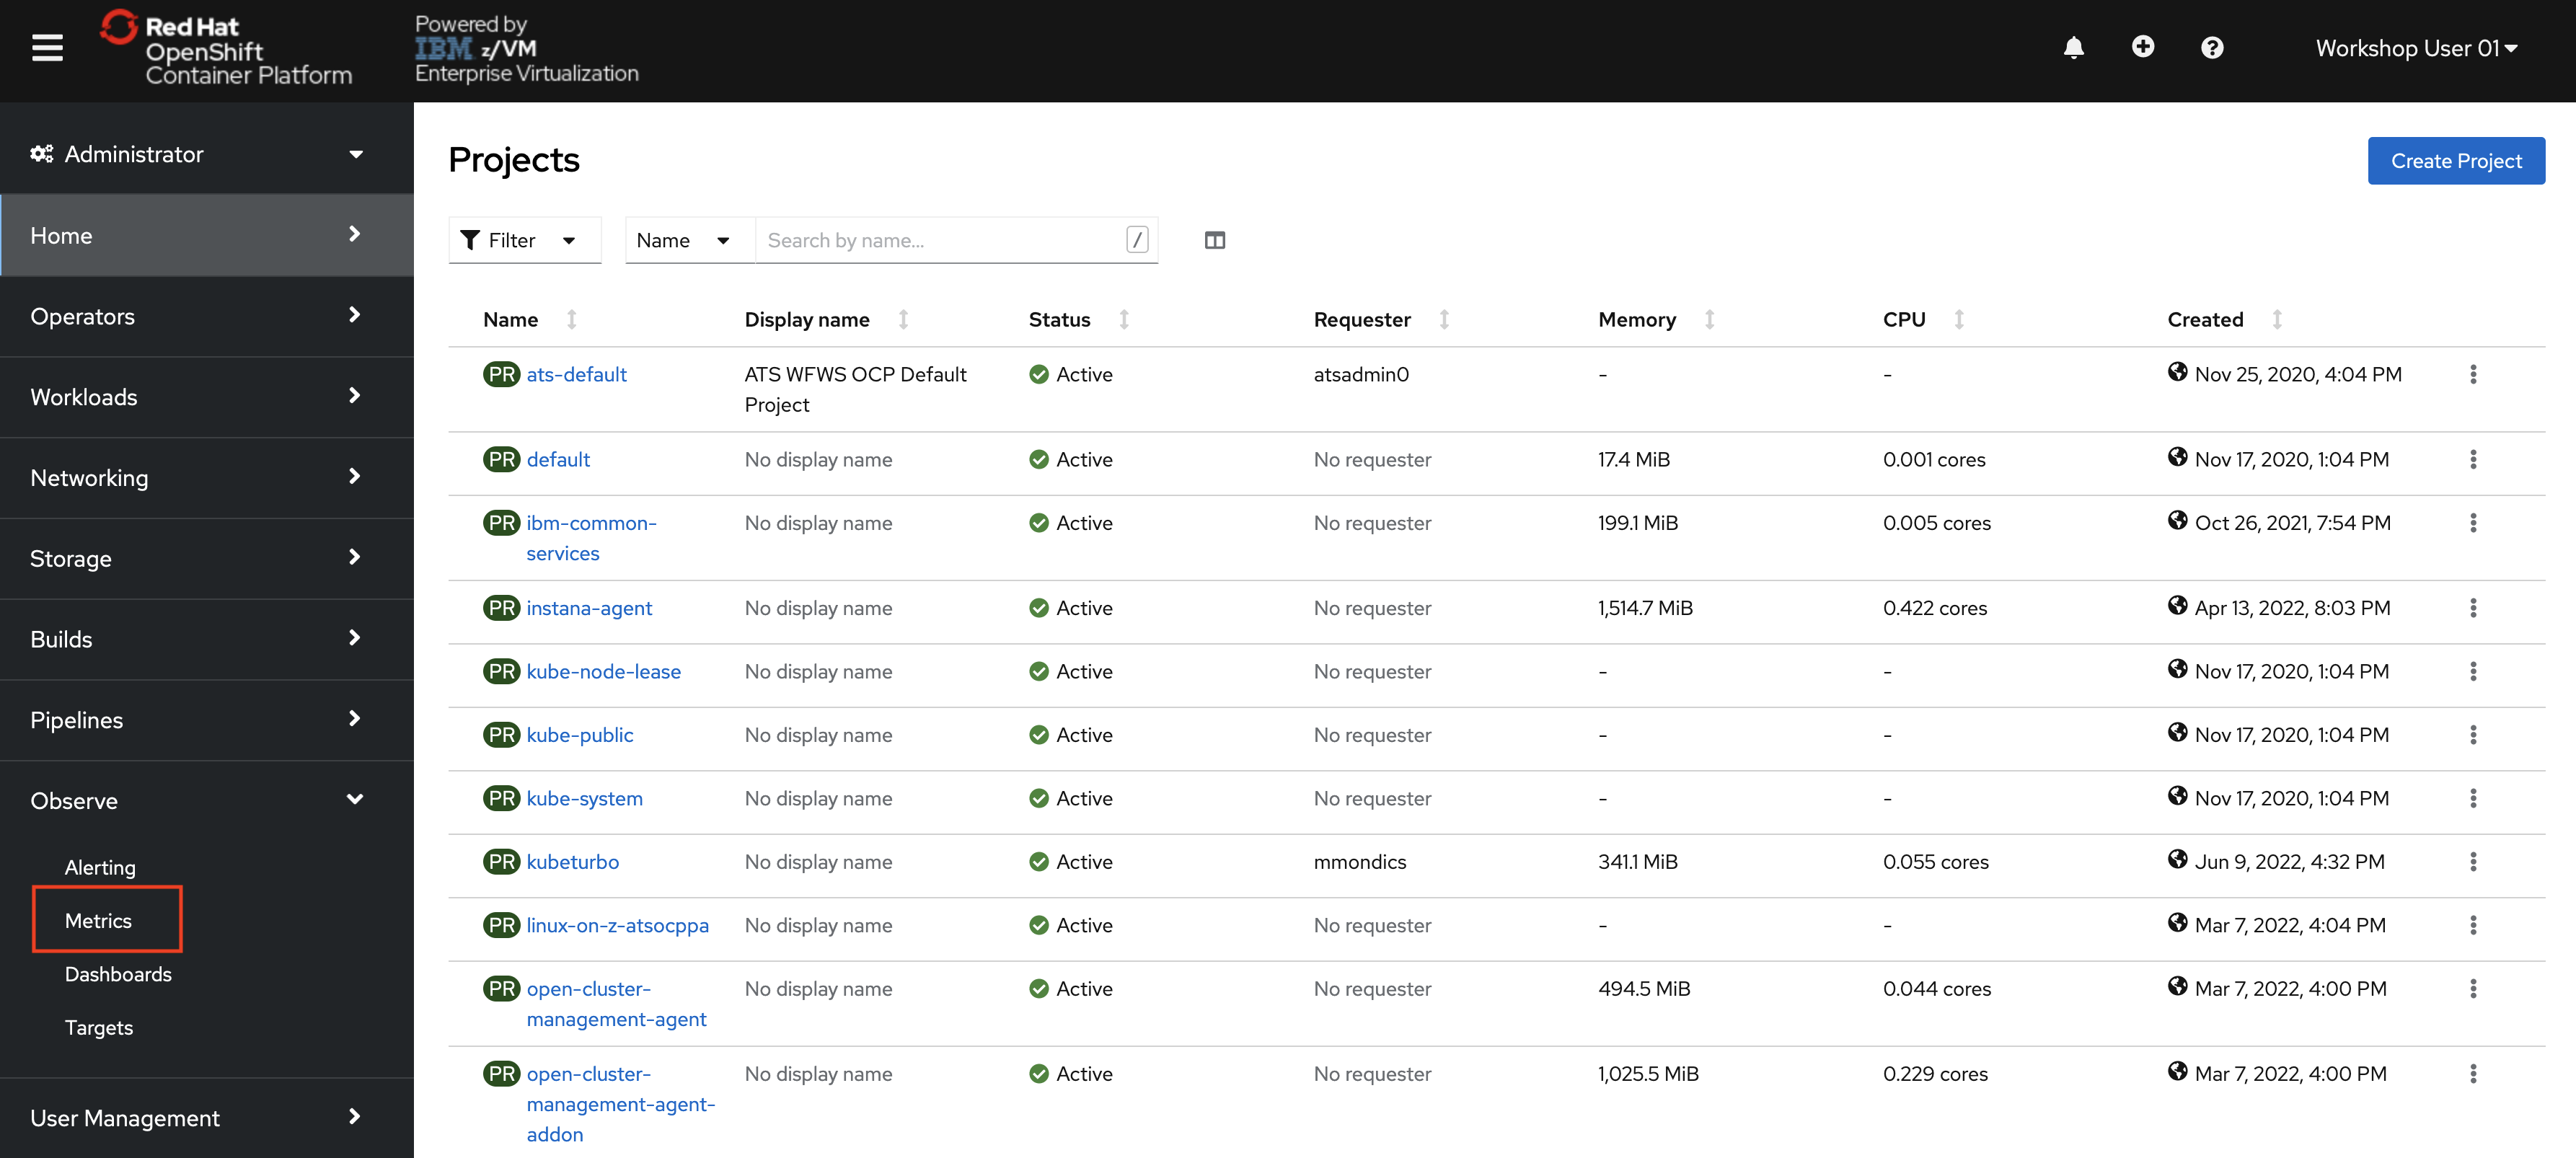
You will be taken to a Prometheus interface within the OpenShift console.
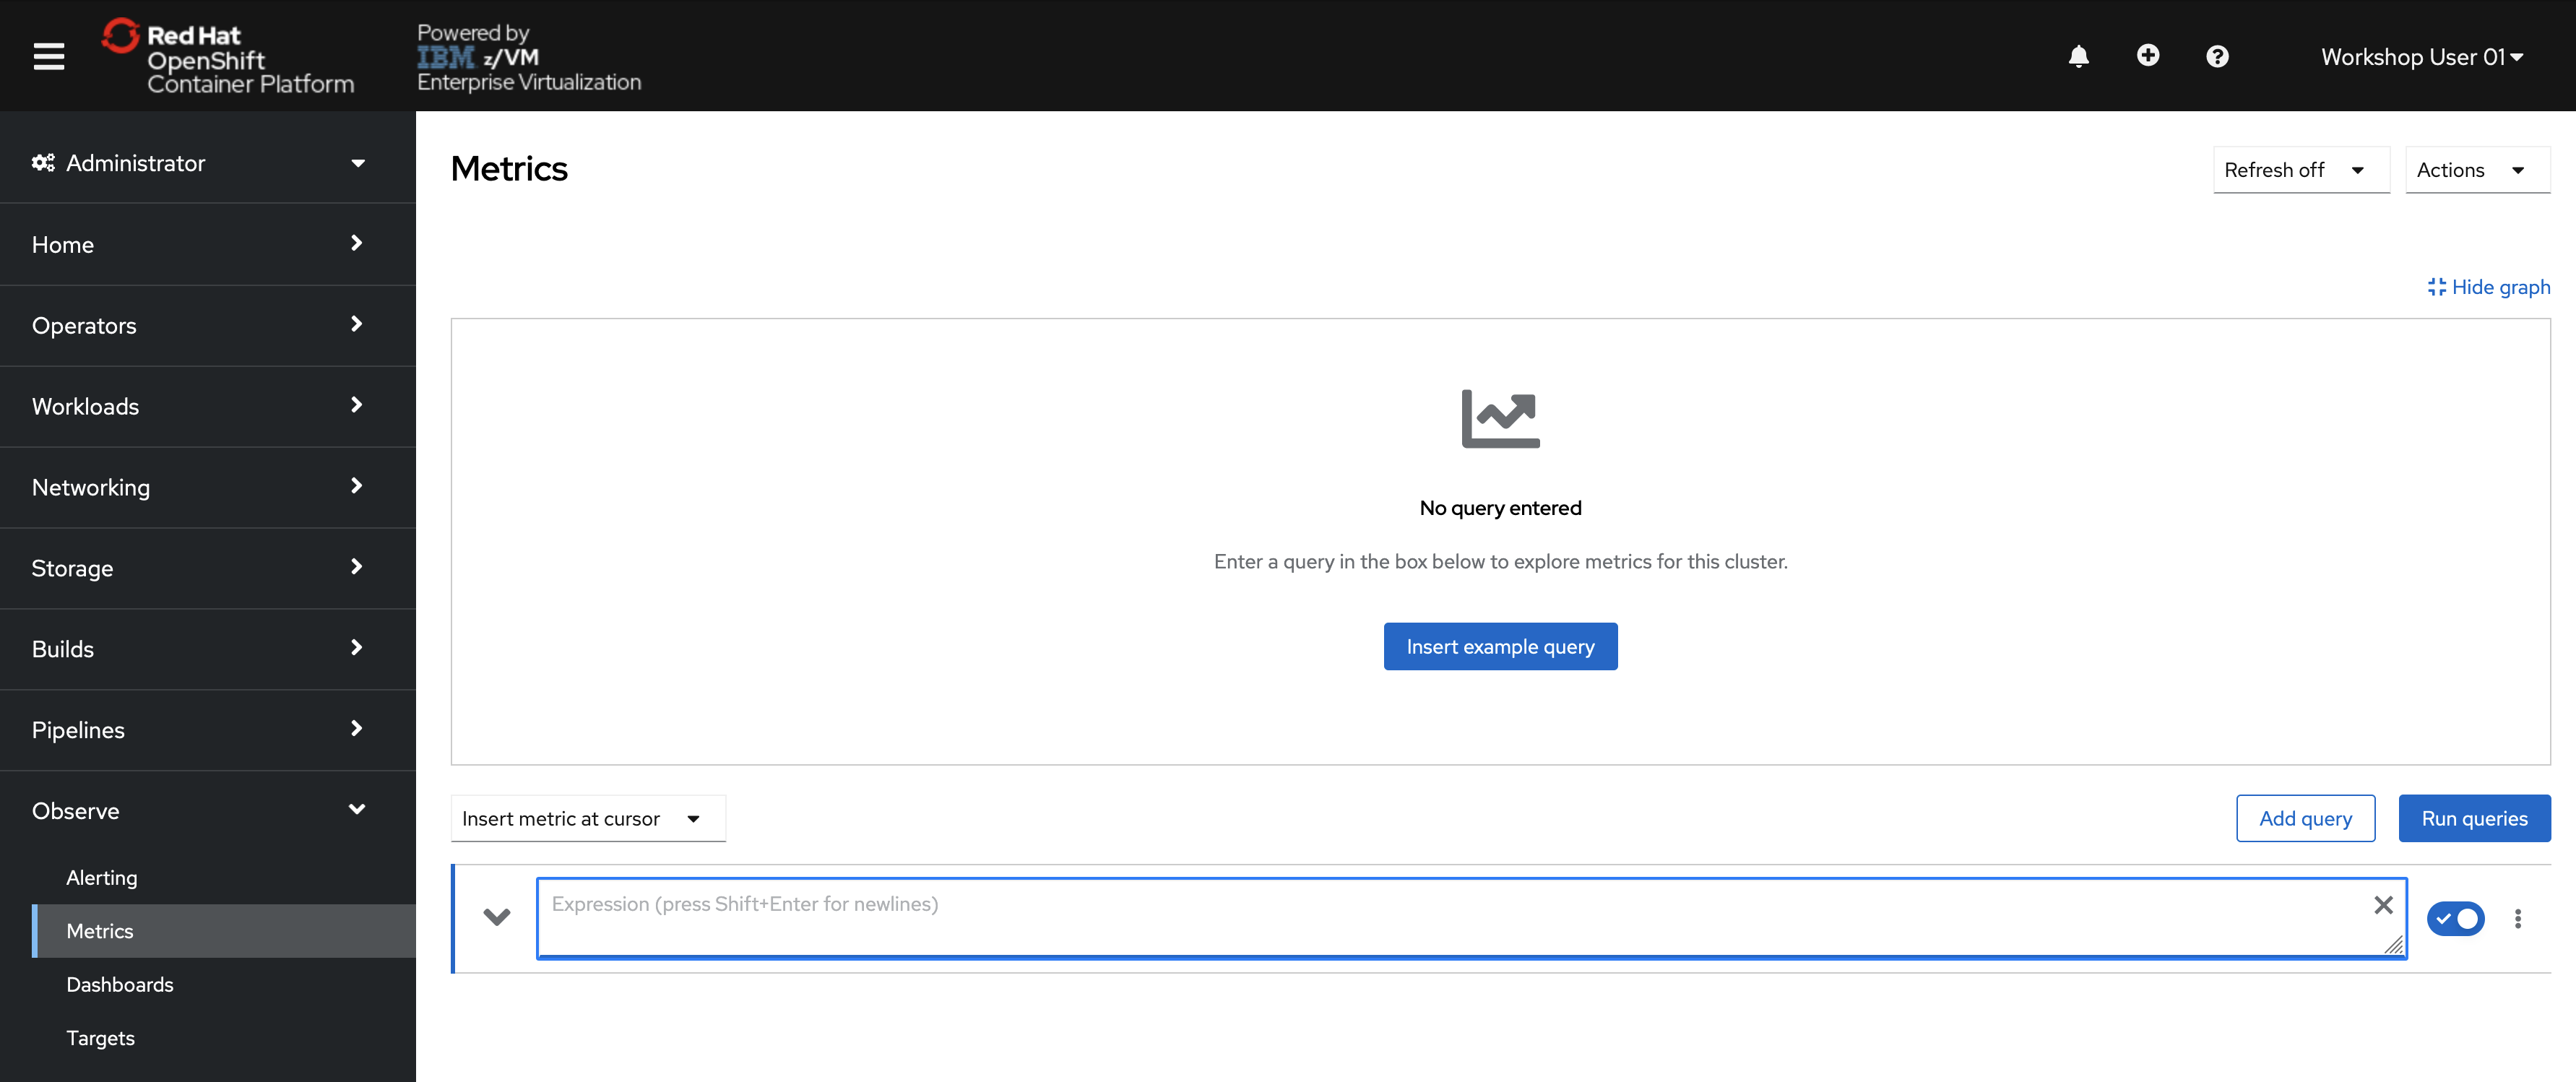
Once you enter a query, the graph will populate.
-
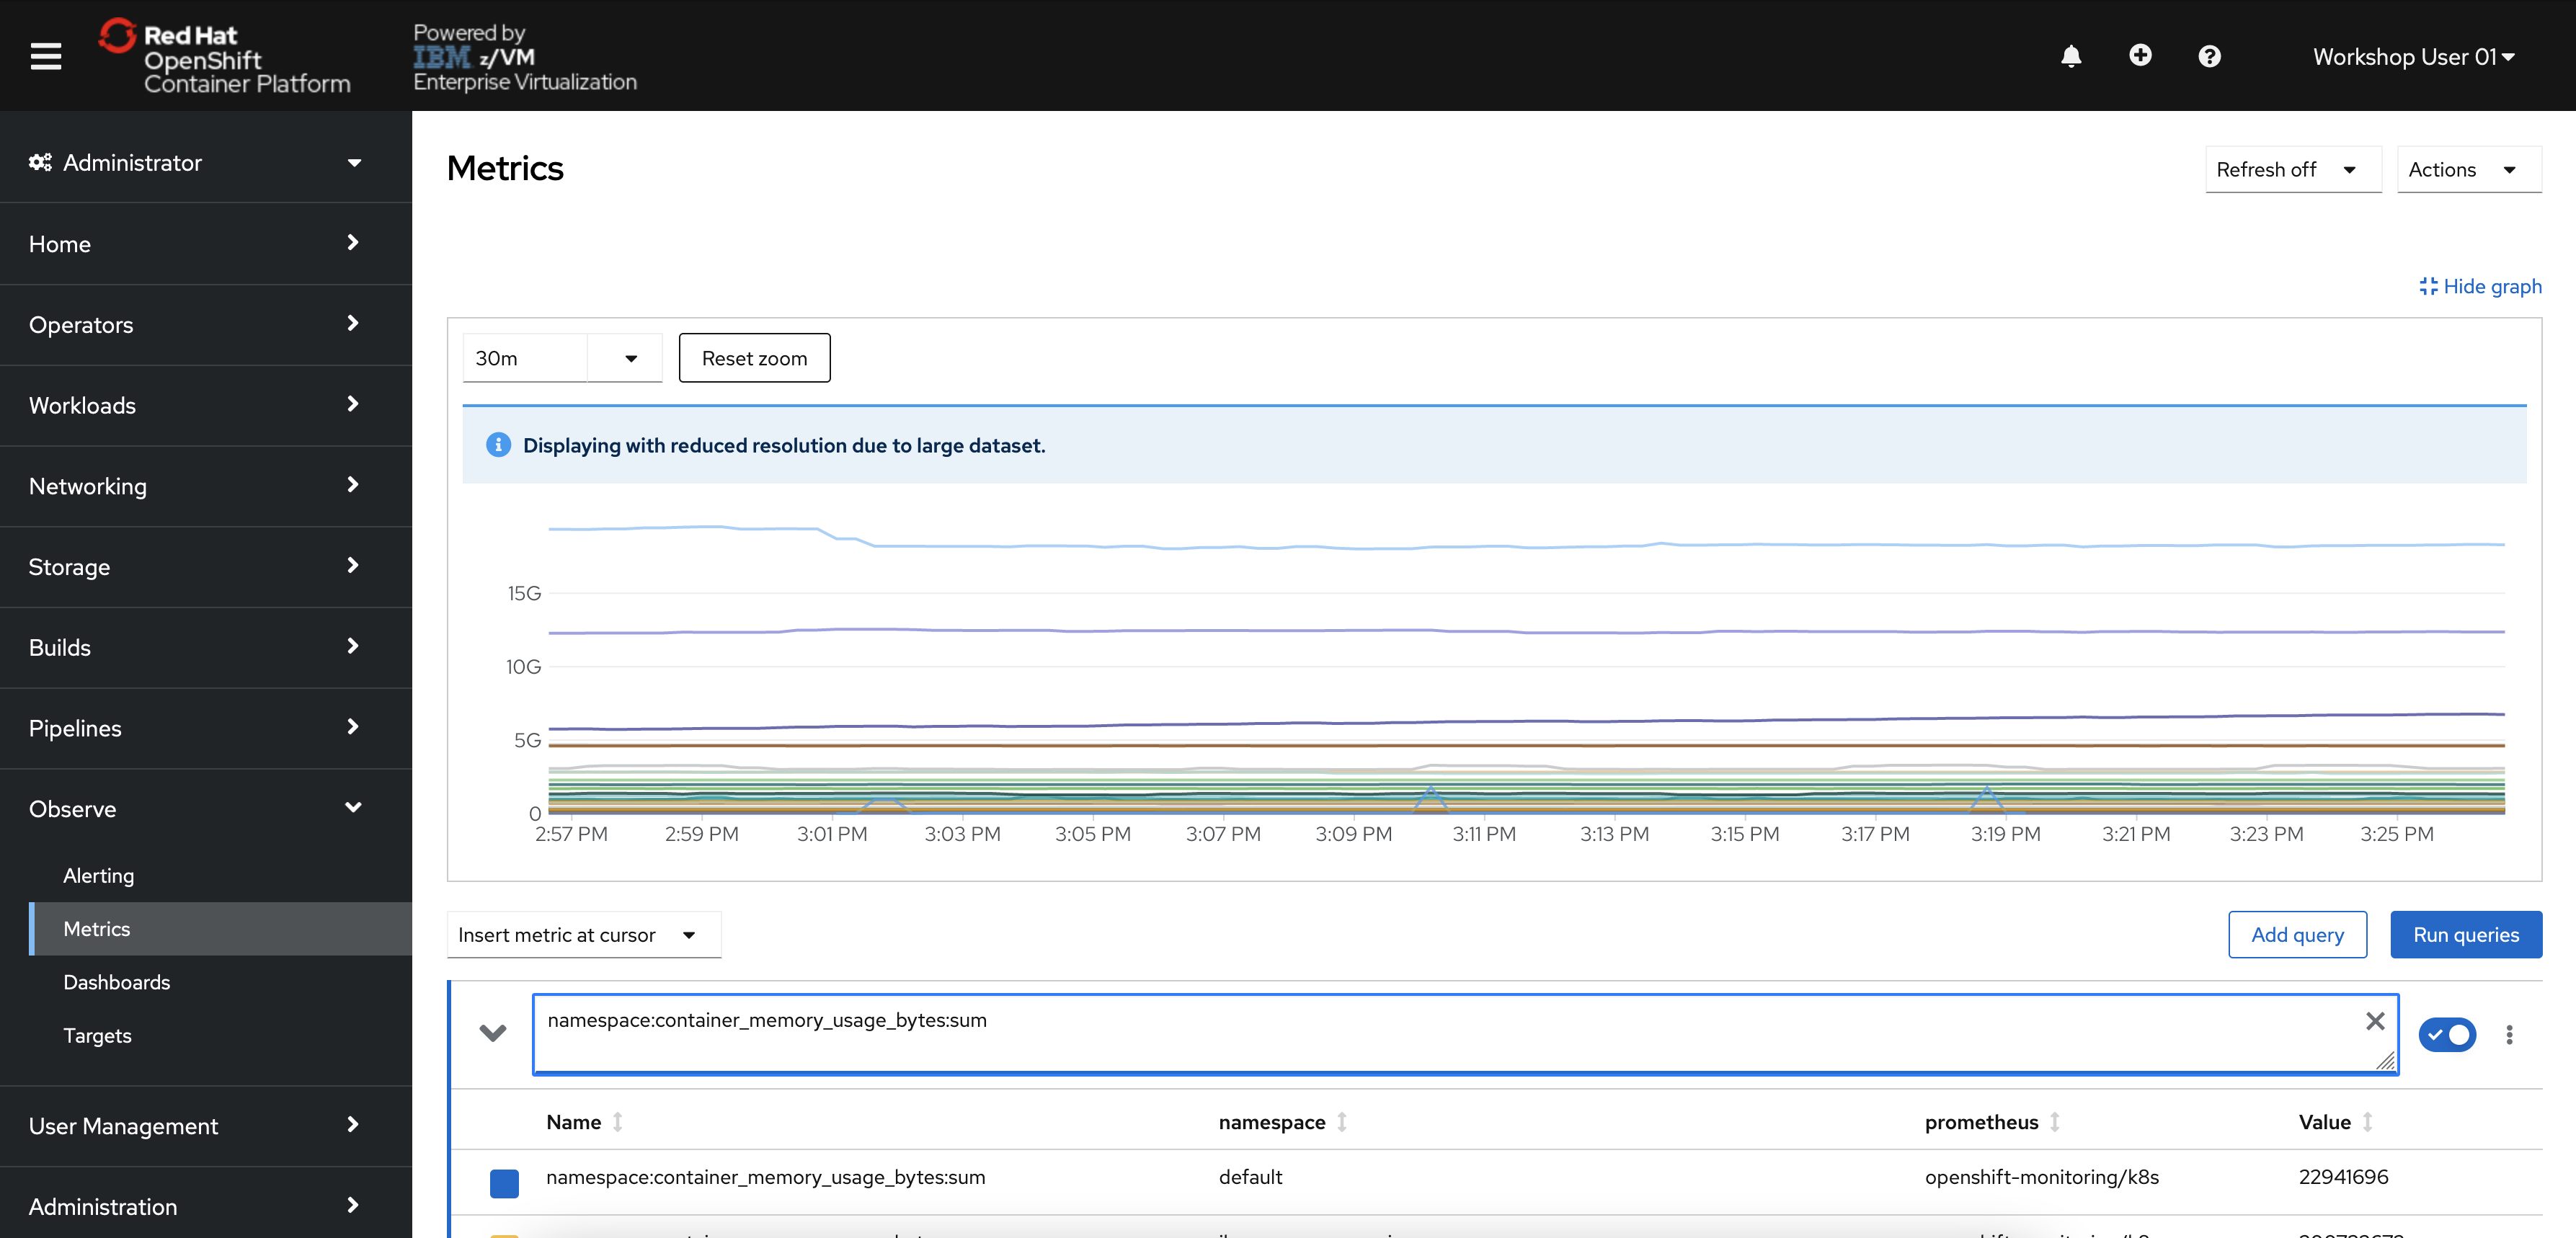
Enter the following string in the query bar:
namespace:container_memory_usage_bytes:sum -
Hit your enter key or click the associated query result that is returned.
The string will populate the query text box.
-
If the graph and table are not automatically populated. click the blue "Run Queries" button.
The graph should now display the memory usage over time for each namespace.
-
Scroll down the page to the table displaying each namespace and its memory usage in bytes.
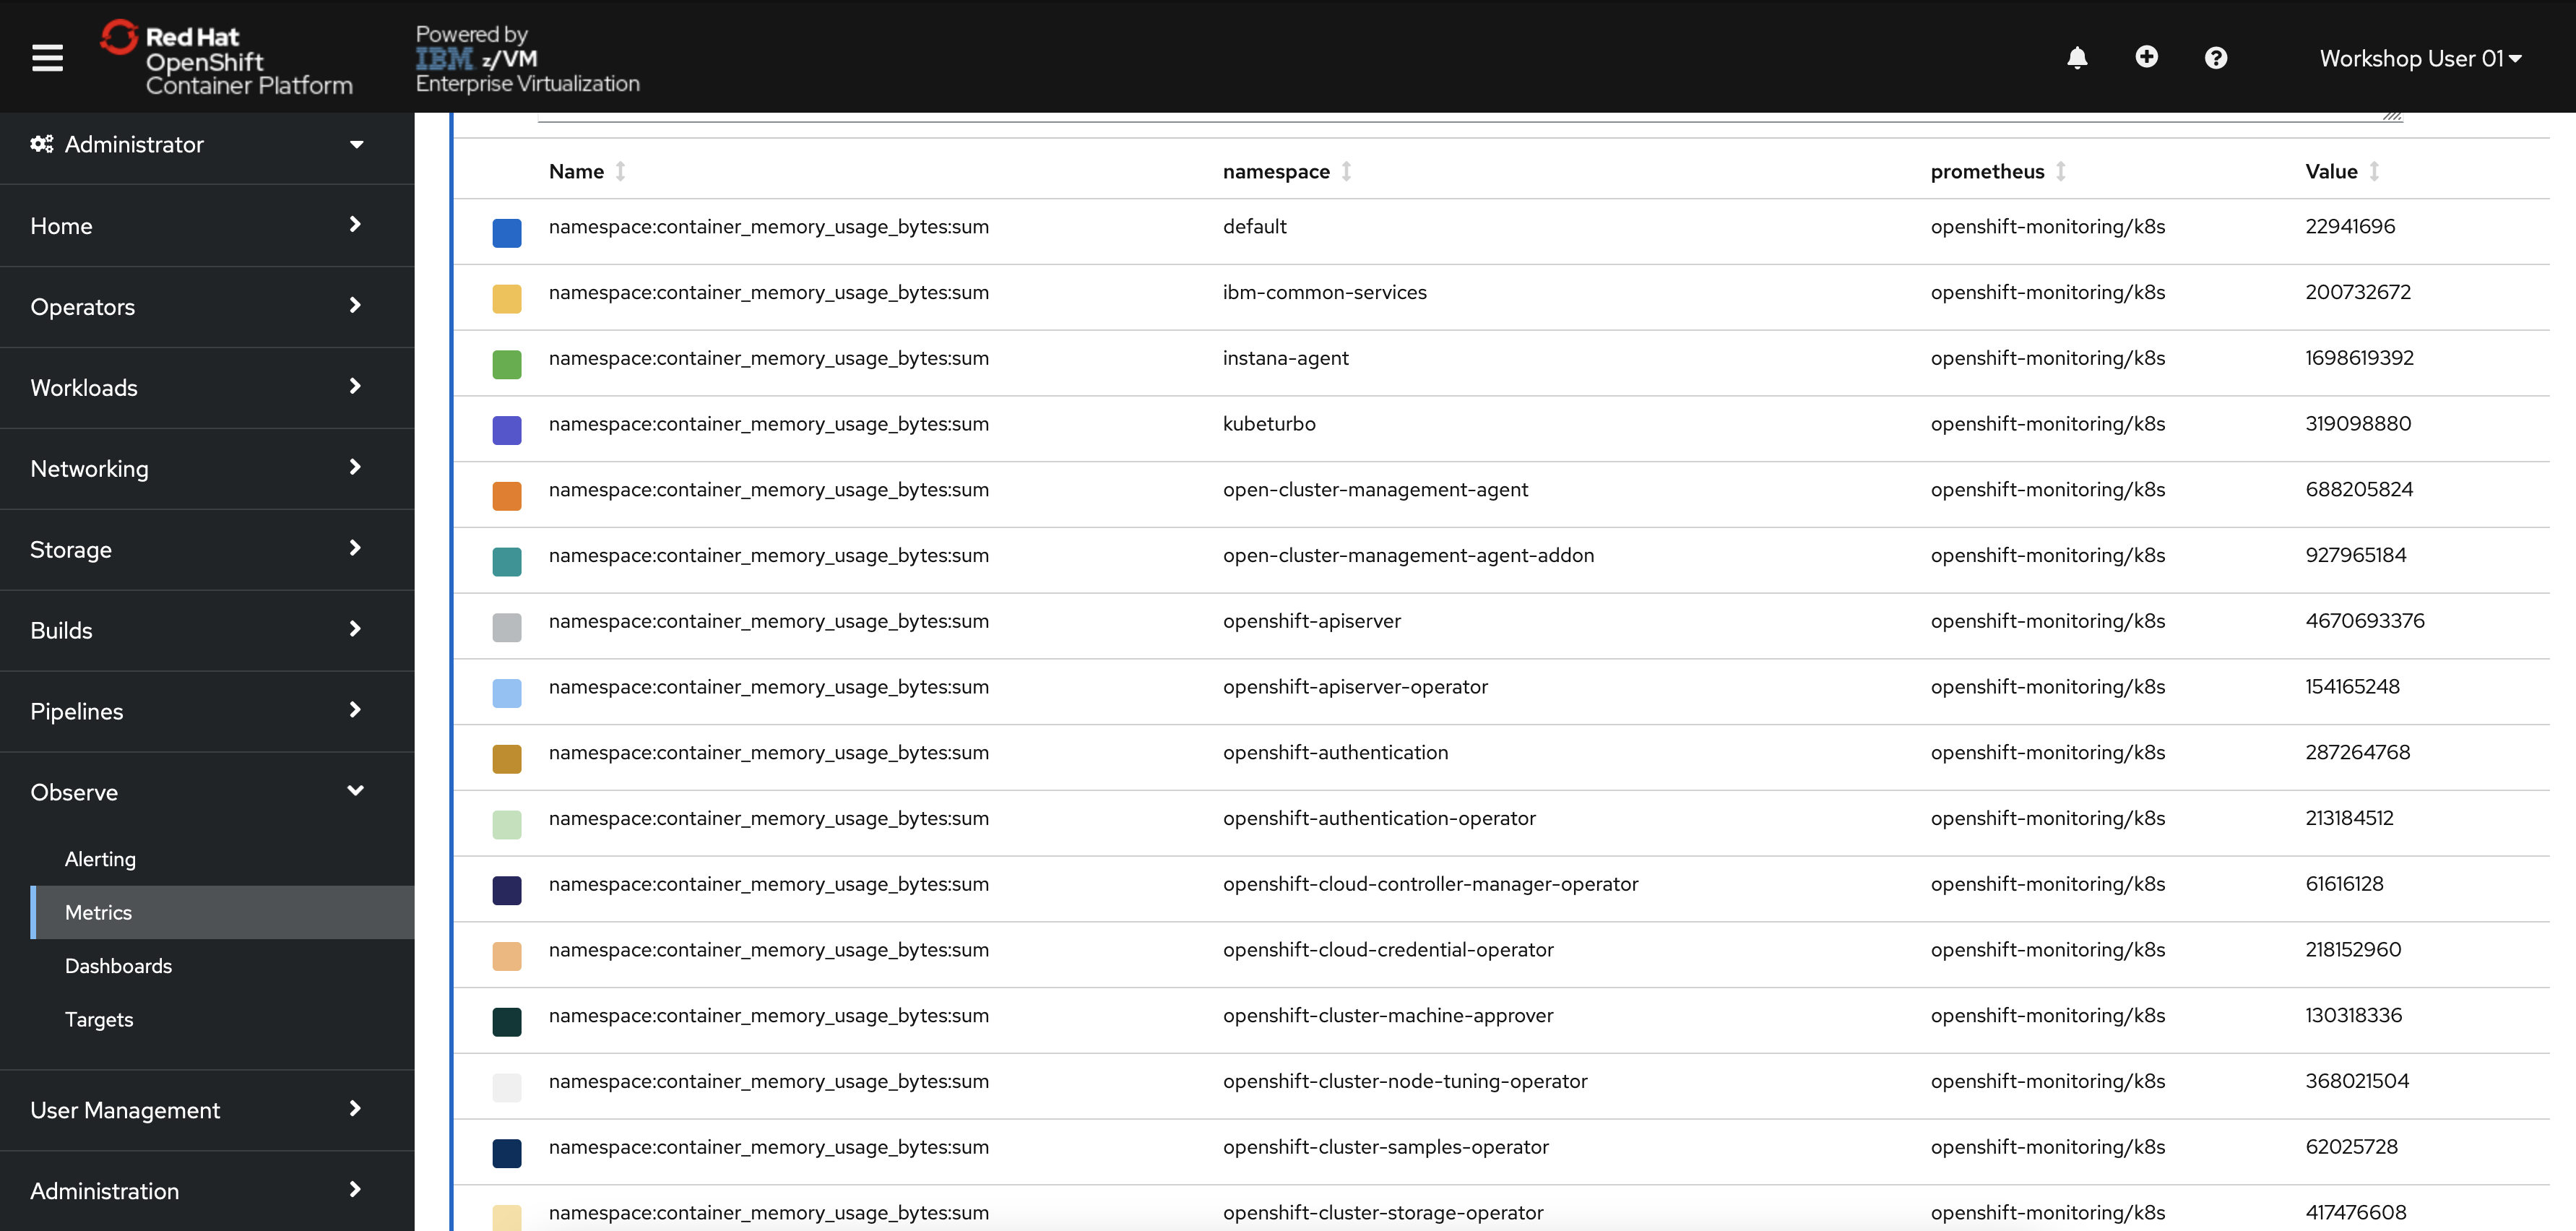
Your table will look different depending on what work is being done in the OpenShift cluster at the time.
Notice that you have observability of the entire OpenShift cluster, even though you cannot access or edit projects other than your own. In other words, you have read-only access to the full OpenShift cluster via the Observability stack, but you read-write access within your userNN-project.
OpenShift passes around a massive amount of data to run itself and the applications running on top of it. Prometheus is an extremely powerful data source that can return results for millions of time strings with extremely granular precision.
Because of OpenShift’s vast data production and Prometheus’ ability to process it, certain queries can produce simply too much data to be useful. Because Prometheus makes use of labels, we can use these labels to filter data to make better sense of it.
-
Modify your query to the following:
namespace:container_memory_usage_bytes:sum{namespace="userNN-project"}Make sure you change the one instance of
NNto your user number.Also, notice that they are squiggly brackets
{}in the query, not regular parentheses. -
Click Run Queries
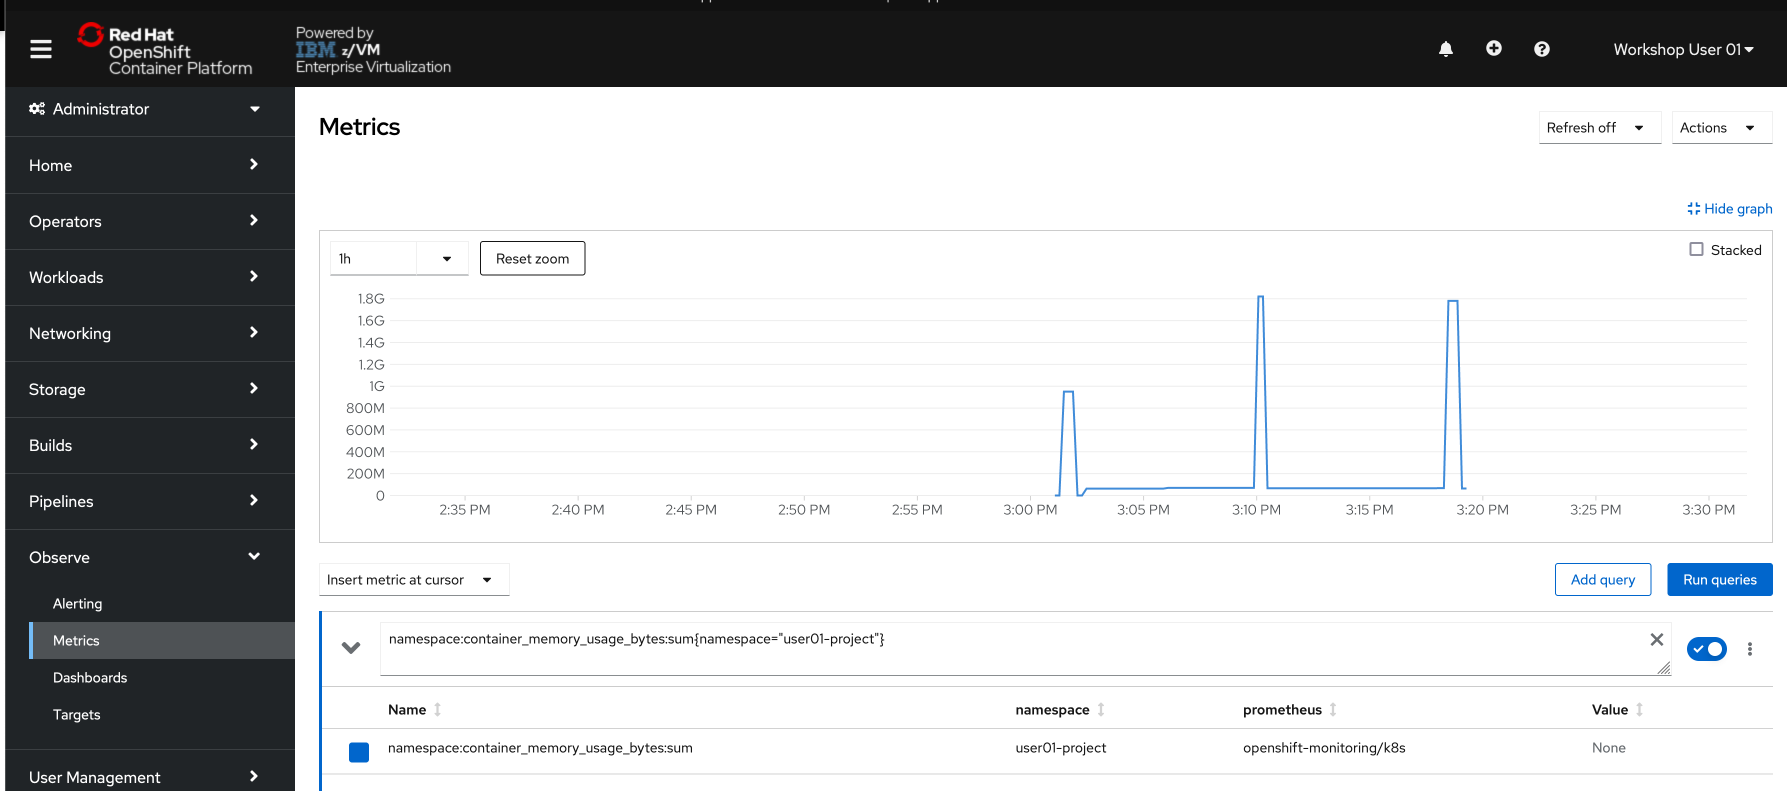
Your graph is now displaying the memory usage over time for your own project. If you see a “No datapoints found” message, select a longer timeframe using the dropdown menu in the top left of the graph.
If you skipped ahead to this lab without completing the others, it’s possible that your project has not had workload deployed in it for more than the maximum time frame. If this is the case, run a simple application in your project, and you will see the data start to populate (refer to Exploring the OpenShift Console for help with this.)


As you might have noticed, working directly with Prometheus can be tedious and requires specific PromQL queries that aren’t the easiest to work with. That’s why people typically use Prometheus for its data source functionality, and then move to Grafana for the data visualization.
-
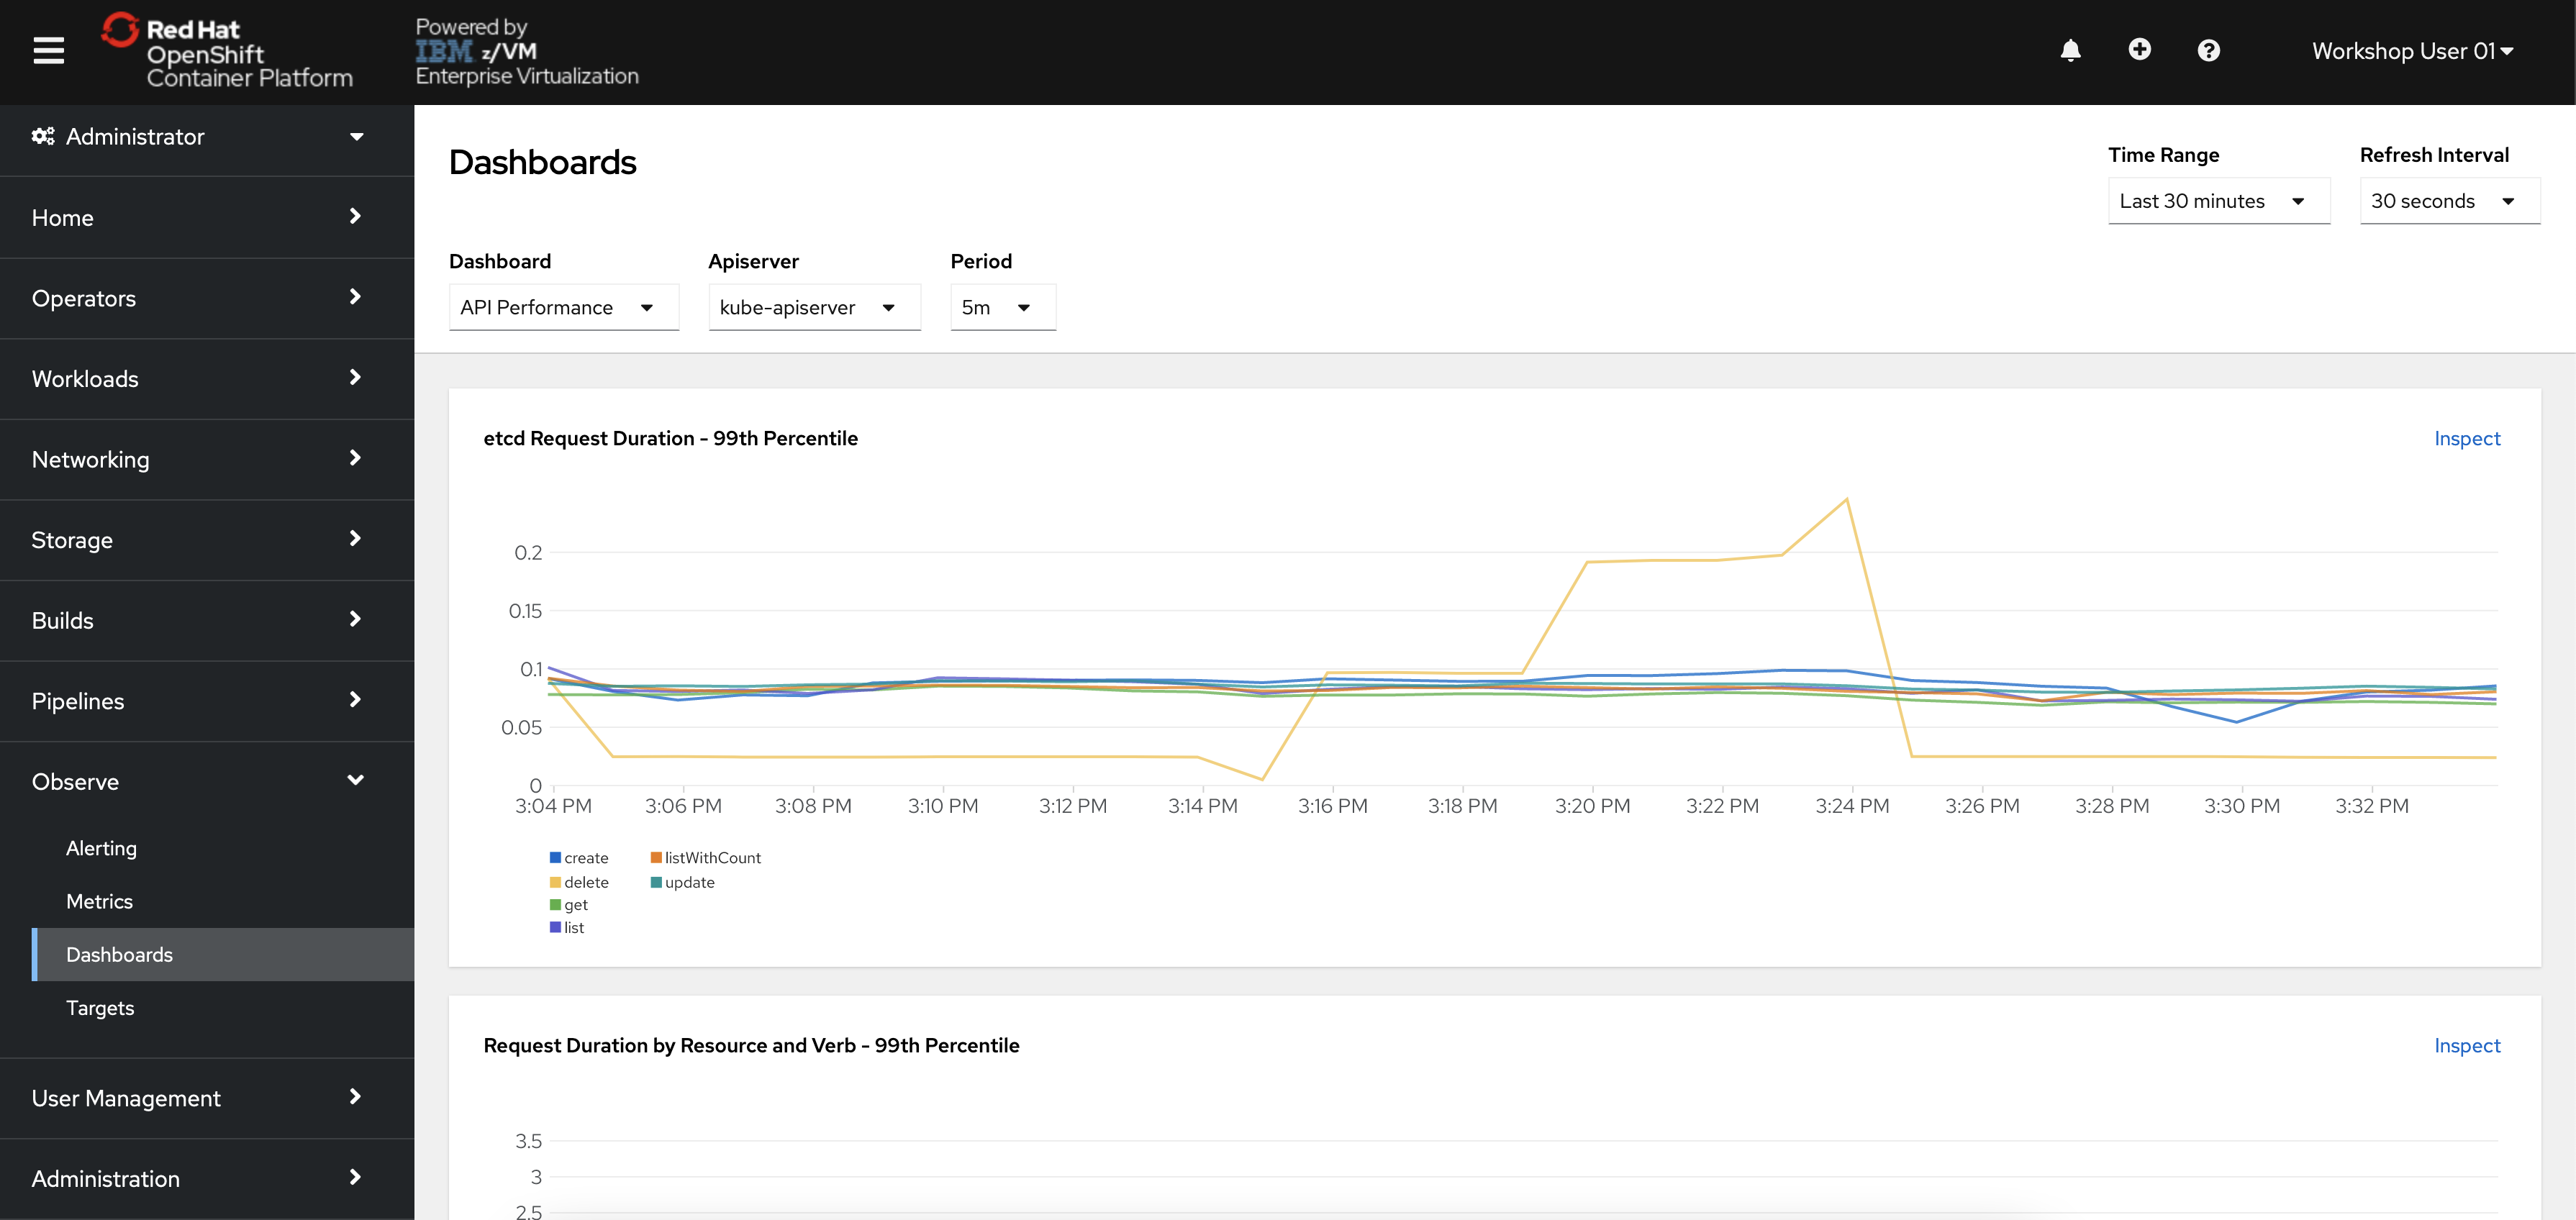
From the OpenShift menu, navigate to Observability -> Dashboards.
This takes you to an in-browser user interface for the Grafana monitoring solution. By default, there are various preconfigured dashboards for common use cases.
-
Click the "Dashboard" dropdown in the top-left of the page, and select
Kubernetes / Compute Resources / Cluster.
You will see a dashboard populated with information related to the cluster’s compute resources such as CPU and memory utilization. This dashboard displays CPU usage and CPU quota/memory requests by namespace.
-
Scroll down the page and look through the various CPU/memory/networking metrics.
Notice that each chart has an
Inspectoption. Clicking it will take you to the relevant Metrics page with the proper Prometheus query applied for more fine-grained detail.


For users who are familiar with the standard Grafana interface, that can also be accessed outside of the OpenShift console (rather than these pages integrated into the console).
You can find the direct link to the Grafana webpages by looking at the routes (Adminstrator -> Networking -> Routes) in the openshift-monitoring project.
Alerting with Prometheus is separated into two parts. Alerting rules in Prometheus send alerts to Alertmanager. Alertmanager then manages those alerts, including silencing, inhibition, aggregation and sending out notifications via methods such as email or chat platforms like Slack.

An example rules file with an alert would be:
groups:
- name: example
  rules:
  - alert: HighRequestLatency
    expr: job:request_latency_seconds:mean5m{job="myjob"} > 0.5
    for: 10m
    labels:
      severity: page
    annotations:
      summary: High request latency
The optional for clause causes Prometheus to wait for a certain duration between first encountering a new expression output vector element and counting an alert as firing for this element. In this case, Prometheus will check that the alert continues to be active during each evaluation for 10 minutes before firing the alert. Elements that are active, but not firing yet, are in the pending state.
The labels clause allows specifying a set of additional labels to be attached to the alert. Any existing conflicting labels will be overwritten.
The annotations clause specifies a set of informational labels that can be used to store longer additional information such as alert descriptions or runbook links.
-
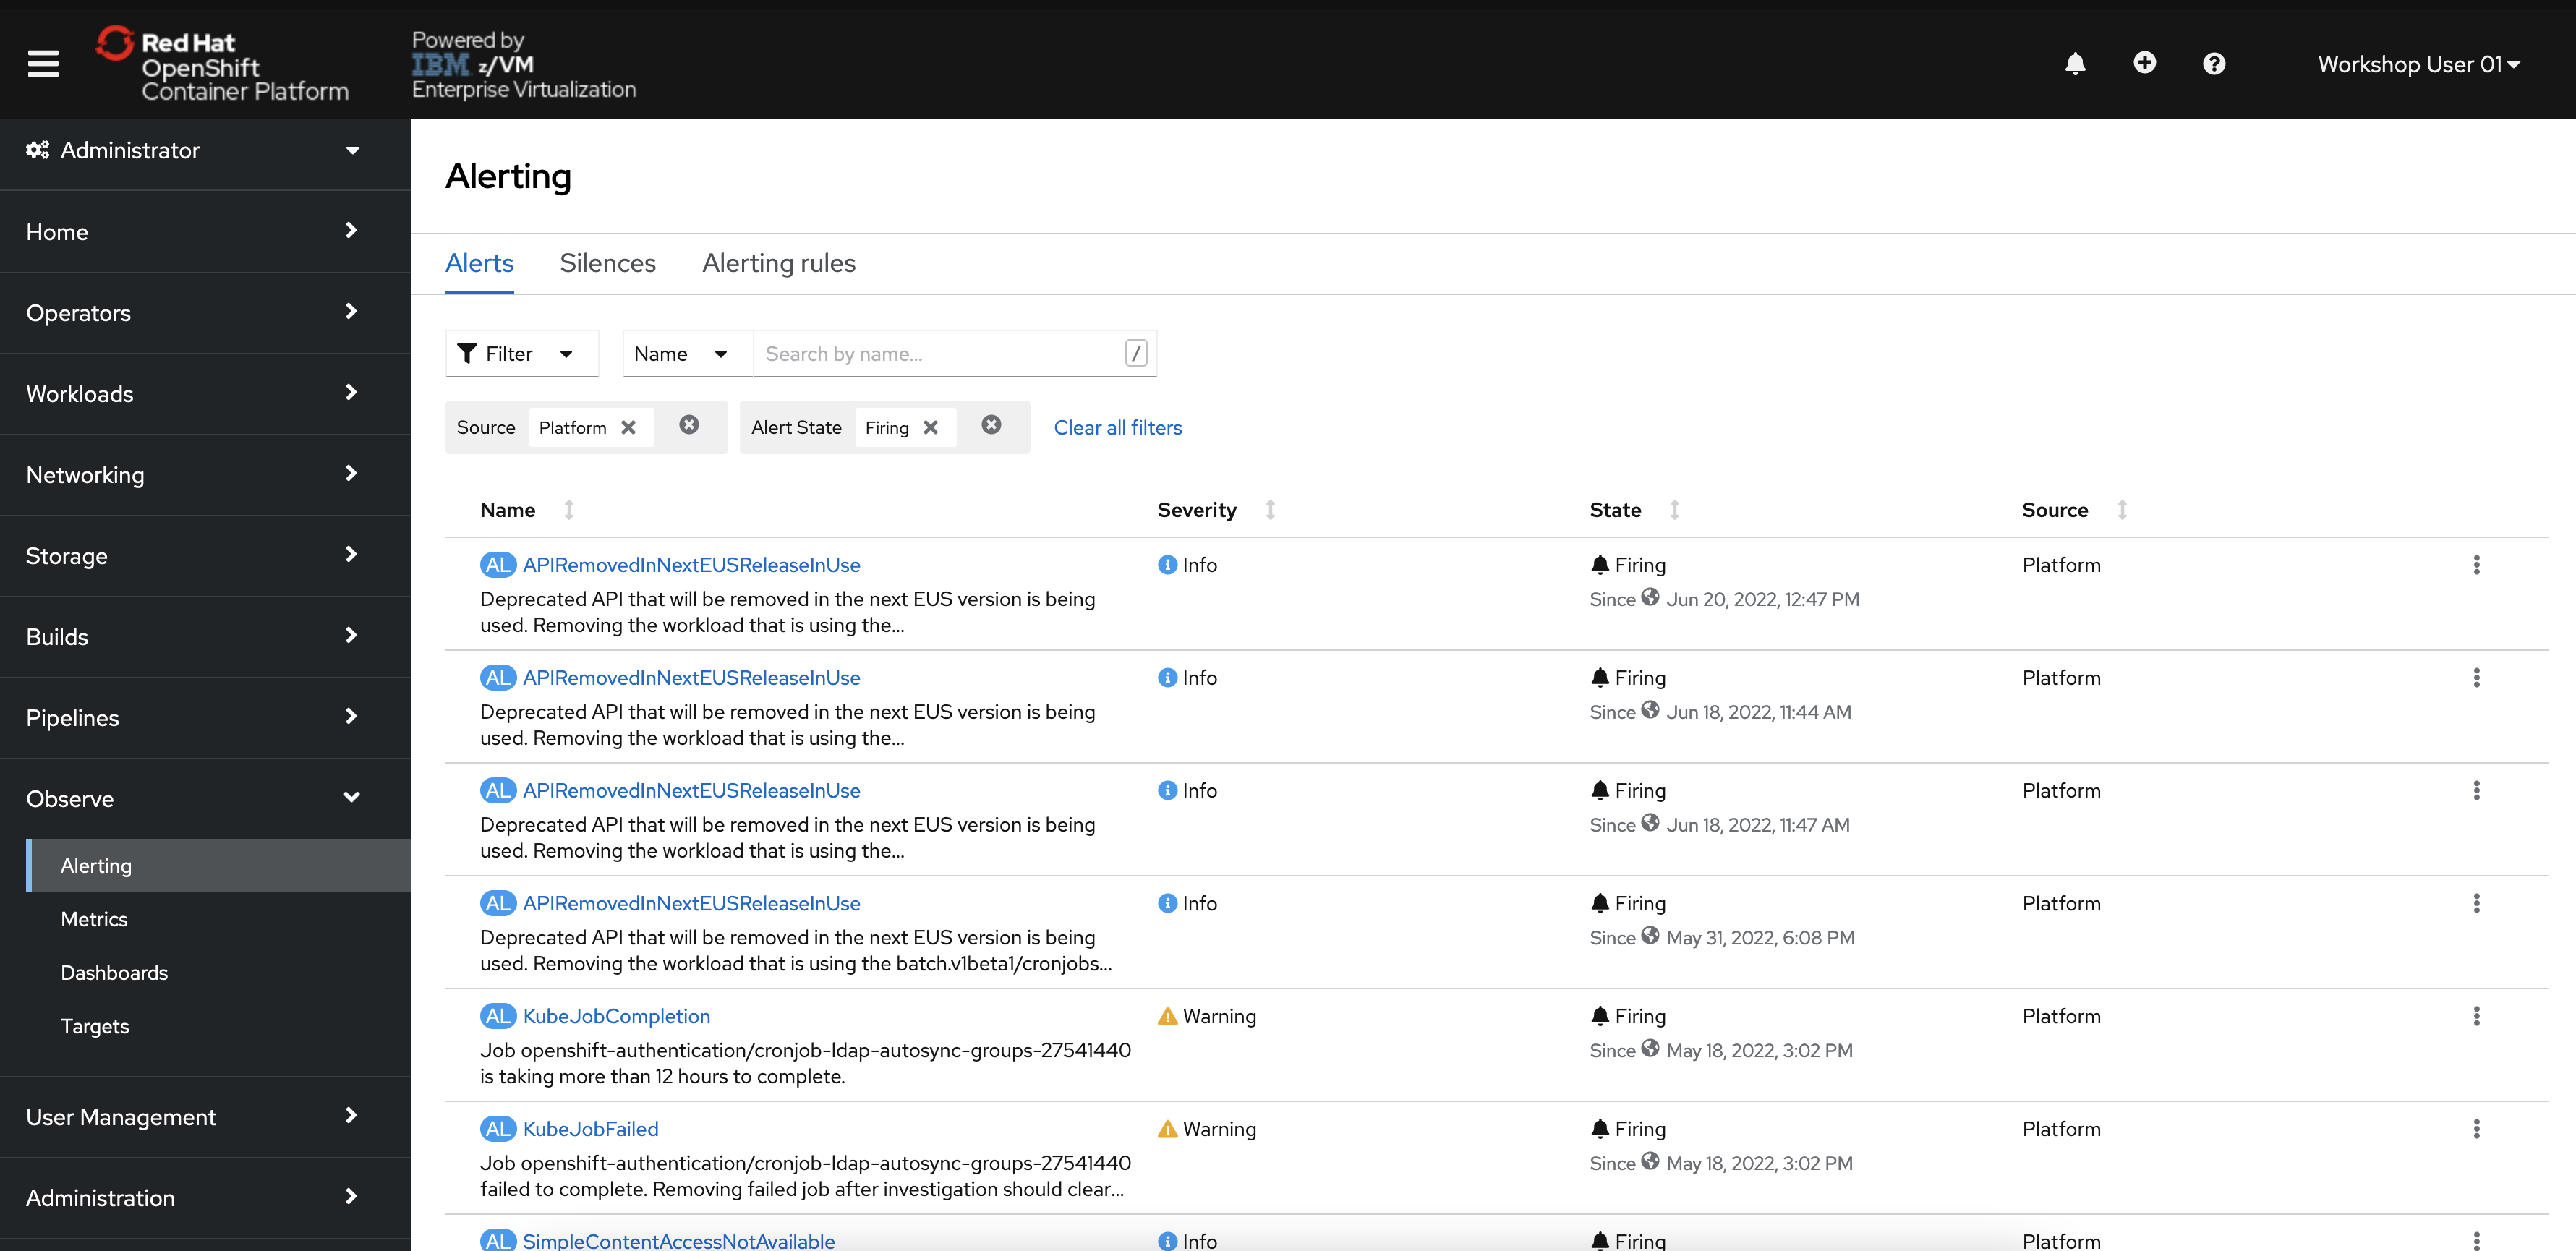
In the menu bar on the left side of the OpenShift console, click Observe and then Alerting.
You will be taken to an Alertmanager interface within the OpenShift console.
-
Click the Alerting Rules tab to see the 100+ alerts that are not currently firing (hopefully!)
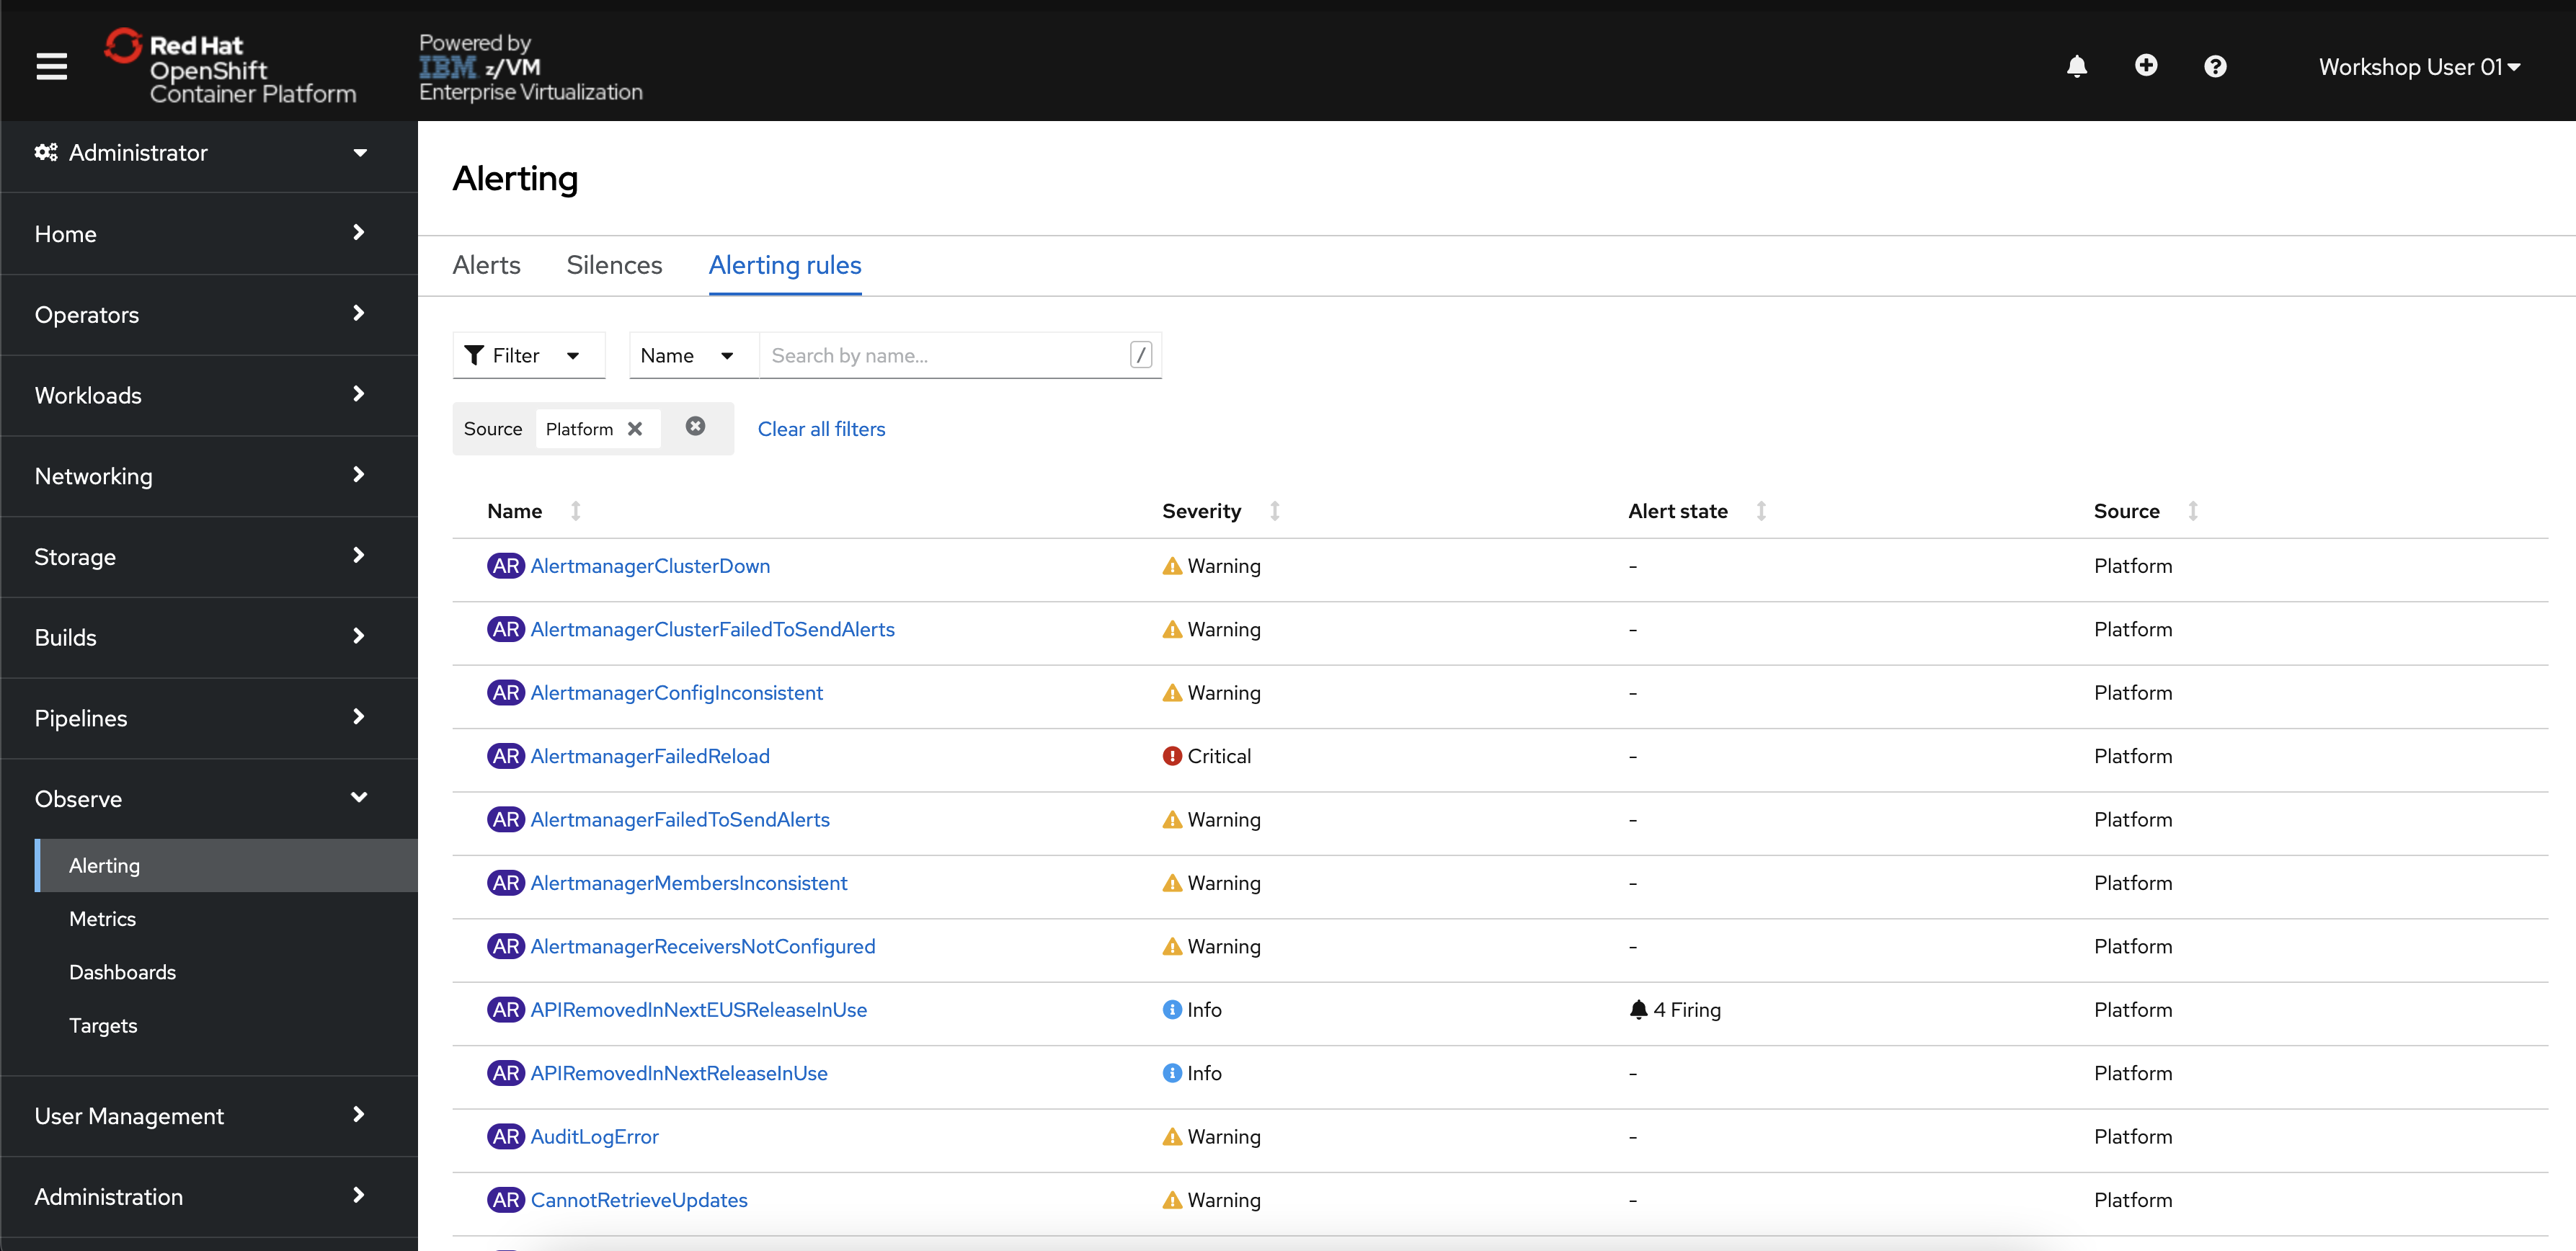
These alerts come pre-built with the monitoring stack, and they will start firing if triggered. This list includes alerts for critical operators going down, pods crash-looping, nodes being unreachable, and many more. Feel free to look through them.


These alerts are typically sent to an external tool where relevant administrators, developers, or site-reliability engineers will be notified that they are firing.
You cannot see and forwarded alerts for this OpenShift, but as an example, see the image below of a Slack alert generated by OpenShift alerting.

Once you're ready to clean up your OpenShift project, follow the instructions in this section.
-
Run the following command to clean up most of the objects in your project. Remember to change the value of
NN.oc delete all --all -n userNN-projectThis will delete some of the objects in your project, but it will not delete the secret you created.
-
Delete your secret with the following command.
oc delete secret nationalparks-mongodb-parameters -n userNN-project
To learn more about OpenShift Container Platform and see the additional tooling it provides to develop and manage more complex applications, please refer to the following links.
- OpenShift 4.14 Documentation
- OpenShift Product Page
- Red Hat Hybrid Cloud Blog
- OpenShift Learning
- OpenShift on IBM Z Datasheet
| Term | Definition |
|---|---|
| Deployment | A Kubernetes resource object that maintains the life cycle of an application. |
| Containers | Lightweight and executable images that consist software and all its dependencies. Because containers virtualize the operating system, you can run containers anywhere, from a data center to a public or private cloud to your local host. |
| Node | A worker machine in the OpenShift Container Platform cluster. A node is either a virtual machine (VM) or a physical machine. |
| Operator | The preferred method of packaging, deploying, and managing a Kubernetes application in an OpenShift Container Platform cluster. An Operator takes human operational knowledge and encodes it into software that is packaged and shared with customers. |
| OperatorHub | A platform that contains various OpenShift Container Platform Operators to install. |
| Pod | One or more containers with shared resources, such as volume and IP addresses, running in your OpenShift Container Platform cluster. A pod is the smallest compute unit defined, deployed, and managed. |
| Role-Based Access Control (RBAC) | A key security control to ensure that cluster users and workloads have only access to resources required to execute their roles. |
| Route | Routes expose a service to allow for network access to pods from users and applications outside the OpenShift Container Platform instance. |
| Service | A service exposes a running application on a set of pods. |
| serviceAccount | Object that provides an identity for processes running in a Pod. serviceAccounts authenticate against the Kubernetes API using their own credentials that are managed with Role-Based Access Control (RBAC). |