Project Overview
Data Pipelines project of the Data Engineering Udacity Nanodegree.
Introduction
At Sparkify, our app allows the user to stream music. We want to automatize and monitor our data warehouse ETL pipelines using Apache Airflow.
Scope of this repo is to build ETL Pipelines that are dynamic and built from reusable tasks, can be monitored and allow easy backfills. Finally, they allow to run tests against the dataset after the ETL steps have been executed.
The source data resides in S3 and needs to be processed in Sparkify's data warehouse in Amazon Redshift. The source datasets consist of JSON logs that tell about user activity in the application and JSON metadata about the songs the users listen to.
Dataset
Data reside in S3, in a directory of JSON logs on user activity on the app, as well as a directory with JSON metadata on the songs in their app.
Song Dataset
Sparkify song dataset (which truely is a subset of the real data from the Million Song Dataset) consists of files in JSON format and contains metadata about a song and the artist of that song. The files are partitioned by the first three letters of each song's track ID. For example, here are filepaths to two files in this dataset.
song_data/A/B/C/TRABCEI128F424C983.json
song_data/A/A/B/TRAABJL12903CDCF1A.json
And below is an example of what a single song file, TRAABJL12903CDCF1A.json, looks like.
{"num_songs": 1, "artist_id": "ARJIE2Y1187B994AB7", "artist_latitude": null, "artist_longitude": null, "artist_location": "", "artist_name": "Line Renaud", "song_id": "SOUPIRU12A6D4FA1E1", "title": "Der Kleine Dompfaff", "duration": 152.92036, "year": 0}Log Dataset
The user activity dataset consists of log files from our music streaming app in JSON format generated by the Sparkify app (Truely: event simulator) based on the songs in the dataset above.
These log files are partitioned by year and month. For example, here are filepaths to two files in this dataset.
log_data/2018/11/2018-11-12-events.json
log_data/2018/11/2018-11-13-events.json
And below is an example of what the data in a log file, 2018-11-12-events.json, looks like.

Redshift, S3, Airflow setup
Pipeline
The Pipeline consists of the following steps
- create DB and staging tables on the Redshift cluster
- extract data from S3 and store them into staging tables in Redshift
- rearrange the data of the staging tables into the fact and dimensions tables of the DB schema
- run test queries.
Files
The following files are needed for execution:
dags/udac_example_dag.pydefines the DAG and the pipeline. Relies on the operators defined in theoperatorsfolderplugins/operatorsfolder containing the operators used in the DAG:
stage_redshift.pystages the data from S3 to the staging tables for logs and songs, into redshiftload_fact.pyruns SQL queries stored in theplugins/helpers/sql_queries.pyfile to fill in the fact table from the staging tablesload_dimension.pyruns SQL queries stored in theplugins/helpers/sql_queries.pyfile to fill in the dimension table from the staging tablesdata_quality.pyruns the data check query passed as argument and compares its record with the expected one. If they differ, it raises an error
plugins/helpers/sql_queries.pycontains the SQL queries loaded indags/udac_example_dag.pyand used for filling the fact and dimension tables.
Database Schema
The Database schema contains the following tables
Fact Table
- songplays - records in log data associated with song plays i.e. records with page
NextSong
- songplay_id, start_time, user_id, level, song_id, artist_id, session_id, location, user_agent
Dimenson Tables
- users - users in the app
- user_id, first_name, last_name, gender, level
- songs - songs in music database
- *song_id, title, artist_id, year, duration
- artists - artists in music database
- artist_id, name, location, latitude, longitude
- times - timestamps of records in songplays broken down into specific units
- *start_time, hour, day, week, month, year, weekday
It is organised as a start schema, that simplifies queries about user activities. The Entity Relation Diagram is as follows
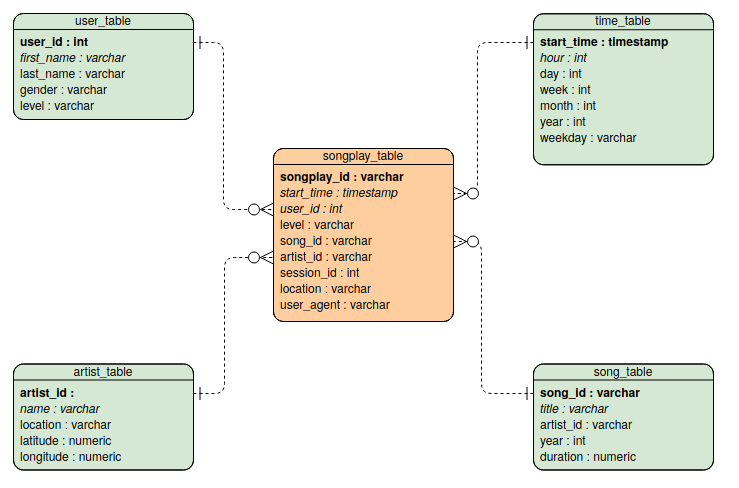

The diagram is generated using Visual Paradigm. Primary keys are in bold font. I did not manage to do-undo italics to distinguish numerical entries...
DAG configuration
The DAG is configured such that
- it does not have dependencies on past runs
- on failure, the tasks are retried 3 times
- retries happen every 5 minutes
- catchup is turned off
- it does not email on retry
The flow of the pipeline is as follows

Usage and configuration
A Redshift cluster needs to be setup for Airflow to execute the pipeline. The cluster needs to be made accessible for external use. After that is done, configure the AWS credentials and connection to Redshift from the Airflow Admin panel
AWS Credentials
- click on admin, then connections
- click on create and enter the following values
-- Conn Id:
redshift-- Conn Type:Postgres-- Host: the endpoint of the Redshift cluster, without the port and DB name -- Schema: the name of the DB entered when creating the Redshift cluster -- Login: the username chosen when creating the cluster -- Password: the password chosen when creating the cluster -- Port: 5439 - click on save
Redshift connection
- click on admin, then connections
- click on create and enter the following values
-- Conn Id:
aws_credentials-- Conn Type:Amazon Web Services-- Login: your Access key ID from the IAM User credentials -- Password: your Secret access key from the IAM User credentials - click on save
Starting the DAG
To start the DAG in Airflow
- Switch its state from OFF to ON
- Refresh the page and click on the
uda_example_dagto view the current state