PostgreSQL project in the Data Engineering Udacity Nanodegree.
At Sparkify, our app allows the user to stream music. We want to analyze the data on songs and user activity on their new music streaming app. In particular, we want to understand what songs users are listening to. This repository allows to create a Postgres database with tables designed to optimize queries on song play analyses.
Data reside in a directory of JSON logs on user activity on the app, as well as a directory with JSON metadata on the songs in their app.
Sparkify song dataset (which truely is a subset of the real data from the Million Song Dataset) consists of files in JSON format and contains metadata about a song and the artist of that song. The files are partitioned by the first three letters of each song's track ID. For example, here are filepaths to two files in this dataset.
song_data/A/B/C/TRABCEI128F424C983.json
song_data/A/A/B/TRAABJL12903CDCF1A.json
And below is an example of what a single song file, TRAABJL12903CDCF1A.json, looks like.
{"num_songs": 1, "artist_id": "ARJIE2Y1187B994AB7", "artist_latitude": null, "artist_longitude": null, "artist_location": "", "artist_name": "Line Renaud", "song_id": "SOUPIRU12A6D4FA1E1", "title": "Der Kleine Dompfaff", "duration": 152.92036, "year": 0}The user activity dataset consists of log files from our music streaming app in JSON format generated by the Sparkify app (Truely: event simulator) based on the songs in the dataset above.
These log files are partitioned by year and month. For example, here are filepaths to two files in this dataset.
log_data/2018/11/2018-11-12-events.json
log_data/2018/11/2018-11-13-events.json
And below is an example of what the data in a log file, 2018-11-12-events.json, looks like.

In addition to the data files, there are six files:
test.ipynbdisplays the first few rows of each table to check the database.create_tables.pydrops and creates the tables. It is used to reset the tables before running the ETL scripts.etl.ipynbreads and processes a single file fromsong_dataandlog_dataand loads the data into the tables. This notebook contains detailed instructions on the ETL process for each of the tables.etl.pyreads and processes files fromsong_dataandlog_dataand loads them into the tables. It can be filled out based on the ETL notebook.sql_queries.pycontains all the sql queries, and is imported into the last three files above.README.mdthis readme.
The Database schema contains the following tables
- songplays - records in log data associated with song plays i.e. records with page
NextSong
- songplay_id, start_time, user_id, level, song_id, artist_id, session_id, location, user_agent
- users - users in the app
- user_id, first_name, last_name, gender, level
- songs - songs in music database
- *song_id, title, artist_id, year, duration
- artists - artists in music database
- artist_id, name, location, latitude, longitude
- time - timestamps of records in songplays broken down into specific units
- *start_time, hour, day, week, month, year, weekday
It is organised as a start schema, that simplifies queries about user activities. The Entity Relation Diagram is as follows
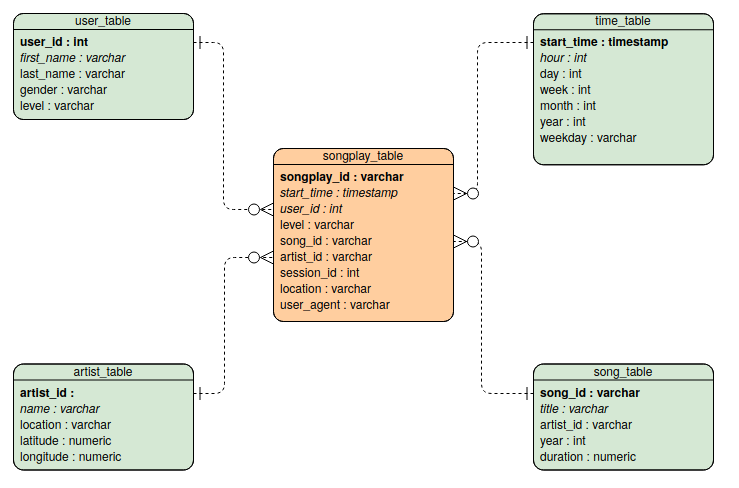

The diagram is generated using Visual Paradigm. Primary keys are in bold font. I did not manage to do-undo italics to distinguish numerical entries...
The ETL Pipeline is executed by running the etl.py file. It transfers data from files in two local directories into these tables in Postgres using Python and SQL. This is done by executing two similar functions, process_log_file and process_song_file. The PostgreSQL queries for creating and inserting data are written out in the sql_queries.py file.
This function is applied to each .json file representing an element of our song dataset.
- Read the file as pandas dataframe
- Extract song data and insert them into the user_table
This function is applied to each .json file representing the activity on the app.
- Read the file as a pandas dataframe
- Filter by NextSong
- Convert timestamp column to datetime format
- Split datetime to hour, day, week, month, year, weekday
- Extract user data and insert them into the user_table
- Extract songplay records (by querying the song_table and artist_table) and insert them into the songplay_table
- Run
create_tables.pyto create thesparkifydb. This is the database to which the other files connect. - Run
etl.pyprocess the data and insert them into the database.
Example queries for each of the tables can be found in the test.ipynb file. As additional example, here's a query for checking on which day of the week a specific song, displayed by title, was played
SELECT  s.title, t.weekday
FROM songplay_table AS sp JOIN song_table AS s ON sp.song_id=s.song_id
                        JOIN time_table AS t ON sp.start_time=t.start_time
This should return
| title | weekday |
|---|---|
| Setanta matins | 2 |