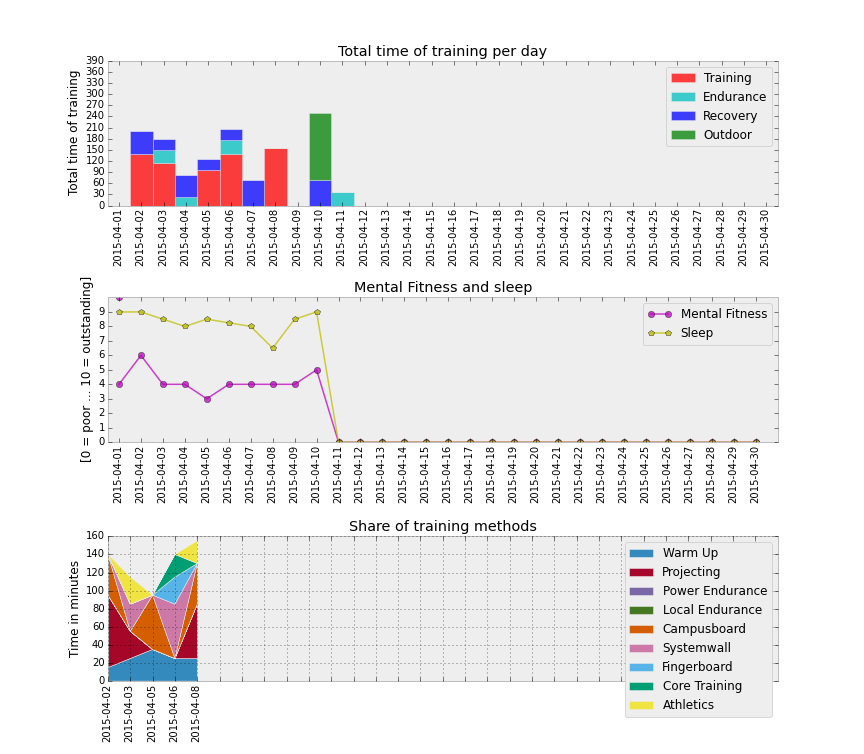
This is a small command line tool, which visualizes climbing training statistics. This little command line tool
reads a .xls-file, which is specified by --input /path/to/xlsfile and generates a PDF or SVG, which
visualizes the data in an appealing way. The .xls-file has to be in a certain form. A template can be found
here link.
Charts and graphs are built with matplotlib. The visualization of the training data should help
keeping track of the invested effort, seeing correlations and analyzing for improvements.

- support of Google Spreadsheets
- improvement of PDF rendering
- improvement of the plotting
- fine tuning of captured training data (maybe it should be extended by HRV, food intake, etc...)