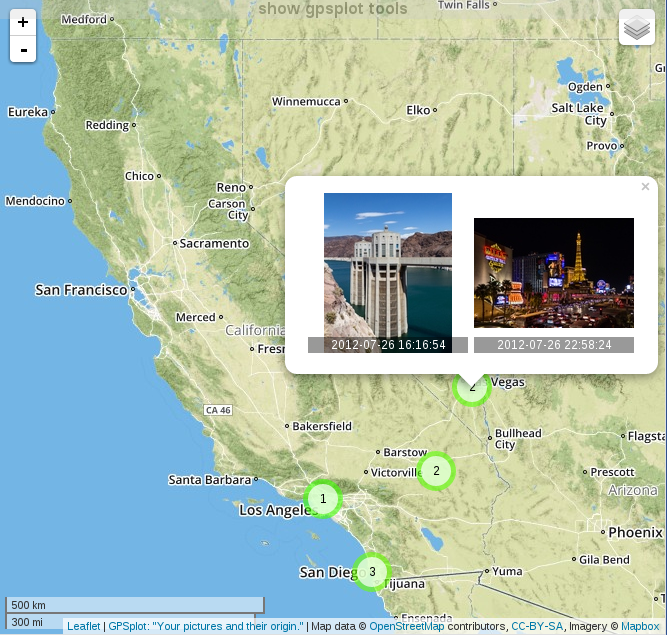
"Your pictures and their origin."
Display on a map where your photos were taken.
A live demo can be found at https://mnagel.github.io/gpsplot/
Photography: (c) Dietmar Rabich, rabich.de, CC BY-SA 4.0, Wikimedia Commons.
-
images are diplayed on an interactive map
-
extraction of exif metadata
-
heuristic location detection
-
location based dynamic clustering
-
time based filtering via histogram
-
fullscreen slideshow of selected images
-
image location heatmap
-
local preprocessing in python
-
browser-based javascript runtime
-
tested on Linux and Windows
-
optional go server
-
images are not uploaded to the cloud
No special installation is required. You need python and a browser.
You can run bash doc/demo.sh to download some pictures to run a demo.
- place all pictures you want to plot in
./data/img/or look at the--inputdir $FOLDERargument. - run the python program to create the html page:
python preproc.py - open the resulting
index.htmlin your browser
- Leaflet: https://github.com/Leaflet/Leaflet
- Leaflet Markercluster: https://github.com/Leaflet/Leaflet.markercluster
- Lightbox: https://github.com/lokesh/lightbox2/
- Flotr2: https://github.com/HumbleSoftware/Flotr2
- Leaflet Heatmap: https://github.com/Leaflet/Leaflet.heat
- date.format: https://github.com/jacwright/date.format
- jQuery: https://github.com/jquery/jquery
GNU GPL v3+
