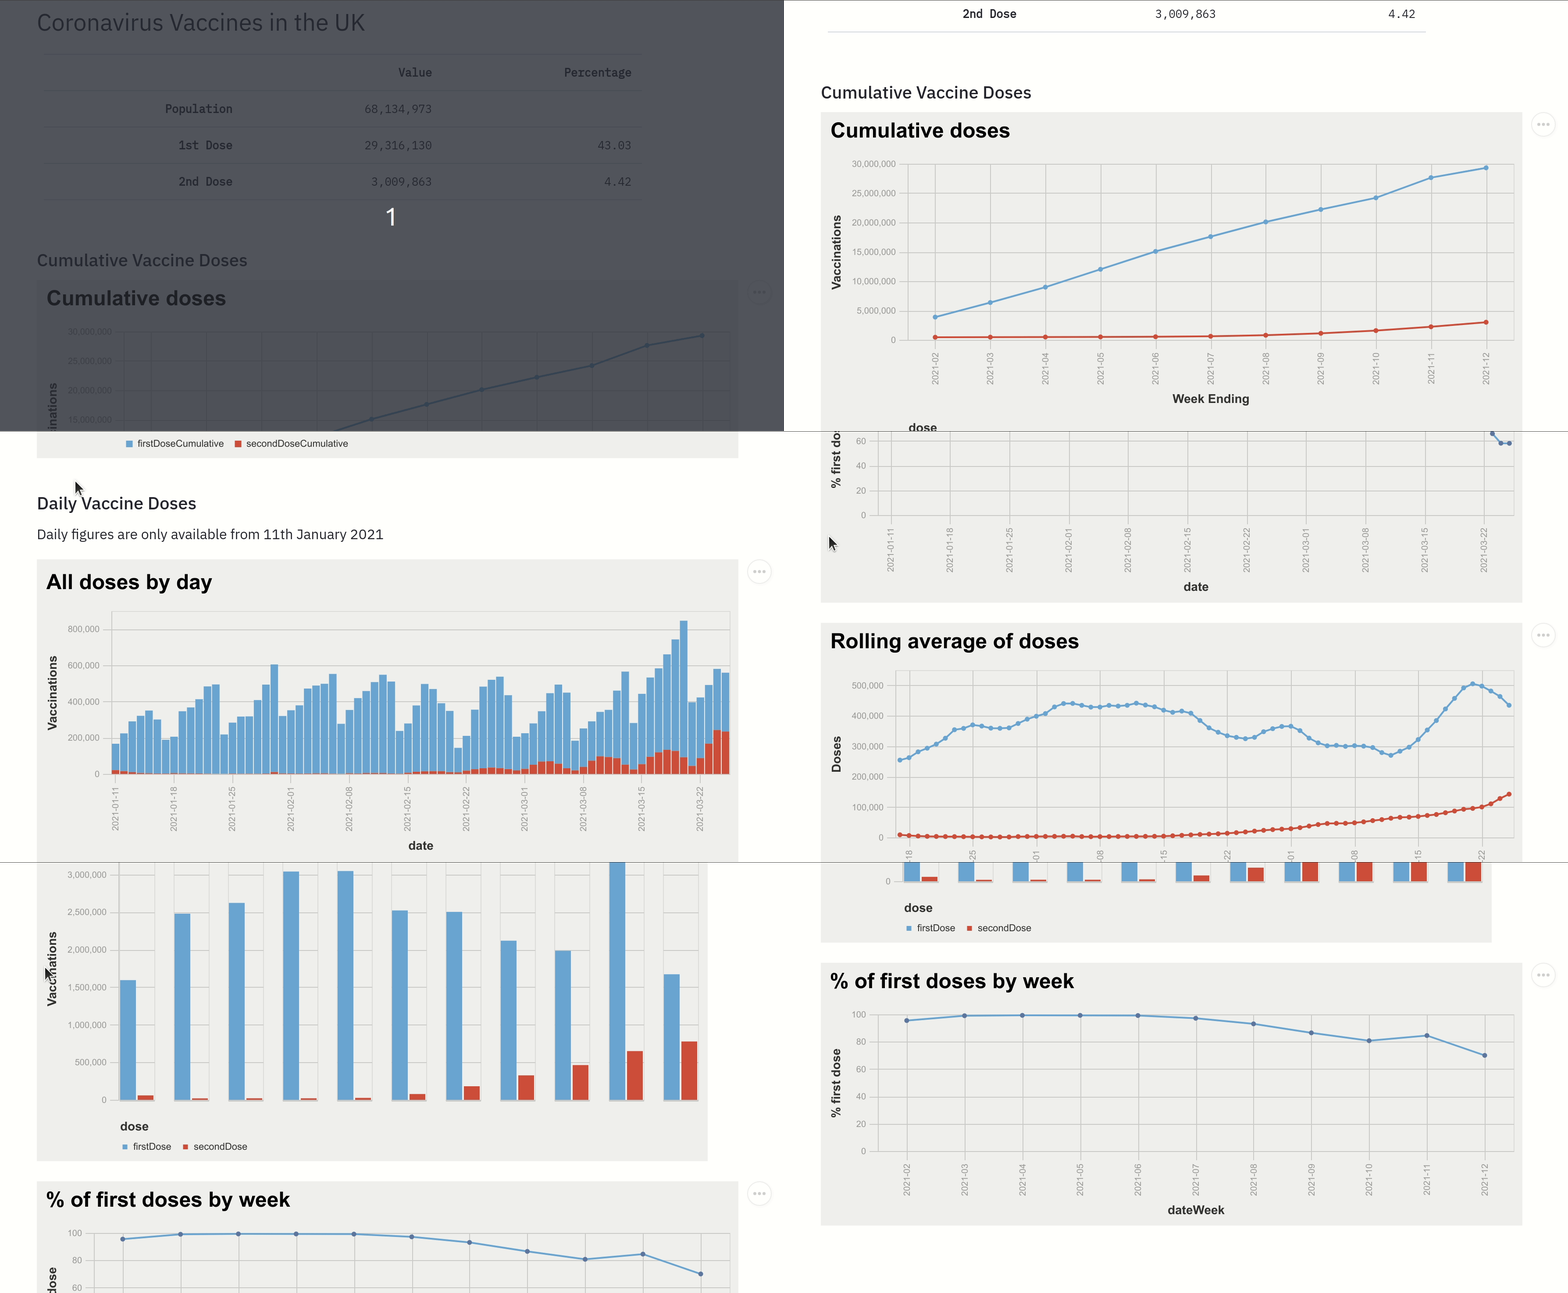
This is a Streamlit application that makes it easier to visualise the number of COVID-19 vaccinations done in the UK across different dimensions.
It is deployed at https://share.streamlit.io/mneedham/covid-vaccines/main/app.py
If you want to try it out, you’ll need to first clone the repository:
git clone git@github.com:mneedham/covid-vaccines.git
cd covid-vaccinesI use pipenv to manage my projects. If you do too, you can install dependencies by running the following command:
pipenv shellIf not, you can install the dependencies using pip directly, as shown below:
pip install pandas streamlit xlrd openpyxl altairOnce you have the dependencies install, you can launch the Streamlit app using the following command:
streamlit run app.pyYou should see output similar to the following:
  You can now view your Streamlit app in your browser.

  Local URL: http://localhost:8501
  Network URL: http://192.168.86.26:8501
Now, navigate to http://localhost:8501 to view the app. If everything has worked, you should see something like the screenshot below:
The data is in the data directory and was downloaded from https://coronavirus.data.gov.uk/details/vaccinations.
-
The data for "People who have received 1st dose vaccinations, by report date" is saved as
data/data_<date>-dose1.csv -
The data for "People who have received 2nd dose vaccinations, by report date" is saved as
data/data_<date>-dose2.csv
