Data and Machine Learning Common Terminology
In this repository I added most common Data and ML terminology you should know about it in this technology domain.
The terminology list is in alphabetical order to simplify searching for any term.
The list is not yet completed and still in progress🔜
Accuracy
The number of correct classification predictions divided by the total number of predictions. That is:
For example, a model that made 40 correct predictions and 10 incorrect predictions would have an accuracy of:
Activation Function
A function that enables neural networks to learn nonlinear (complex) relationships between features and the label.
Popular activation functions include:
- ReLU
- Sigmoid
The plots of activation functions are never single straight lines. For example, the plot of the ReLU activation function consists of two straight lines:
Artificial General Intelligence
A non-human mechanism that demonstrates a broad range of problem solving, creativity, and adaptability. For example, a program demonstrating artificial general intelligence could translate text, compose symphonies, and excel at games that have not yet been invented.
AutoML
Any automated process for building machine learning models. AutoML can automatically do tasks such as the following:
- Search for the most appropriate model.
- Tune hyperparameters.
- Prepare data (including performing feature engineering).
- Deploy the resulting model.
AutoML is useful for data scientists because it can save them time and effort in developing machine learning pipelines and improve prediction accuracy. It is also useful to non-experts, by making complicated machine learning tasks more accessible to them.
Backpropagation
The algorithm that implements gradient descent in neural networks.
Training a neural network involves many iterations of the following two-pass cycle:
- During the forward pass, the system processes a batch of examples to yield prediction(s). The system compares each prediction to each label value. The difference between the prediction and the label value is the loss for that example. The system aggregates the losses for all the examples to compute the total loss for the current batch.
- During the backward pass (backpropagation), the system reduces loss by adjusting the weights of all the neurons in all the hidden layer(s).
Batch
The set of examples used in one training iteration. The batch size determines the number of examples in a batch.
BERT (Bidirectional Encoder Representations from Transformers)
A model architecture for text representation. A trained BERT model can act as part of a larger model for text classification or other ML tasks.
BERT has the following characteristics:
- Uses the Transformer architecture, and therefore relies on self-attention.
- Uses the encoder part of the Transformer. The encoder's job is to produce good text representations, rather than to perform a specific task like classification.
- Is bidirectional.
- Uses masking for unsupervised training.
Bigram
An N-gram in which N=2.
Binary Classification
A type of classification task that predicts one of two mutually exclusive classes:
- the positive class
- the negative class
For example, the following two machine learning models each perform binary classification:
- A model that determines whether email messages are spam (the positive class) or not spam (the negative class).
- A model that evaluates medical symptoms to determine whether a person has a particular disease (the positive class) or doesn't have that disease (the negative class).
Bounding Box
In an image, the (x, y) coordinates of a rectangle around an area of interest, such as the dog in the image below.
Categorical Data
Features having a specific set of possible values. For example, consider a categorical feature named traffic-light-state, which can only have one of the following three possible values:
- red
- yellow
- green
By representing traffic-light-state as a categorical feature, a model can learn the differing impacts of red, green, and yellow on driver behavior.
Class
A category that a label can belong to. For example:
- In a binary classification model that detects spam, the two classes might be spam and not spam.
- In a multi-class classification model that identifies dog breeds, the classes might be poodle, beagle, pug, and so on.
Classification Model
A model whose prediction is a class. For example, the following are all classification models:
-
A model that predicts an input sentence's language (French? Spanish? Italian?).
-
A model that predicts the positive or negative class for a particular medical condition.
In contrast, regression models predict numbers rather than classes.
Two common types of classification models are:
- binary classification
- multi-class classification
Classification Threshold
In a binary classification, a number between 0 and 1 that converts the raw output of a logistic regression model into a prediction of either the positive class or the negative class. Note that the classification threshold is a value that a human chooses, not a value chosen by model training.
A logistic regression model outputs a raw value between 0 and 1. Then:
- If this raw value is greater than the classification threshold, then the positive class is predicted.
- If this raw value is less than the classification threshold, then the negative class is predicted.
For example, suppose the classification threshold is 0.8. If the raw value is 0.9, then the model predicts the positive class. If the raw value is 0.7, then the model predicts the negative class.
Clustering
Grouping related examples, particularly during unsupervised learning. Once all the examples are grouped, a human can optionally supply meaning to each cluster.
Many clustering algorithms exist. For example, the k-means algorithm clusters examples based on their proximity to a centroid, as in the following diagram:
Confusion Matrix
An NxN table that summarizes the number of correct and incorrect predictions that a classification model made. For example, consider the following confusion matrix for a binary classification model:
| Tumor (predicted) | Non-Tumor (predicted) | |
|---|---|---|
| Tumor (ground truth) | 18 (TP) | 1 (FN) |
| Non-Tumor (ground truth) | 6 (FP) | 452 (TN) |
The preceding confusion matrix shows the following:
- Of the 19 predictions in which ground truth was Tumor, the model correctly classified 18 and incorrectly classified 1.
- Of the 458 predictions in which ground truth was Non-Tumor, the model correctly classified 452 and incorrectly classified 6.
Continuous Feature
A floating-point feature with an infinite range of possible values, such as temperature or weight.
Convolution
In mathematics, casually speaking, a mixture of two functions. In machine learning, a convolution mixes the convolutional filter and the input matrix in order to train weights.
The term "convolution" in machine learning is often a shorthand way of referring to either convolutional operation or convolutional layer.
Convolutional Layer
A layer of a deep neural network in which a convolutional filter passes along an input matrix.
Convolutional Neural Network
A neural network in which at least one layer is a convolutional layer. A typical convolutional neural network consists of some combination of the following layers:
- convolutional layers
- pooling layers
- dense layers
Convolutional neural networks have had great success in certain kinds of problems, such as image recognition.
cross-entropy
A generalization of Log Loss to multi-class classification problems. Cross-entropy quantifies the difference between two probability distributions.
cross-validation
A mechanism for estimating how well a model would generalize to new data by testing the model against one or more non-overlapping data subsets withheld from the training set.
Data Augmentation
Artificially boosting the range and number of training examples by transforming existing examples to create additional examples. For example, suppose images are one of your features, but your dataset doesn't contain enough image examples for the model to learn useful associations. Ideally, you'd add enough labeled images to your dataset to enable your model to train properly. If that's not possible, data augmentation can rotate, stretch, and reflect each image to produce many variants of the original picture, possibly yielding enough labeled data to enable excellent training.
DataFrame
A popular pandas datatype for representing datasets in memory.
A DataFrame is analogous to a table or a spreadsheet. Each column of a DataFrame has a name (a header), and each row is identified by a unique number.
Each column in a DataFrame is structured like a 2D array, except that each column can be assigned its own data type.
Data Set or Dataset
A collection of raw data, commonly (but not exclusively) organized in one of the following formats:
- a spreadsheet
- a file in CSV (comma-separated values) format
Decision Boundary
The separator between classes learned by a model in a binary class or multi-class classification problems. For example, in the following image representing a binary classification problem, the decision boundary is the frontier between the orange class and the blue class:
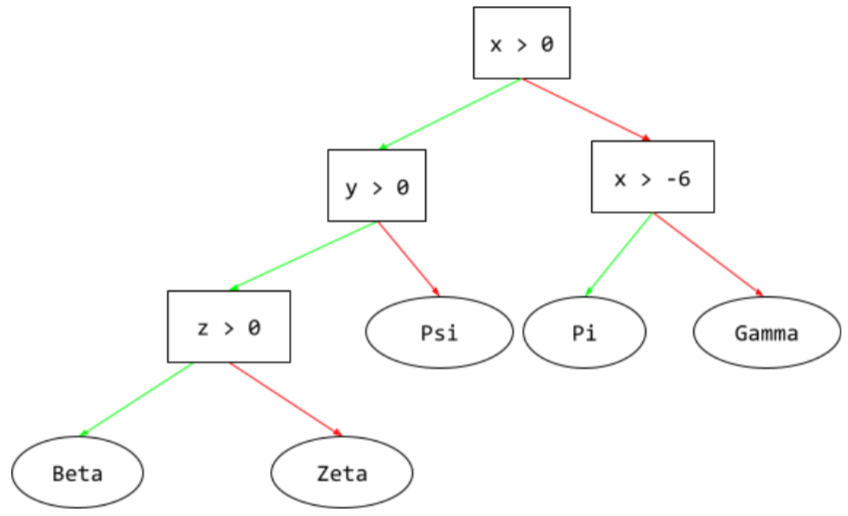
Decision Tree
A supervised learning model composed of a set of conditions and leaves organized hierarchically. For example, the following is a decision tree:
Deep Neural Network
A neural network containing more than one hidden layer.
A deep neural networkis also called a deep model.
Depth
The sum of the following in a neural network:
- the number of hidden layers
- the number of output layers, which is typically 1
- the number of any embedding layers
For example, a neural network with five hidden layers and one output layer has a depth of 6.
Notice that the input layer doesn't influence depth.
Dense Layer
A hidden layer in which each node is connected to every node in the subsequent hidden layer.
A fully connected layer is also known as a dense layer.
Dense Feature
A feature in which most or all values are nonzero, typically a Tensor of floating-point values.
Downsampling
Overloaded term that can mean either of the following:
- Reducing the amount of information in a feature in order to train a model more efficiently. For example, before training an image recognition model, downsampling high-resolution images to a lower-resolution format.
- Training on a disproportionately low percentage of over-represented class examples in order to improve model training on under-represented classes. For example, in a class-imbalanced dataset, models tend to learn a lot about the majority class and not enough about the minority class. Downsampling helps balance the amount of training on the majority and minority classes.
Dynamic Model
A model that is frequently (maybe even continuously) retrained. A dynamic model is a "lifelong learner" that constantly adapts to evolving data. A dynamic model is also known as an online model.
Embedding Layer
A special hidden layer that trains on a high-dimensional categorical feature to gradually learn a lower dimension embedding vector. An embedding layer enables a neural network to train far more efficiently than training just on the high-dimensional categorical feature.
Entropy
In information theory, a description of how unpredictable a probability distribution is. Alternatively, entropy is also defined as how much information each example contains. A distribution has the highest possible entropy when all values of a random variable are equally likely.
The entropy of a set with two possible values "0" and "1" (for example, the labels in a binary classification problem) has the following formula:
H = -p log p - q log q = -p log p - (1-p) * log (1-p)
where:
- H is the entropy.
- p is the fraction of "1" examples.
- q is the fraction of "0" examples. Note that q = (1 - p)
- log is generally log2. In this case, the entropy unit is a bit.
For example, suppose the following:
- 100 examples contain the value "1"
- 300 examples contain the value "0"
Therefore, the entropy value is:
- p = 0.25
- q = 0.75
- H = (-0.25)log2(0.25) - (0.75)log2(0.75) = 0.81 bits per example
A set that is perfectly balanced (for example, 200 "0"s and 200 "1"s) would have an entropy of 1.0 bit per example. As a set becomes more imbalanced, its entropy moves towards 0.0.
In decision trees, entropy helps formulate information gain to help the splitter select the conditions during the growth of a classification decision tree.
Compare entropy with:
- gini impurity
- cross-entropy loss function
Entropy is often called Shannon's entropy.
Epoch
A full training pass over the entire training set such that each example has been processed once.
An epoch represents N/batch size training iterations, where N is the total number of examples.
For instance, suppose the following:
- The dataset consists of 1,000 examples.
- The batch size is 50 examples.
Therefore, a single epoch requires 20 iterations:
1 epoch = (N/batch size) = (1,000 / 50) = 20 iterations
Example
The values of one row of features and possibly a label. Examples in supervised learning fall into two general categories:
- A labeled example consists of one or more features and a label. Labeled examples are used during training.
- An unlabeled example consists of one or more features but no label. Unlabeled examples are used during inference.
For instance, suppose you are training a model to determine the influence of weather conditions on student test scores. Here are three labeled examples:
| Features | Label | ||
|---|---|---|---|
| Temperature | Humidity | Pressure | Test score |
| 15 | 47 | 998 | Good |
| 19 | 34 | 1020 | Excellent |
| 18 | 92 | 1012 | Poor |
Here are three unlabeled examples:
| Temperature | Humidity | Pressure |
|---|---|---|
| 12 | 62 | 1014 |
| 21 | 47 | 1017 |
| 19 | 41 | 1021 |
The row of a dataset is typically the raw source for an example. That is, an example typically consists of a subset of the columns in the dataset.


