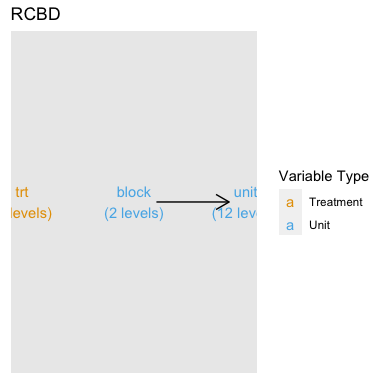
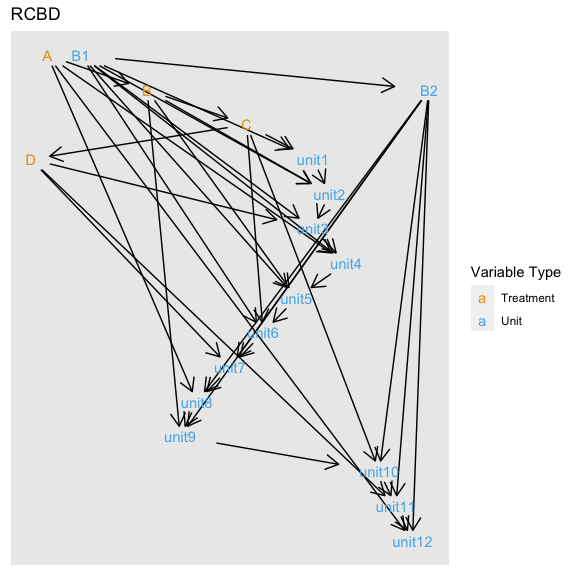
The aim for deggust R-package is to visualise designs constructed from edibble R-package. The visualisation are ggplot graphics.
(WIP)
The development version from GitHub with:
# install.packages("devtools")
devtools::install_github("emitanaka/deggust")library(ggplot2)
library(edibble)
library(deggust)Automatic look into the design layout:
unit1 <- start_design(name = "One unit") %>%
    set_trts(trt = 4) %>%
    set_units(unit = 16) %>%
    allocate_trts(trt ~ unit) %>%
    randomise_trts() %>%
    serve_table()

autoplot(unit1)
Easy to replace the unit shape:
autoplot(unit1, shape = "box")autoplot(unit1, shape = "triangle")autoplot(unit1, shape = "hexagon",
text = element_text(size = 6,
color = "gray",
face = "bold"))
#> Warning: Ignoring unknown parameters: inherit.blankset.seed(1231)
rcbd <- start_design(name = "RCBD") %>%
set_units(block = c("B1", "B2"),
unit = nested_in(block, 6)) %>%
set_trts(trt = LETTERS[1:4]) %>%
allocate_trts(~unit) %>%
randomise_trts()autoplot(rcbd)
#> Multiple parents. Unfolding graph
#> Multiple roots in graph. Choosing the first
#> Using `stress` as default layoutautoplot(rcbd, view = "low")
#> Using `sugiyama` as default layoutdesplotfor visualising designsExploreModelMatrixfor exploring design matrixezfor easy analysis and visualization of factorial experiments


