| Details | |
|---|---|
| Target OS: | Ubuntu* 18.04 LTS |
| Programming Language: | C++ |
| Time to Complete: | 45 min |
This reference implementation is developed using the Intel® Distribution of OpenVINO™ toolkit for audience analytics and Intel® Media SDK for the display of 4K advertisements. The application identifies the age and gender of the audience standing in front of digital signage, and based on the identification, it selects a suitable 4K advertisement. Real-time data visualization, which enables developers to monitor trends over time, occurs on Grafana*. This reference implementation aims to improve real-world marketing and advertising.
- Ubuntu* 18.04 LTS
- Intel® Distribution of OpenVINO™ toolkit 2020 R3 release
- Intel® Media SDK
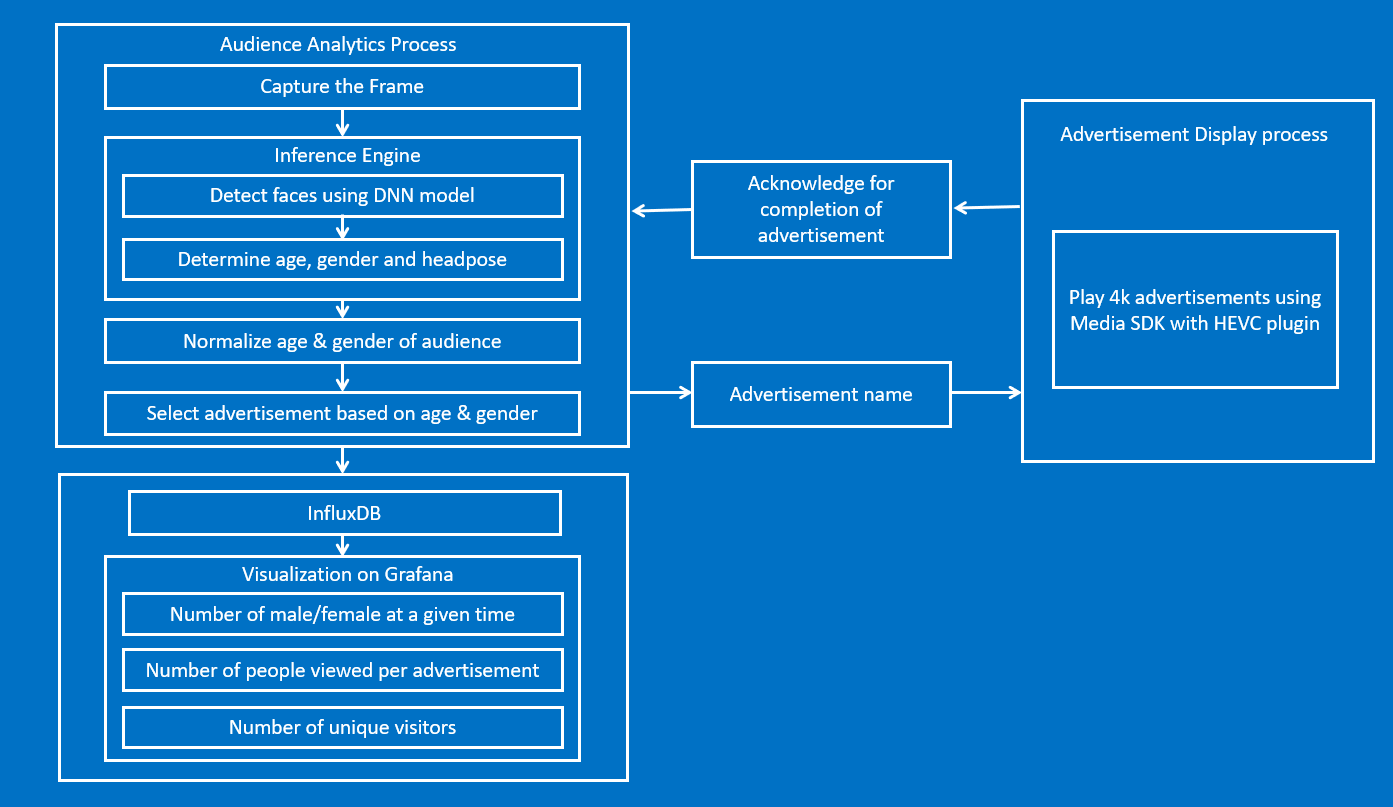
The application uses a video source, such as a camera to grab frames, and Deep Neural Networks (DNNs) to process data. The first network detects faces. The second neural network determines age and gender for each detected face. The third neural network detects the head pose of the person.
The application observes the age, gender, and head pose of the person standing in front of the digital signage camera and collects data for five frames. Data are normalized to avoid any fluctuations in the observation. Based on normalized data, the application selects a gender-appropriate advertisement.
A JSON file provides a list of advertisements for different age and gender groups. This JSON file is parsed, and data present in the file such as age group, gender, and a list of advertisements, are stored in a C++ structure. Once the software determines the dominant age-group and gender from the audience analytics, it selects an ad from JSON data, which is decoded using the HEVC plugin and played using Intel® Media SDK.
This application has two processes, the audience analytics process (AAP) and the advertisement display process (ADP). These processes use pipes for inter-process communication.
The AAP analyzes the audience, selects the appropriate ad, and writes the selected ad to the pipe, which the ADP reads from the other end of the pipe. The ADP reads the file name from the pipe, decodes the video which is in H.265 or hevc format, and renders it. Once the advertisement finishes playing, the ADP sends the acknowledgement of ad completion through the pipe to AAP. On receiving the acknowledgement, AAP selects the next ad based on the audience present at that time and sends it to ADP. The new advertisement plays only when the previous advertisement has completed.
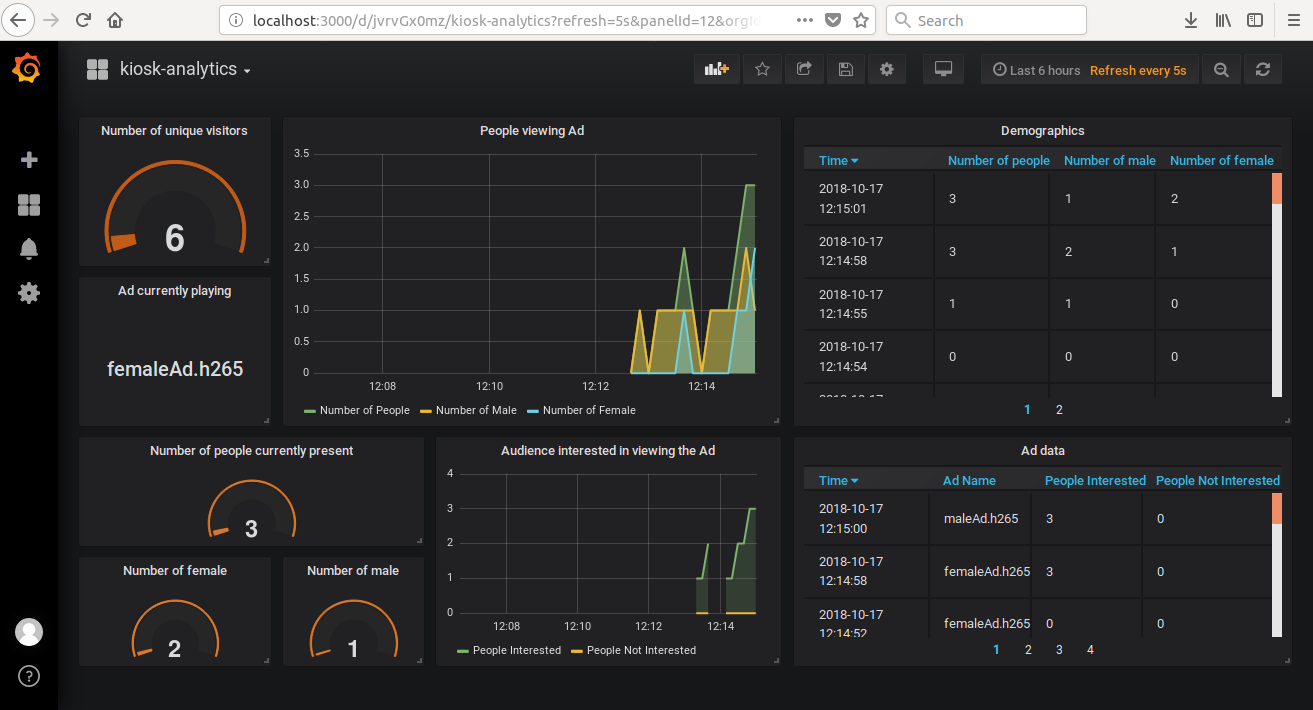
The audience analysis happens even when an ad is playing as the two processes run in parallel. For every 20 frames, the application sends data to the InfluxDB database which is then visualized on Grafana to display the trends over time. Grafana visualizes the number of people who were interested in ads, the number of people not interested in ads, the ad currently playing, and the total number of unique visitors who were in front of the digital signage.
Clone the reference implementation
sudo apt-get update && sudo apt-get install git
git clone https://github.com/intel-iot-devkit/intelligent-kiosk-analytics-cpp.git
Refer to Install the Intel® Distribution of OpenVINO™ toolkit for Linux* for more information about how to install and setup the Intel® Distribution of OpenVINO™ toolkit.
Install the OpenCL™ Runtime Package to run inference on the GPU, as shown in the instructions below. It is not mandatory for CPU inference.
Intel® Media SDK
Intel® Media SDK provides a plain C API to access hardware-accelerated video decode, encode and filtering on Intel® Gen graphics hardware platforms.
InfluxDB*
InfluxDB is a time series database designed to handle high write and query loads. InfluxDB is meant to be used as a backing store for any use case involving large amounts of timestamped data, including DevOps monitoring, application metrics, IoT sensor data, and real-time analytics.
Grafana*
Grafana is an open-source, general purpose dashboard and graph composer, which runs as a web application. It supports Graphite, InfluxDB, Prometheus, OpenTSDB etc., as backends. Grafana allows you to query, visualize, alert on and understand your metrics no matter where they are stored.
This application uses the face-detection-retail-0004, age-gender-recognition-retail-0013 and head-pose-estimation-adas-0001 Intel® models, that can be downloaded using the model downloader. The model downloader downloads the .xml and .bin files that will be used by the application.
To download the models and install the dependencies of the application, run the below command in intelligent-kiosk-analytics-cpp directory:
./setup.sh
The resources/config.json contains the path of video that will be used by the application as input.
For example:
{
    "inputs": [
       {
           "video":"path_to_video/video1.mp4",
       }
    ]
}
The path/to/video is the path to an input video file.
The application works with any input video. Sample videos are provided here.
For first-use, we recommend using face-demographics-walking-and-pause.
For example:
{
    "inputs": [
       {
           "video":"sample-videos/face-demographics-walking-and-pause.mp4",
       }
    ]
}
If the user wants to use any other video, it can be used by providing the path in the config.json file.
Replace path/to/video with the camera ID in the config.json file, where the ID is taken from the video device (the number X in /dev/videoX).
On Ubuntu, to list all available video devices use the following command:
ls /dev/video*
For example, if the output of above command is /dev/video0, then config.json would be:
  {
     "inputs": [
        {
           "video":"0"
        }
     ]
  }
Go to the project directory:
cd <path-to-intelligent-kiosk-analytics-cpp>
Configure the environment to use the Intel® Distribution of OpenVINO™ toolkit by exporting environment variables:
source /opt/intel/openvino/bin/setupvars.sh
To build, go to intelligent-kiosk-analytics-cpp directory and run the following commands:
mkdir -p build && cd build
cmake ..
make
Although the application runs on the CPU by default, this can also be explicitly specified through the -d CPU -d_hp CPU -d_ag CPU as command-line argument:
__bin/Release/application -m /opt/intel/openvino_2020.3.194/deployment_tools/open_model_zoo/tools/downloader/intel/face-detection-retail-0004/FP32/face-detection-retail-0004.xml -m_ag /opt/intel/openvino_2020.3.194/deployment_tools/open_model_zoo/tools/downloader/intel/age-gender-recognition-retail-0013/FP32/age-gender-recognition-retail-0013.xml -m_hp /opt/intel/openvino_2020.3.194/deployment_tools/open_model_zoo/tools/downloader/intel/head-pose-estimation-adas-0001/FP32/head-pose-estimation-adas-0001.xml
In addition to the model provided by the Intel® Distribution of OpenVINO™ toolkit, the user can include models trained on Caffe*, TensorFlow*, or Apache MXNet* machine learning frameworks for face-detection, age-gender recognition, or head pose. To do this, first configure the model optimizer for the framework used and then convert the trained model to produce an optimized Intermediate Representation (IR) of the model.
Learn more about the model optimizer in the Model Optimizer Developer Guide
Once the IR is obtained, run the application:
__bin/Release/application -m <path-to-face-detection-IR>/face-detection.xml -m_ag <path-to-age-gender-IR>/age-gender-recognition.xml -m_hp <path-to-head-pose-estimation-IR>/head-pose-estimation.xml
Note:
- To exit from the application, click on the Detection results window and long press the ESC key.
- To run the application on sync mode, use
-async 0as the command-line argument. By default the application runs on Async mode. - To run with multiple devices use MULTI:device1,device2. For example: -d MULTI:CPU,GPU,MYRIAD
The application can use different hardware accelerator for different models. The user can specify the target device for each model using the command line argument as below:
-d <device>: Target device for Face Detection network (CPU, GPU, MYRIAD or HDDL).
-d_ag <device>: Target device for Age Gender Recognition network (CPU, GPU, MYRIAD or HDDL).
-d_hp <device>: Target device for Head Pose Estimation network (CPU, GPU, MYRIAD or HDDL).
For example: To run Face Detection model on CPU and Age Gender Recognition model with FP32 on GPU, Head Pose Estimation model on MYRIAD, use the below command:
__bin/Release/application -m /opt/intel/openvino_2020.3.194/deployment_tools/open_model_zoo/tools/downloader/intel/face-detection-retail-0004/FP32/face-detection-retail-0004.xml -m_ag /opt/intel/openvino_2020.3.194/deployment_tools/open_model_zoo/tools/downloader/intel/age-gender-recognition-retail-0013/FP32/age-gender-recognition-retail-0013.xml -m_hp /opt/intel/openvino_2020.3.194/deployment_tools/open_model_zoo/tools/downloader/intel/head-pose-estimation-adas-0001/FP32/head-pose-estimation-adas-0001.xml -d CPU -d_ag GPU -d_hp MYRIAD
FP32: FP32 is single-precision floating-point arithmetic uses 32 bits to represent numbers. 8 bits for the magnitude and 23 bits for the precision. For more information, click here
FP16: FP16 is half-precision floating-point arithmetic uses 16 bits. 5 bits for the magnitude and 10 bits for the precision. For more information, click here
Note: The Intel® Neural Compute Stick and HDDL can only run FP16 models. The model that is passed to the application, through the command-line argument, must be of data type FP16
To add the new ads in JSON file, follow this series of instructions:
-
Video is first converted to H.265 or hevc format using FFmpeg* as the decoding process takes the input videos in this format for decoding. To convert an MP4 video to required format, follow these steps:
- Install FFmpeg:
sudo apt install ffmpeg- Convert video from .mp4 to .hevc format using FFmpeg:
ffmpeg -i <input_video>.mp4 -c:v libx265 -c:a aac -b:a 128k <output_video>.hevc -
Copy the video to the resources directory found in the intelligent-kiosk-analytics-cpp directory.
-
Add a video file name for an ad. For example, to add a new ad file called intel.hevc, which is meant to be played for males between the age group 28 to 50 years, modify the adlist.json file:
- Open adList.json from
intelligent-kiosk-analytics-cpp/resourcesdirectory in an editor. - Add the file name intel.hevc at the end of the list of the ads for "Age_Group": 3, "Gender": "M".
{ "Age_Group": 3, "Gender": "M", "Ads": [ "maleAd.h265", "maleAd.h265", "maleAd.h265", "intel.hevc" ] }Note:
- There are four age groups considered in the application:
- Child: 1 to 13 yrs belongs to age group 1
- Young Adult: 14 to 28 yrs belongs to age group 2
- Adult: 28 to 50 yrs belongs to age group 3
- Senior: 50+ yrs belongs to age group 4
- Open adList.json from
-
Check time series demographics data on InfluxDB databases:
influx
show databases
use Demographics
select * from Demographics
-
To visualize data on Grafana:
-
On the terminal, start the Grafana server:
sudo service grafana-server start -
Open the browser and go to localhost:3000.
-
Sign in with user as admin and password as admin.
-
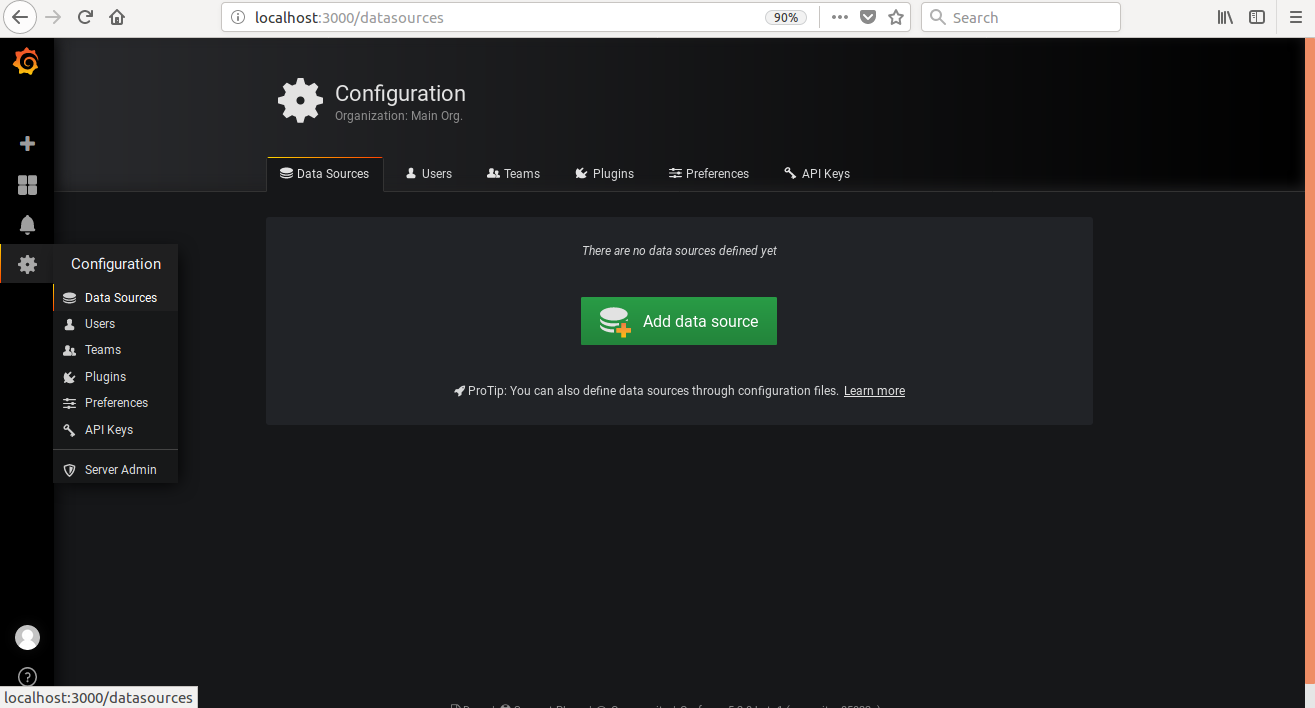
Select the Configuration icon and then choose Data Sources.
-
Select + Add data source and add these settings:
- Name: Demographics
- Type: InfluxDB
- URL: http://localhost:8086
- Database: Demographics
- Click on “Save and Test”
-
Click the Back button at the bottom of the page. Select + Add data source and enter these settings:
- Name: AdData
- Type: InfluxDB
- URL: http://localhost:8086
- Database: AdData
- Click on “Save and Test”
-
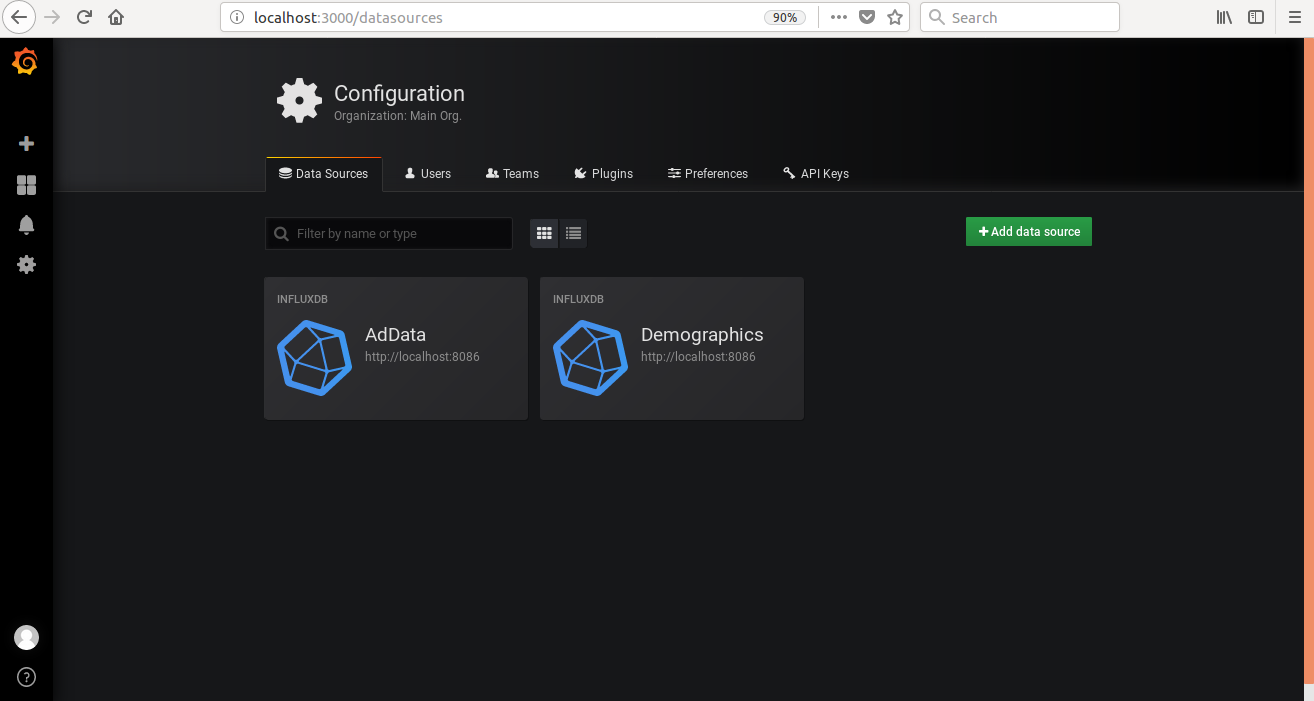
Click the Back button at the bottom of the page. AdData and Demographics are added to the data sources.
-
To create a new dashboard:
-
Select + icon from the side menu bar which is under Grafana icon and select Dashboard.
-
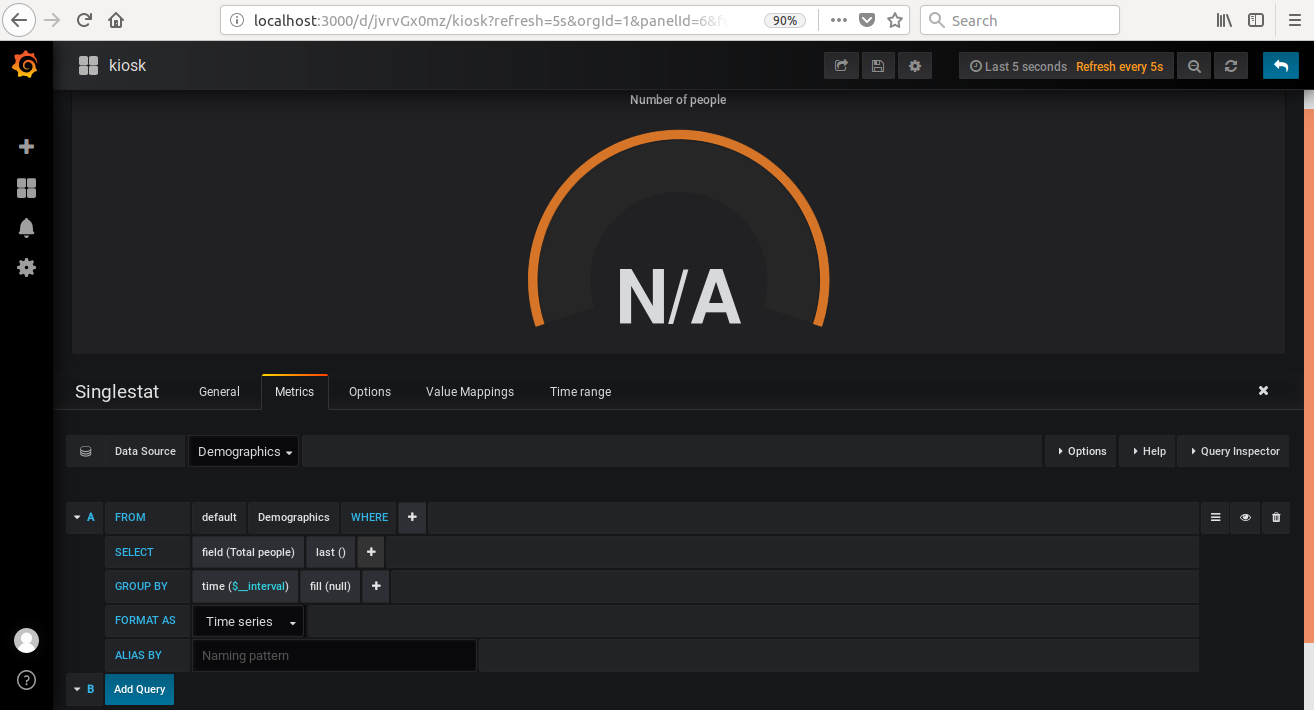
Select Singlestat. Click on the Panel Title and select Edit.
-
Click on General in Singlestat menu tab and change the Panel Title to Number of people.
-
Click on Metrics in Singlestat menu tab. From Data Source choose Demographics.
-
Click on Add Query. Click on select measurement and select Demographics.
-
In field (value) click on value and select Total people.
-
Click on + beside mean in SELECT field. From Selectors, select last(). It will override mean().
After the series of steps #2., query A will be:
FROM default Demographics SELECT field(Total people) last() GROUP BY time($__interval) fill(null) FORMAT AS Time Series
- Click on Options in Singlestat menu tab. Select Current from stat field and change the Font size to 120, in the first row.
- Select show under Gauge option present at the bottom.
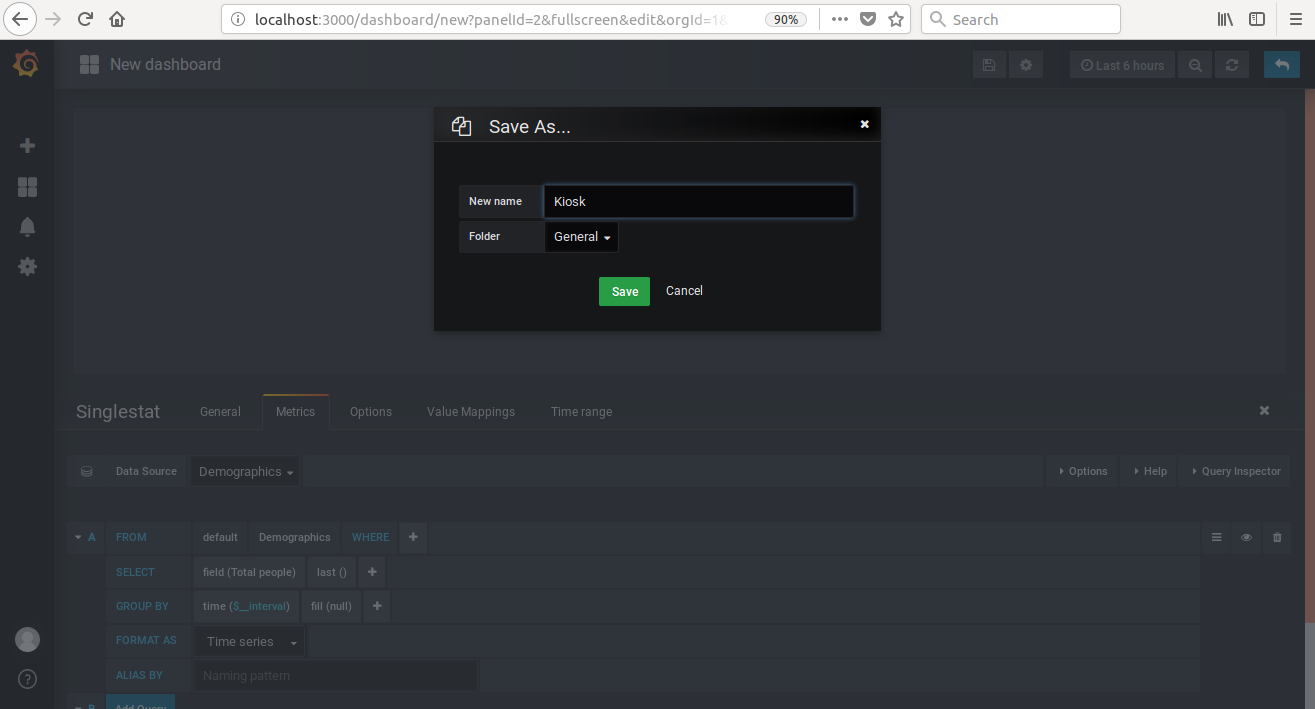
- Save the dashboard with name Kiosk. Save button is provided in the top menu.
-
-
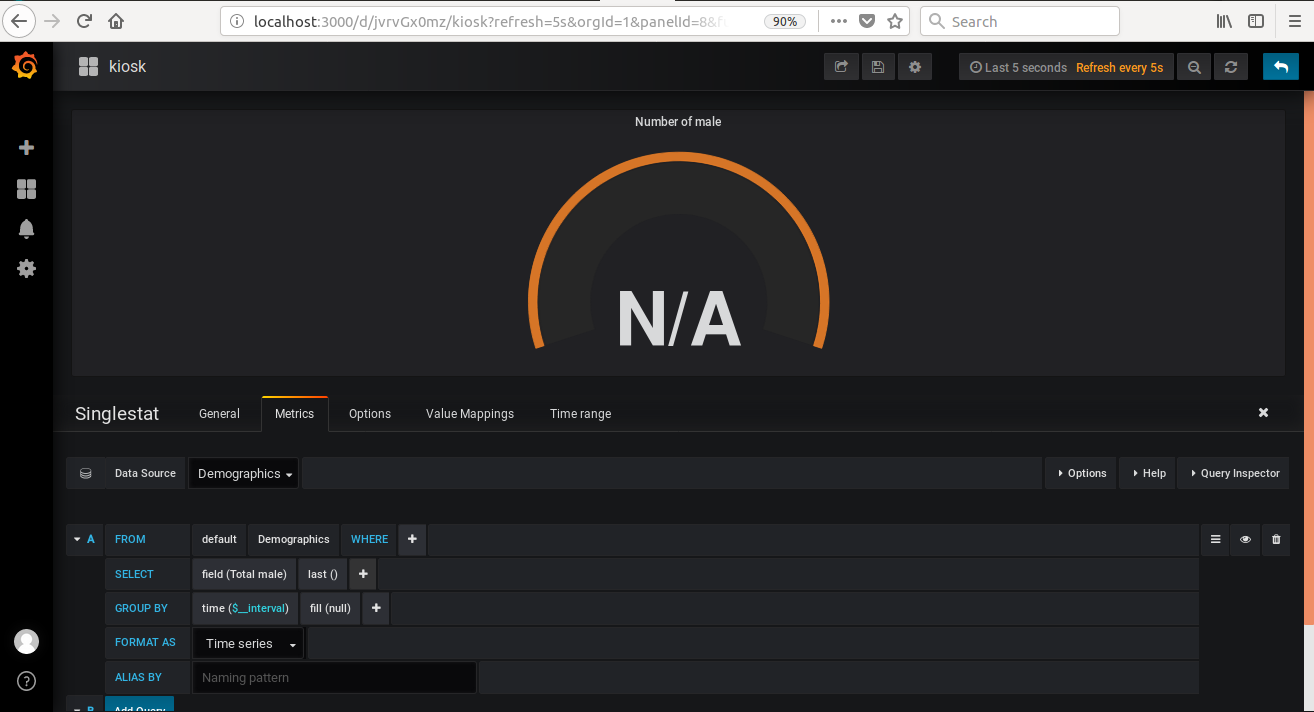
Repeat step 2 to add Singlestat panel for Number of male to the dashboard, with these modifications:
-
For the panel title, change Number of people to Number of male.
-
Select Total male in the field (value) of Metrics Singlestat menu option.
Query A will be:
FROM default Demographics SELECT field(Total male) last() GROUP BY time($__interval) fill(null) FORMAT AS Time Series
- Save the dashboard and click on the Back to dashboard icon on right corner of the top menu.
-
-
Similarly, to add Singlestat panel for Number of female to the dashboard, repeat step 2 with these modifications:
-
For the panel title, change Number of people to Number of female.
-
Select Total female in the field (value) of Metrics Singlestat menu option.
Query A will be:
FROM default Demographics SELECT field(Total female) last() GROUP BY time($__interval) fill(null) FORMAT AS Time Series -
Save the dashboard and click on the Back to dashboard icon.
-
-
Add a graph for visualizing demographics time series data:
-
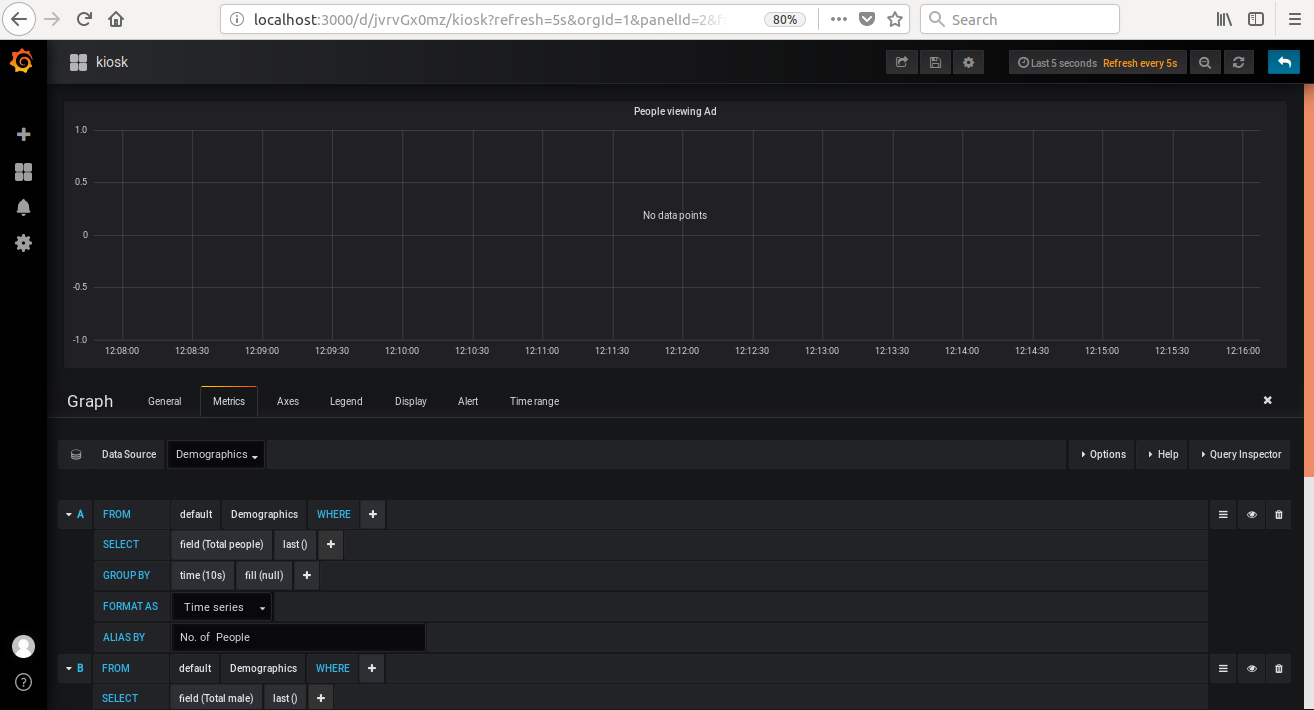
Click on the add panel icon on the top menu and click on Graph. This will add the Graph to the dashboard.
-
Click on the Panel Title of the Graph and select Edit.
-
Click on General in Graph menu tab and change the Panel Title to People viewing Ad.
-
Click on Metrics in Graph menu tab. From Data Source choose Demographics.
-
Click on Add Query. Click on select measurement and select Demographics.
-
Click on field (value) and select Total people.
-
Click on + in SELECT field. From Selectors, select last().
-
In GROUP BY field, click on time($__interval) and select 10s.
-
Name the query as Number of people in the ALIAS BY row.
Query A will be:
FROM default Demographics SELECT field(Total people) last() GROUP BY time(10s) fill(null) FORMAT AS Time Series ALIAS BY Number of People -
Similarly add queries for displaying no. of male and female by clicking on +. For male and female, queries will be:
Query B:
FROM default Demographics SELECT field(Total male) last() GROUP BY time(10s) fill(null) FORMAT AS Time Series ALIAS BY Number of maleQuery C:
FROM default Demographics SELECT field(Total female) last() GROUP BY time(10s) fill(null) FORMAT AS Time Series ALIAS BY Number of female
- Click on Display in Graph menu tab and change the values of Fill and Line Width under Mode Options to 2.
- Click on Time Range present on the menu tab and write 500s in the text box provided beside Override relative time Last.
- Save the dashboard and click on Back to dashboard icon.
-
-
Add the table for displaying the Demographics data:
-
Click on the add panel icon on the top menu and click on Table.
-
Click on the Panel Title of the Table and select Edit.
-
Click on General in Table menu tab and change the Panel Title to Demographics.
-
Click on Metrics in Table menu tab. From Data Source choose Demographics.
-
Configure the following queries under Metrics:
Query A:
FROM default Demographics SELECT field(Total people) last() GROUP BY time(1s) fill(none) FORMAT AS Time Series ALIAS BY Number of PeopleQuery B:
FROM default Demographics SELECT field(Total male) last() GROUP BY time(1s) fill(none) FORMAT AS Time Series ALIAS BY Number of maleQuery C:
FROM default Demographics SELECT field(Total female) last() GROUP BY time(1s) fill(none) FORMAT AS Time Series ALIAS BY Number of female -
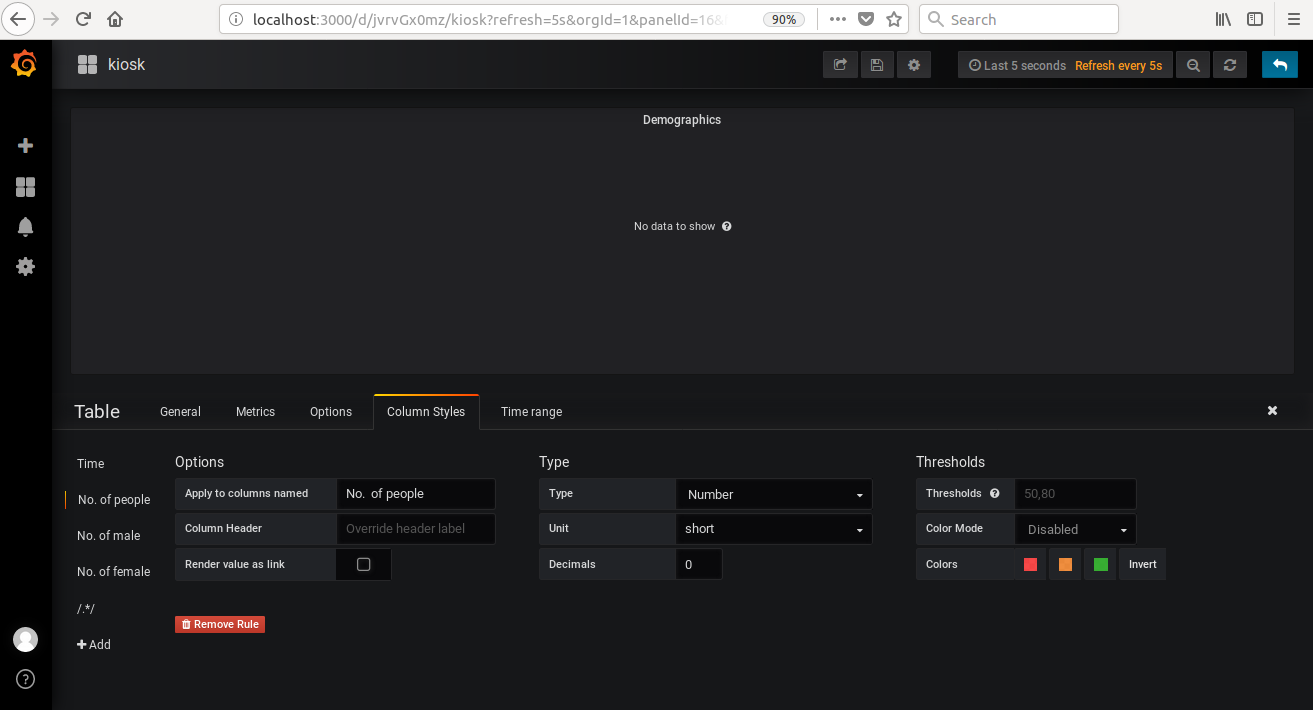
From the Column Styles on the menu tab, click on +Add and in the Apply to columns named give the name as No. of people and under Type, select Number in Type and write 0 in the Decimals field as shown in the image below.
- Similarly in Column Styles add the rules for No. of male and No. of female and select Number in Type and write 0 in the Decimals field.
- Save the dashboard and click on Back to dashboard icon.
-
-
Add the graph for displaying the people interested in viewing the ad:
-
Click on the add panel icon on the top menu and click on Graph. This will add the Graph to the dashboard.
-
Click on the Panel Title of the Graph and select Edit.
-
Click on General in menu tab and change the Panel Title to Audience interested in viewing the Ad.
-
Click on Metrics in Graph menu tab. From Data Source choose AdData.
-
Configure the following queries under Metrics:
Query A:
FROM default AdData SELECT field(peopleInterested) last() GROUP BY time(10s) fill(null) FORMAT AS Time Series ALIAS BY People InterestedQuery B:
FROM default AdData SELECT field(peopleNotInterested) last() GROUP BY time(10s) fill(null) FORMAT AS Time Series ALIAS BY People Not Interested -
Click on Display in Graph menu tab and change the values of Fill and Line Width under Mode Options to 2.
-
Click on Time Range present on the menu tab and write 500s in the text box provided beside Override relative time Last.
-
Save the dashboard and click on Back to dashboard icon.
-
-
Add the table for displaying the people interested in viewing the ad:
-
Click on the add panel icon on the top menu and click on Table.
-
Click on the Panel Title of the Table and select Edit.
-
Click on General in Table menu tab and change the Panel Title to Ad Data.
-
Click on Metrics in Table menu tab. From Data Source choose AdData.
-
Configure the following queries under Metrics:
Query A:
FROM default AdData SELECT field(previousAd) last() GROUP BY time(1s) fill(none) FORMAT AS Time Series ALIAS BY Ad nameQuery B:
FROM default AdData SELECT field(peopleInterested) last() GROUP BY time(1s) fill(none) FORMAT AS Time Series ALIAS BY People InterestedQuery C:
FROM default AdData SELECT field(peopleNotInterested) last() GROUP BY time(1s) fill(none) FORMAT AS Time Series ALIAS BY People Not Interested -
In Column Styles add the rules for People interested and People not interested and select Number in Type and write 0 in the Decimals field.
-
Save the dashboard and click on Back to dashboard icon.
-
-
Display the ad currently playing on the dashboard:
-
Select Singlestat, Click on the Panel Title and select Edit.
-
Click on General in Singlestat menu tab and change the Panel Title to Ad currently playing.
-
Click on Metrics in Singlestat menu tab. From Data Source choose AdData.
-
Configure the following queries under Metrics:
Query A:
FROM default AdData SELECT field(currentAd) last() GROUP BY time($__interval) fill(null) FORMAT AS Time Series -
Save the dashboard and click on Back to dashboard icon.
-
-
To add Singlestat panel for Number of unique visitors to the dashboard, repeat step 2 with this modifications:
-
Instead of Number of people, set the panel title to Number of unique visitors.
-
Select Unique visitors in the field (value) of Metrics Singlestat menu option.
Query A in this case will be:
FROM default Demographics SELECT field((Unique visitors)) last() GROUP BY time(1m) fill(null) FORMAT AS Time Series
-
Click on Options in Singlestat menu tab. Select Current from stat field under Value and change the Font size to 120, in the first row.
-
Save the dashboard and click on Back to dashboard icon.
-
-
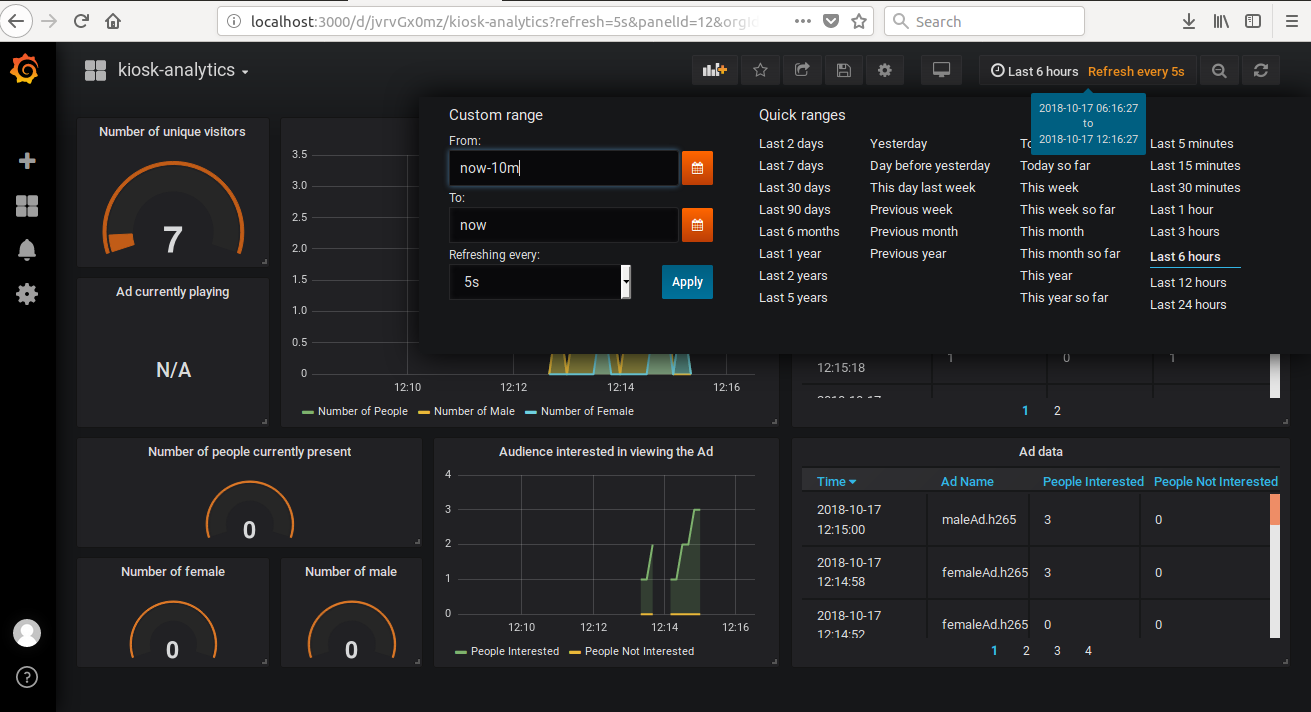
Select Time picker from the top menu of dashboard. Under Custom range change the From value to now-10m , To to now and Refreshing every: to 5s, click on Apply and save the dashboard.
-
-
Run the C++ code to visualize data on grafana.
-
Panels can be arranged on the dashboard by resizing and dragging.
-
In your browser, go to localhost:3000.
-
Log in with user as admin and password as admin.
-
Click on Configuration.
-
Select “Data Sources”.
-
Click on “+ Add data source” and provide these settings:
- Name: Demographics
- Type: InfluxDB
- URL: http://localhost:8086
- Database: Demographics
- Click on “Save and Test”
Click on Back button at the bottom of the page. Click on “+ Add data source” and provide these settings:
- Name: AdData
- Type: InfluxDB
- URL: http://localhost:8086
- Database: AdData
- Click on “Save and Test”
-
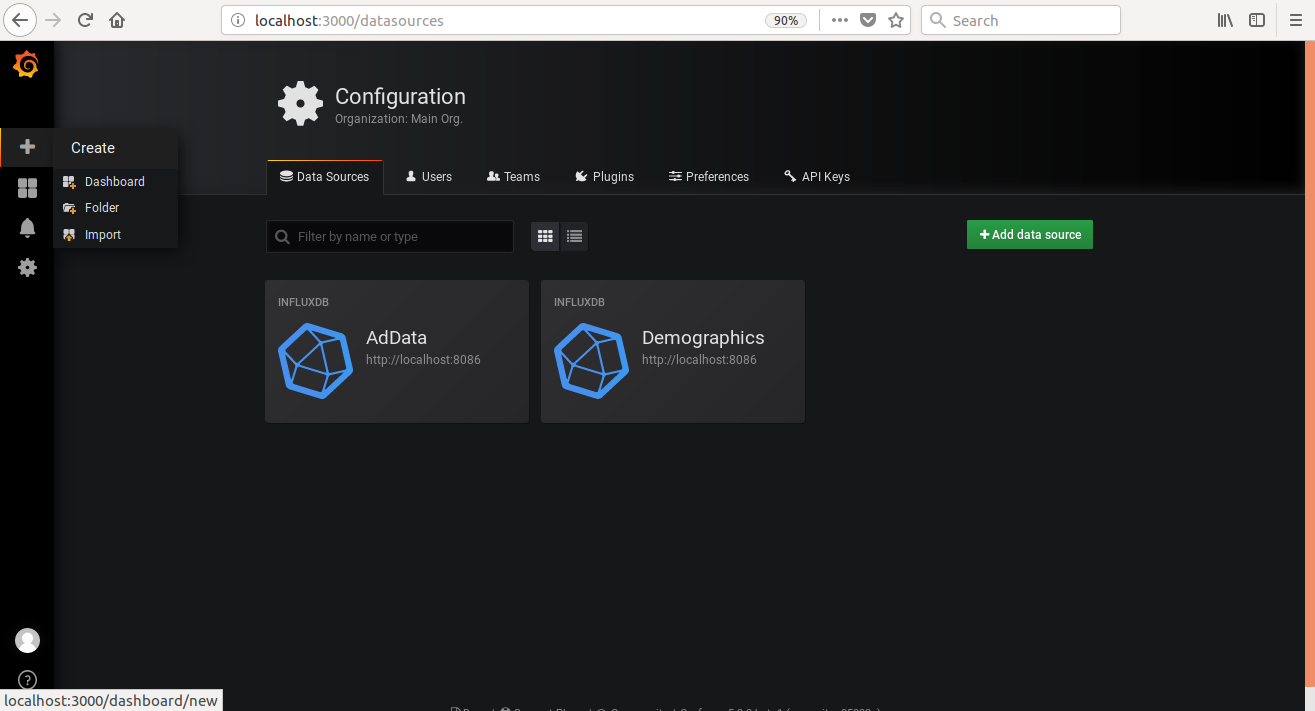
Click on + icon present on the left side of the browser, select import.
-
Click on Upload.json File.
-
Select the file name "kiosk-analytics.json" from intelligent-kiosk-analytics-cpp/resources directory.
-
Select "Demographics" in Select a influxDB data source beside Demographics and "AdData" data source in AdData field.
-
- Click on import.
- Run the application to see the data on Grafana.
-

