This Data applications provide users with a user-friendly tool for accessing and analyzing stock market data. The project aims to achieve the following:
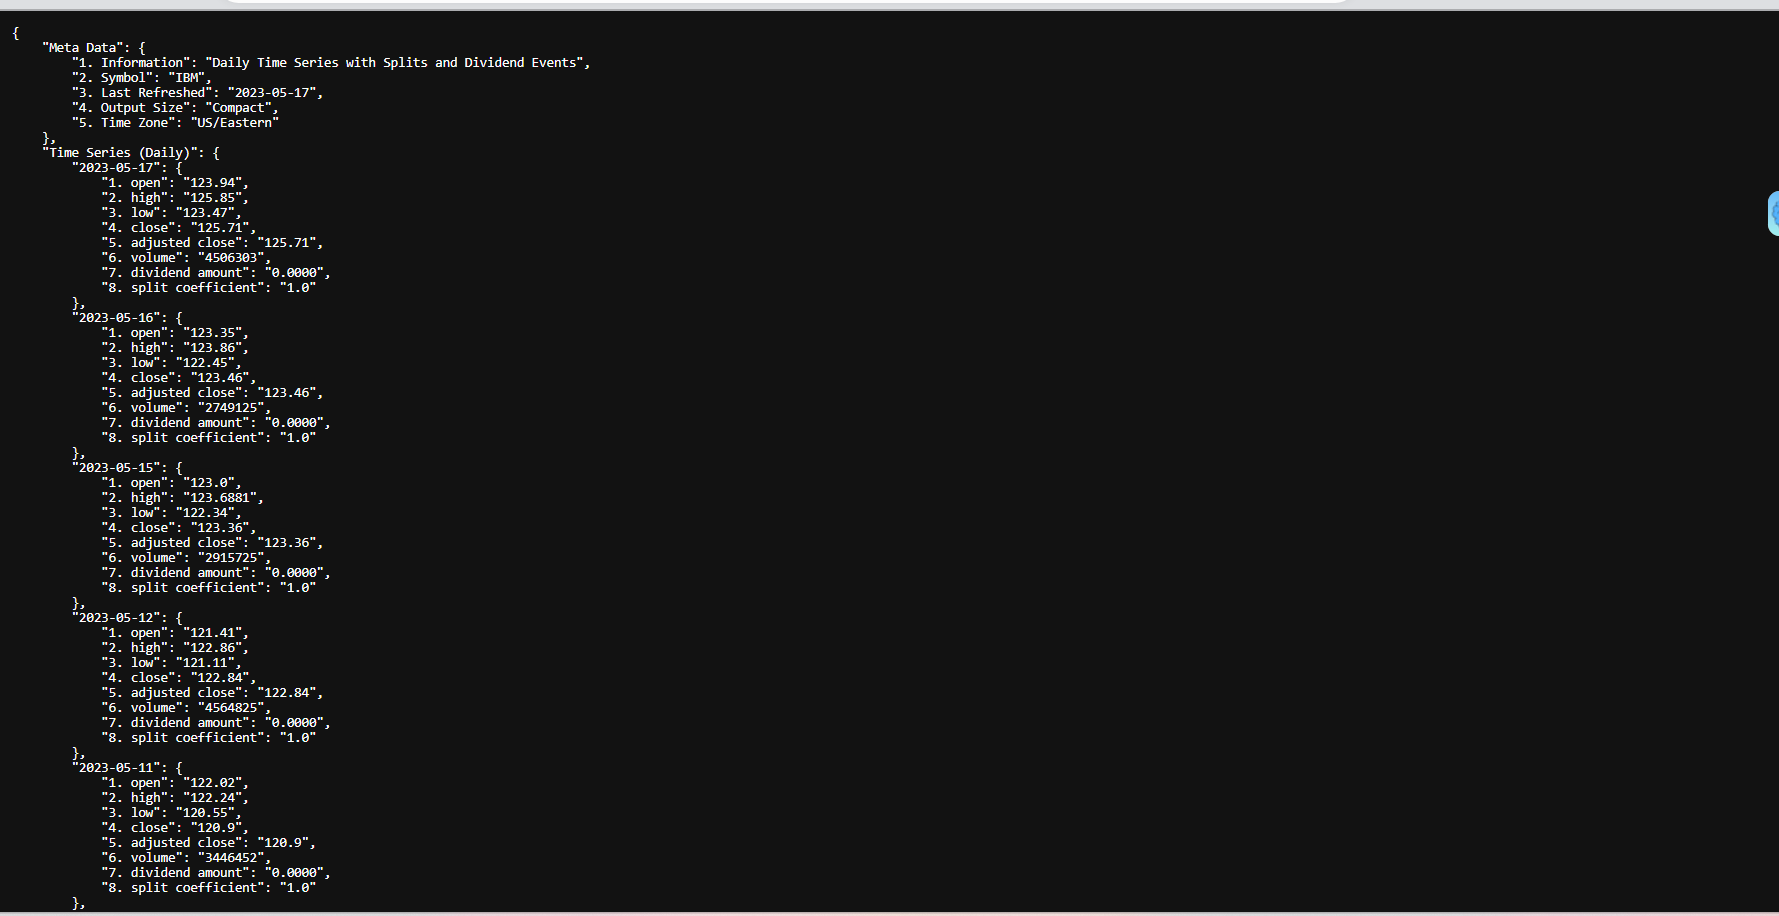
1.Data Retrieval: Retrieve daily stock price data and company overview information from the Alpha Vantage API.
2.Visualization: Display stock price data using candlestick charts and provide options to visualize technical indicators like MACD and RSI.
3.Technical Analysis: Calculate technical indicators such as MACD and RSI to identify trends, momentum, and potential buying/selling opportunities.
4.User-Friendly Interface: Create an intuitive interface using Streamlit, allowing users to enter stock symbols, explore data, and customize their analysis.
Overall, the Market View Application aims to empower users by providing access to stock market data, facilitating technical analysis, and enabling informed decision-making based on visualized data and fundamental company metrics.
- Alpha Vantage [https://www.alphavantage.co/documentation/]
- mplfinance [ https://pypi.org/project/mplfinance/]
- Streamlit [ https://docs.streamlit.io/library/api-reference]
- TA-Lib : Technical Analysis Library [ https://ta-lib.org/]
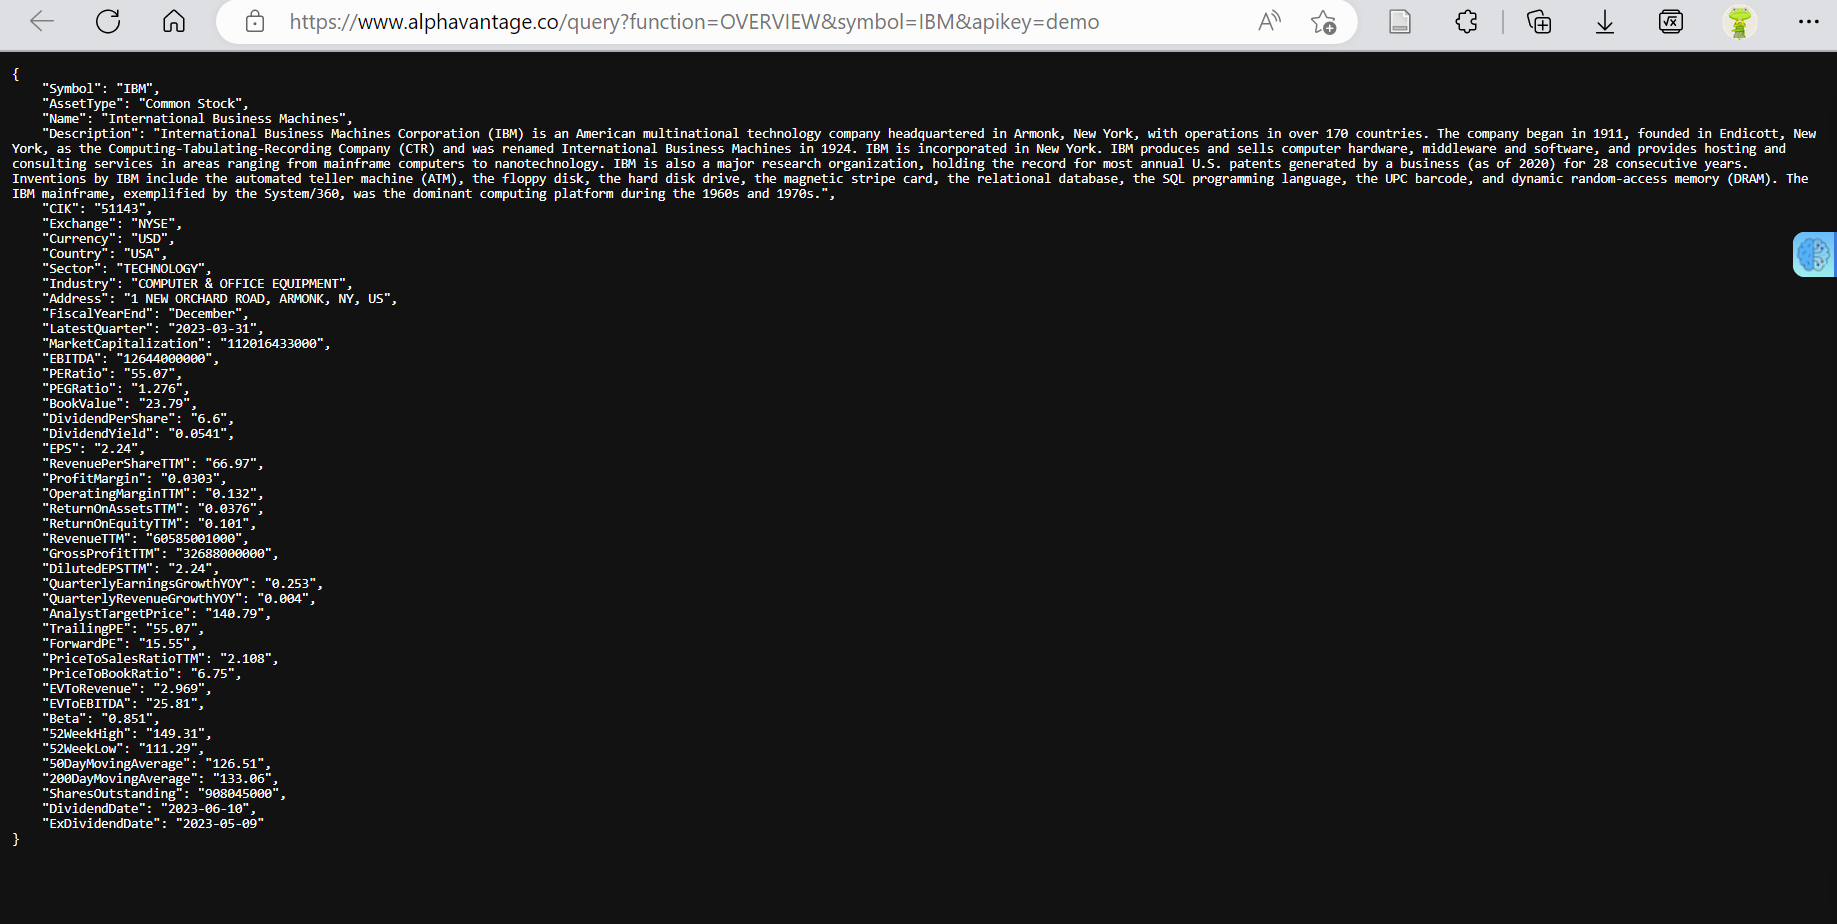
Company Overview:
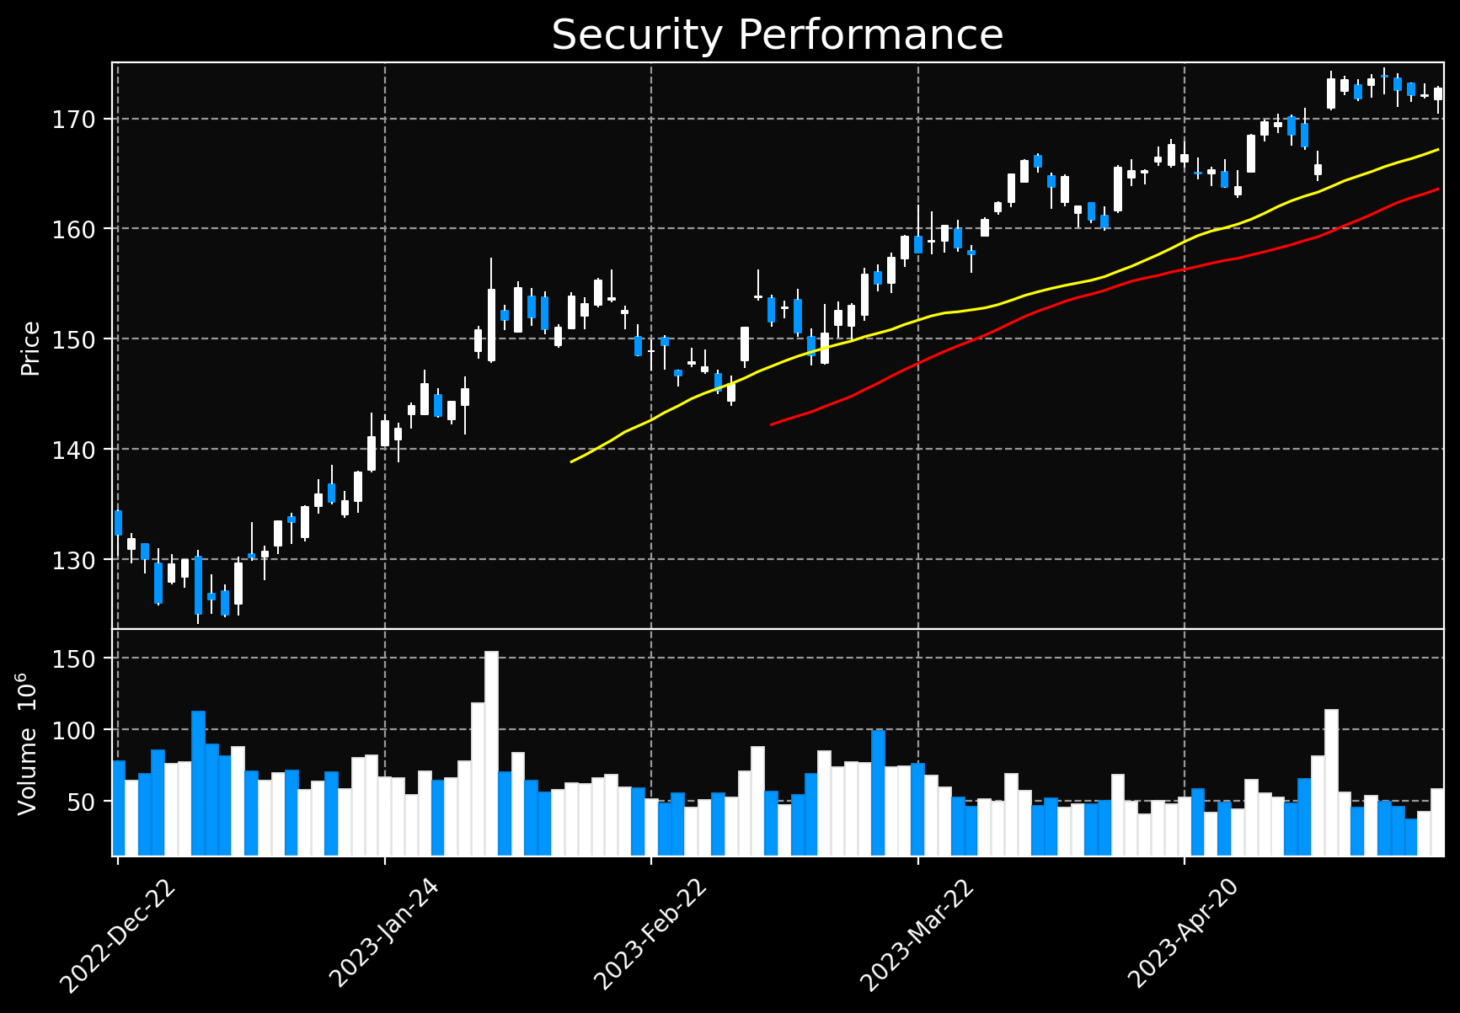
Stock Price Chart:
The application displays a candlestick chart of the stock's performance. It shows the opening, closing, highest, and lowest prices for each day. Additionally, it includes moving averages (MA) of 35 and 50 periods and volume bars.
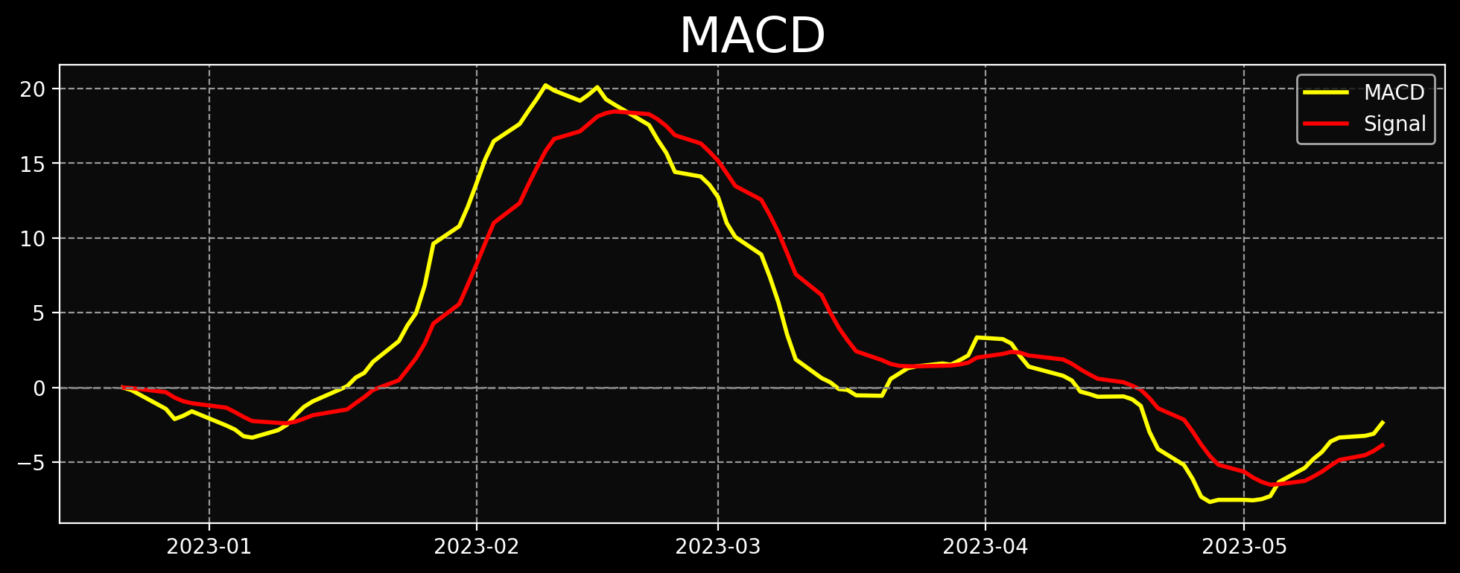
MACD Indicator:
The Relative Strength Index Indicator:
Let's begin by installing necessary Python packages:
pip install streamlit requests pandas mplfinance matplotlib ta
import streamlit as st
import requests
import pandas as pd
import mplfinance as mpf
import matplotlib.pyplot as plt
import tadef get_stock_data(symbol, exchange):
# Get daily stock price data
url = f"https://www.alphavantage.co/query?function=TIME_SERIES_DAILY_ADJUSTED&symbol={symbol}&outputsize=compact&apikey={API_KEY}"
if exchange:
url += f"&market={exchange}"
response = requests.get(url)
data = response.json()["Time Series (Daily)"]
X = pd.DataFrame.from_dict(data, orient="index")
X.index = pd.to_datetime(X.index)
X = X.astype(float)
X = X.drop(columns=["7. dividend amount","8. split coefficient"])
df = X.rename(columns={'1. open':'Open','2. high':'High','3. low':'Low','4. close':'Close','5. adjusted close':'Adj Close','6. volume': 'Volume'})
df = df.sort_index(ascending=True) # Sort dataframe by date in ascending order
    url = f"https://www.alphavantage.co/query?function=OVERVIEW&symbol={symbol}&apikey={API_KEY}"
    response = requests.get(url)
    data = response.json()
    company_name = data.get('Name')
    industry = data.get('Industry')
    ebitda = data.get('EBITDA')
    pe_ratio = data.get('PERatio')
    pb_ratio = data.get('PriceToBookRatio')
    book_value = data.get('BookValue')
    ev_to_revenue = data.get('EVToRevenue')
    ev_to_ebitda = data.get('EVToEBITDA')
    beta = data.get('Beta')
    eps = data.get('EPS')
    peg_ratio = data.get('PEGRatio')
    forward_pe = data.get('ForwardPE')
    analyst_target_price = data.get('AnalystTargetPrice')
    high_52_weeks = data.get('52WeekHigh')
    low_52_weeks = data.get('52WeekLow')

    company_overview_data = {'Name':[company_name],'Industry': [industry],'Analyst Target Price': [analyst_target_price],
                             'Book Value': [book_value],'P/B Ratio': [pb_ratio], 'P/E Ratio': [pe_ratio],
                             'Forward P/E': [forward_pe], 'EV/Revenue': [ev_to_revenue],
                             'EV/EBITDA': [ev_to_ebitda], 'Beta': [beta], '52 Week High': [high_52_weeks],
'52 Week Low': [low_52_weeks],'EPS': [eps], 'PEG Ratio': [peg_ratio]} st.write('Company Overview')
st.dataframe(pd.DataFrame.from_dict(company_overview_data).iloc[:20, :20])def main():
st.set_page_config(page_title="Market View", page_icon=":chart_with_upwards_trend:", layout="wide", initial_sidebar_state="collapsed")
st.title(":chart_with_upwards_trend: Market View")
# Ask user to input stock symbol
symbol = st.sidebar.text_input("Enter stock symbol (e.g. AAPL):", key="symbol_input")
if not symbol:
st.warning("Please enter a stock symbol in the search bar present towards the left to continue")
return df = get_stock_data(symbol, 'NASDAQ') exp1 = df['Close'].ewm(span=12, adjust=False).mean()
exp2 = df['Close'].ewm(span=26, adjust=False).mean()
macd = exp1 - exp2
signal = macd.ewm(span=9, adjust=False).mean() df['RSI'] = ta.momentum.RSIIndicator(df['Close']).rsi() show_macd = st.sidebar.checkbox("Show MACD", value=True)
show_rsi = st.sidebar.checkbox("Show RSI", value=True) fig_stock, ax_stock = mpf.plot(df, type='candle', mav=(35, 50), volume=True, tight_layout=True,
style='nightclouds', figratio=(20, 12), figscale=0.95,
returnfig=True, mavcolors=('yellow', 'red')) ax_stock[0].set_title("Security Performance", fontsize=18) # Increase the title fontsize
st.pyplot(fig_stock) if show_macd:
fig_macd, ax_macd = plt.subplots(figsize=(12, 4))
ax_macd.plot(macd, color='yellow', linewidth=2, label='MACD')
ax_macd.plot(signal, color='red', linewidth=2, label='Signal')
ax_macd.axhline(0, color='gray', linestyle='--')
ax_macd.legend()
ax_macd.set_title("MACD", fontsize=24)
st.pyplot(fig_macd) if show_rsi:
fig_rsi, ax_rsi = plt.subplots(figsize=(12, 4))
ax_rsi.plot(df['RSI'], color='blue', linewidth=2, label='RSI')
ax_rsi.axhline(30, color='red', linestyle='--', alpha=1)
ax_rsi.axhline(70, color='red', linestyle='--', alpha=1)
ax_rsi.legend()
ax_rsi.set_title("RSI", fontsize=24) # Increase the title fontsize
st.pyplot(fig_rsi)
- Open Anaconda Navigator's Command Terminal
- Change to the directory where you have the Python code file (
StockAPP.pyin this case). You can use the cd command to navigate to the directory:cd path/to/directory
- Create a virtual environment. You can use the
venvmodule to create a virtual environment. Run the following command in the terminal:python -m venv myenv
- Activate the virtual environment. The activation command varies depending on the operating system.For Windows:
myenv\Scripts\activateand For macOS/Linux:source myenv/bin/activate
- Install the required libraries. You can use pip to install them:
pip install streamlit requests pandas mplfinance matplotlib ta
- After the packages are installed, Run the Streamlit app by executing the following command:
streamlit run StockAPP.py
- This will start the Streamlit development server and provide a local URL. Look for a line in the terminal that says:
You can now view your Streamlit app in your browser.Local URL: http://localhost:8401 Network URL: http://10.84.101.82:8501
- After getting the prompt hold the CTRL key and click on the link, This will open the web application on your default browser
- You should see the Streamlit app interface in your web browser. Enter a stock symbol in the sidebar text input and click "Enter" or press "Return" on your keyboard
Note: Make sure you have a stable internet connection to access the Alpha Vantage API and retrieve the stock data. Also, ensure that the provided Alpha Vantage API key is valid and active.


