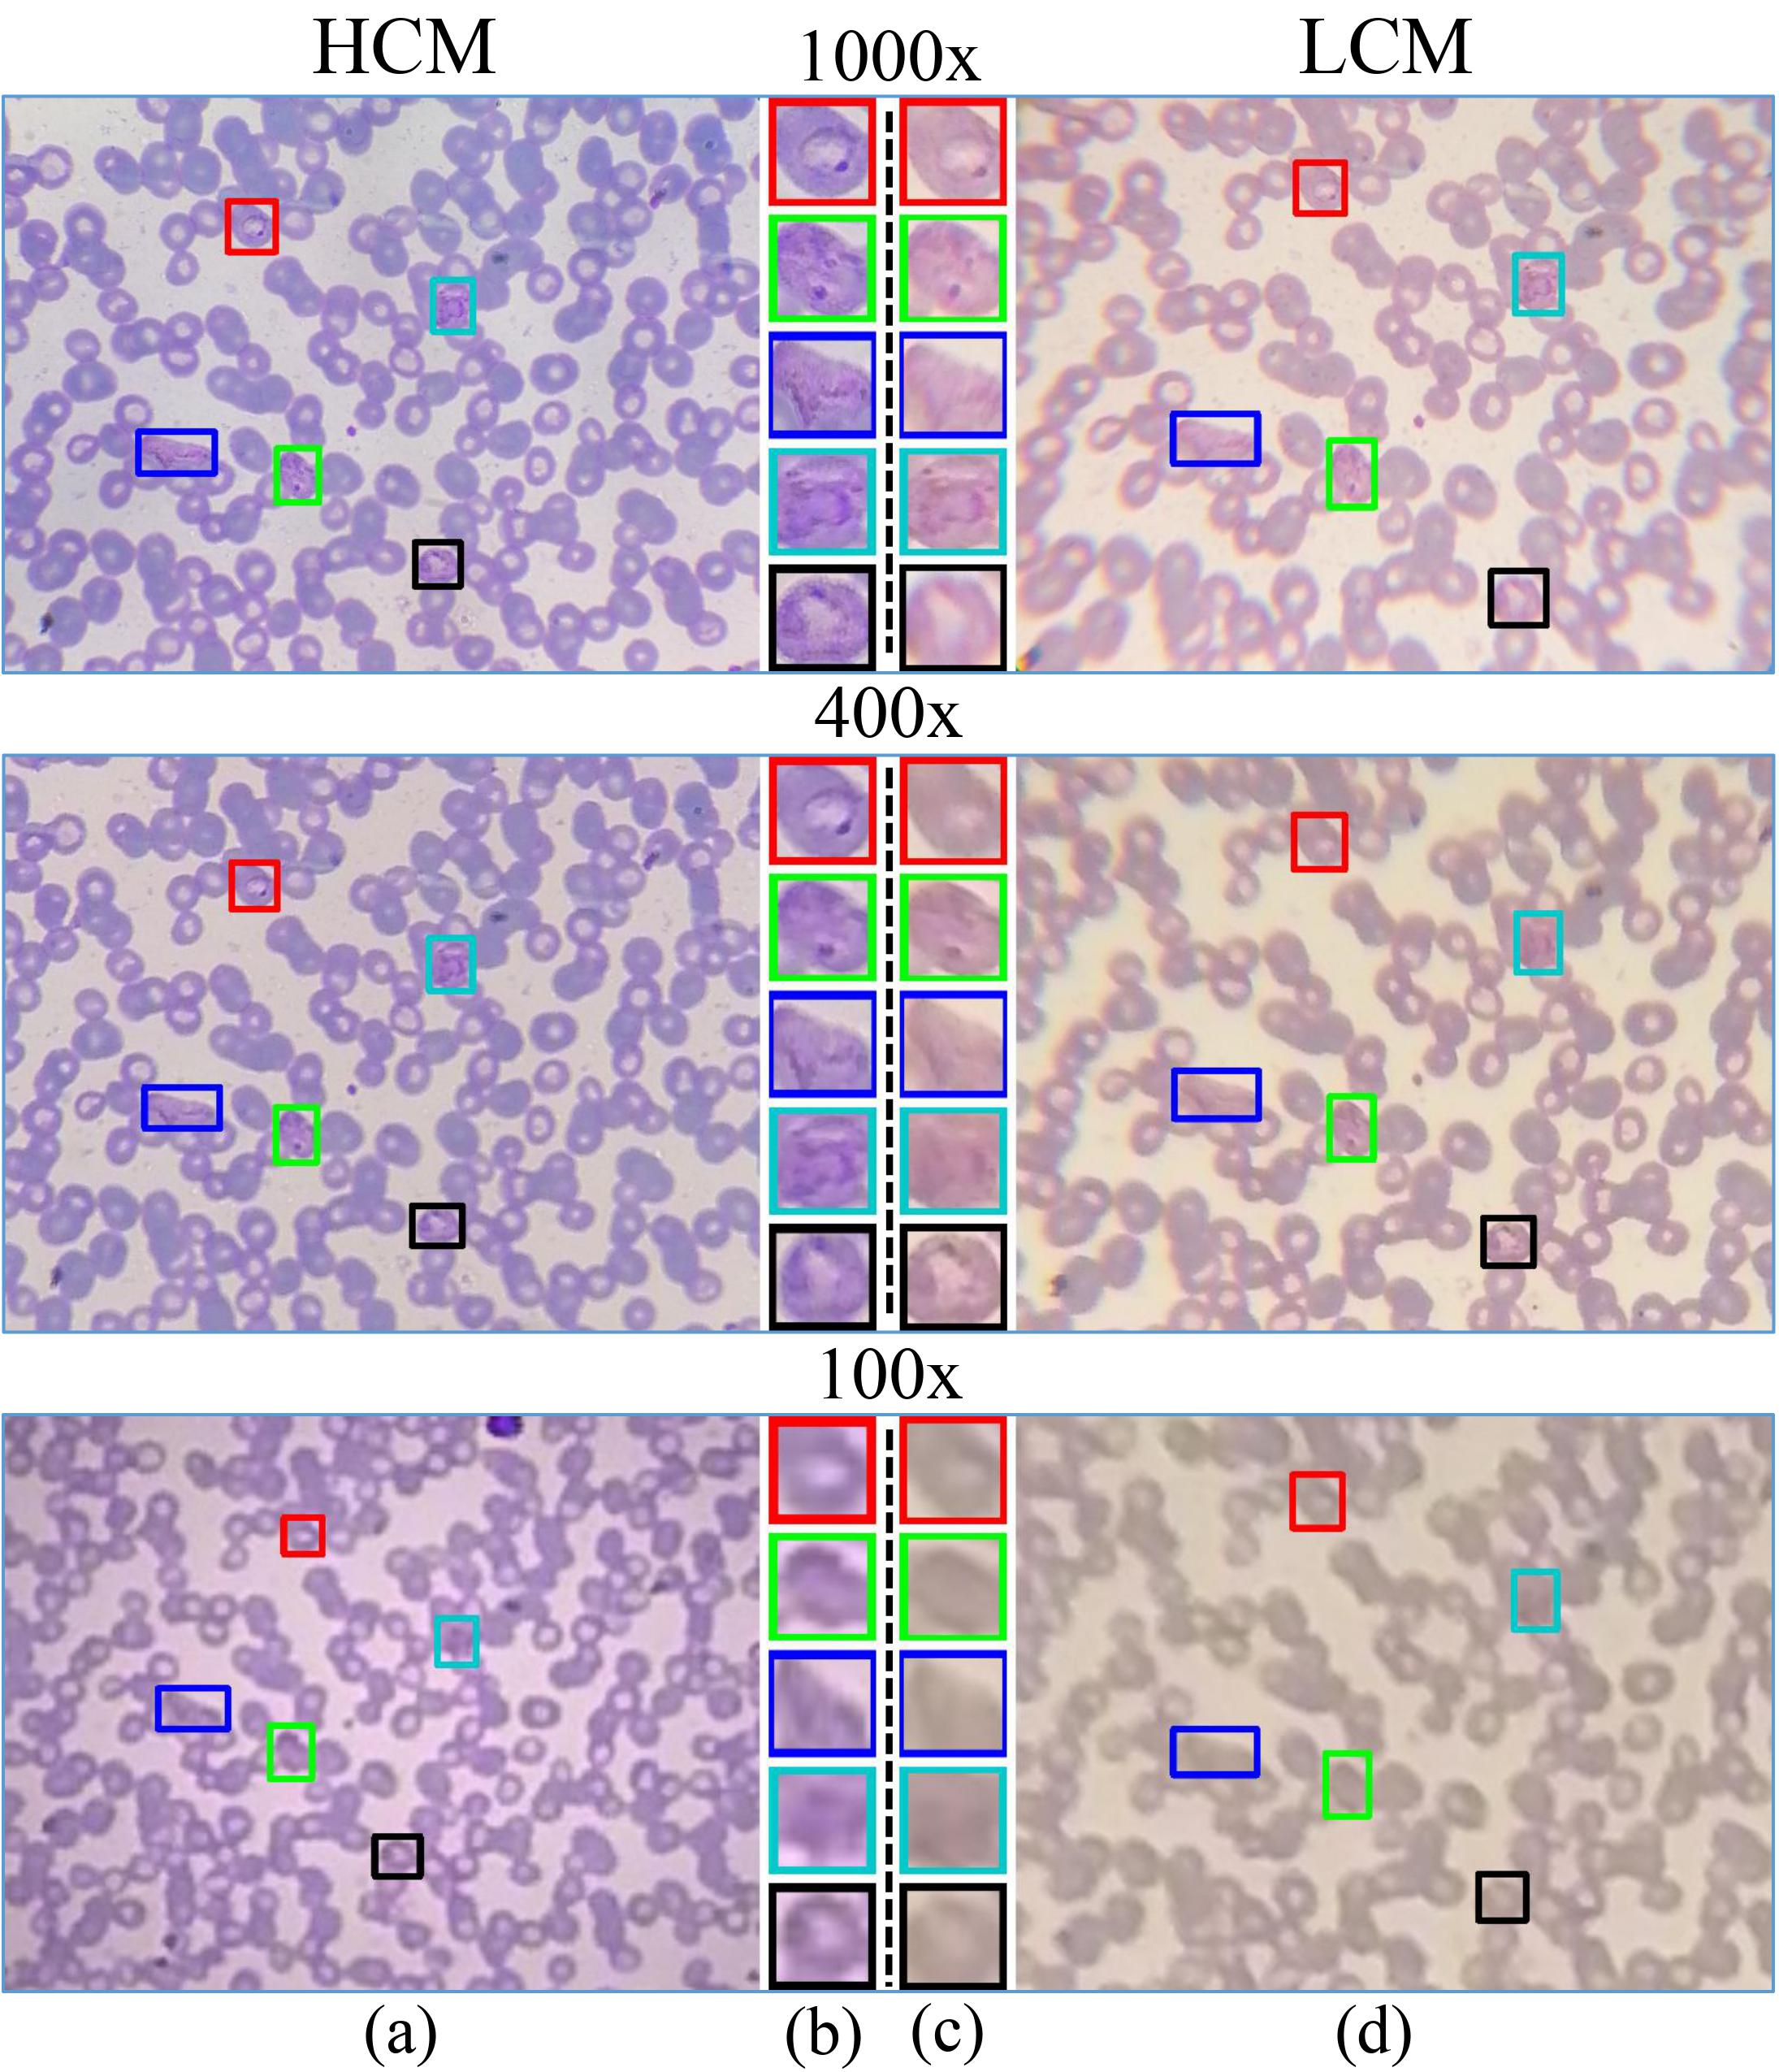
Paper title: Towards low-cost and efficient malaria detection.
Paper accepted for: CVPR 2022.
Preprint available here.
In this project, we tried to make malaria detection easily possible at a low cost. We present M5-malaria Dataset which is the first-ever dataset that is across microscopes and across magnifications. Malaria, a fatal but curable disease claims hundreds of thousands of lives every year. Early and correct diagnosis is vital to avoid health complexities, however, it depends upon the availability of costly microscopes and trained experts to analyze blood-smear slides. Deep learning-based methods have the potential to not only decrease the burden of experts but also improve diagnostic accuracy on low-cost microscopes. However, this is hampered by the absence of a reasonable size dataset. One of the most challenging aspects is the reluctance of the experts to annotate the dataset at low magnification on low-cost microscopes. We present a dataset to further the research on malaria microscopy over the low-cost microscopes at low magnification. Our large-scale dataset consists of images of blood-smear slides from several malaria-infected patients, collected through microscopes at two different cost spectrums and multiple magnifications. Malarial cells are annotated for the localization and life-stage classification task.

M5-Malaria Dataset (Multi Micrscope Multi Magnification Malaria Dataset) contains 2x 3x 1257 Images containing malarial blood cells. We have basically 1257 images from thin blood smears and the same regions have been tracked and captured on three different magnifications of two different microscope. We captured the images using HCM (high cost microscope) on three magnifications (100x, 400x, 1000x) and then tracked and captured the same locations with LCM (Low cost microscope). The images are in .png format and annotations are in pascal_voc format. If you need the coco format of our dataset, feel free to drop us an email at syed.javed@itu.edu.pk.
You can download our dataset from here.
Total size of the dataset is 23GB but for ease in downloading, we have put it in smaller divisions that you will see in the link.
In the above link you should find M5-Malaria Dataset folder and in the folder you will find three subfolders:
- Images
- Splits
- Annotations
In order to visualize the annotations, you can pick some sample images and their annotations from the dataset and run the file Plot_Annotationss.ipynb on them.
You should follow the following steps:
To run the visualization code, you need the following libraries:
- lxml
- cv2 (opencv-python)
- Create Folders Create a folder for annotations, one for images and one for the results.
- Choose sample images for visualization You should pick some images from the dataset and their corresponding annotations. Remember that the images and their annotations have the same names with different extensions. Put the images and annotations in the folders that you just created.
- Update the paths Update the paths in the "Plot_Annotationss.ipynb" file. You will find the path variables in the third cell of the notebook.
- Run All the Cells
If you are using our dataset, please cite this publication.
 @article{sultani2021towards,
  title = {Towards Low-Cost and Efficient Malaria Detection},
  author = {Sultani, Waqas and Nawaz, Wajahat and Javed, Syed and Danish, Muhammad Sohail and Saadia, Asma and Ali, Mohsen},
  journal = {arXiv preprint arXiv:2111.13656},
  year = {2021}
}
waqas.sultani@itu.edu.pk, mohsen.ali@itu.edu.pk, syed.javed@itu.edu.pk