In this lab, you'll build upon the previous lesson on confusion matrices and visualize a confusion matrix using matplotlib.
In this lab you will:
- Create a confusion matrix from scratch
- Create a confusion matrix using scikit-learn
- Craft functions that visualize confusion matrices
Recall that the confusion matrix represents the counts (or normalized counts) of our True Positives, False Positives, True Negatives, and False Negatives. This can further be visualized when analyzing the effectiveness of our classification algorithm.
Here's an example of how a confusion matrix is displayed:
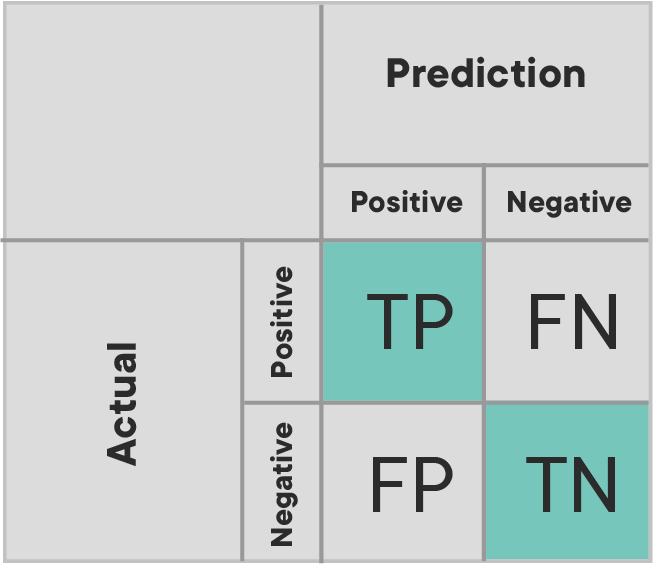
With that, let's look at some code for generating this kind of visual.
As usual, we start by fitting a model to data by importing, normalizing, splitting into train and test sets and then calling your chosen algorithm. All you need to do is run the following cell. The code should be familiar to you.
import pandas as pd
import matplotlib.pyplot as plt
from sklearn.linear_model import LogisticRegression
from sklearn.model_selection import train_test_split

# Load the data
df = pd.read_csv('heart.csv')

# Define appropriate X and y
X = df[df.columns[:-1]]
y = df.target

# Split the data into train and test sets
X_train, X_test, y_train, y_test = train_test_split(X, y, random_state=0)

# Normalize the data
X_train = X_train.copy()
X_test = X_test.copy()

for col in X_train.columns:
    X_train[col] = (X_train[col] - min(X_train[col]))/ (max(X_train[col]) - min(X_train[col]))

for col in X_test.columns:
    X_test[col] = (X_test[col] - min(X_test[col]))/ (max(X_test[col]) - min(X_test[col]))

# Fit a model
logreg = LogisticRegression(fit_intercept=False, C=1e12, solver='liblinear')
model_log = logreg.fit(X_train, y_train)

# Preview model params
print(model_log)

# Predict
y_hat_test = logreg.predict(X_test)

print("")
# Data preview
df.head()To gain a better understanding of confusion matrices, complete the conf_matrix() function in the cell below. This function should:
- Take in two arguments:
y_true, an array of labelsy_pred, an array of model predictions
- Return a confusion matrix in the form of a dictionary, where the keys are
'TP', 'TN', 'FP', 'FN'
def conf_matrix(y_true, y_pred):
    pass


# Test the function
conf_matrix(y_test, y_hat_test)
# Expected output: {'TP': 38, 'TN': 26, 'FP': 7, 'FN': 5}To check your work, make use of the confusion_matrix() function found in sklearn.metrics and make sure that sklearn's results match up with your own from above.
- Import the
confusion_matrix()function - Use it to create a confusion matrix for
y_testversusy_hat_test, as above
# Import confusion_matrix


# Print confusion matrix
cnf_matrix = None
print('Confusion Matrix:\n', cnf_matrix)Luckily, sklearn recently implemented a ConfusionMatrixDisplay function that you can use to create a nice visual of your confusion matrices.
Check out the documentation, then visualize the confusion matrix from your logistic regression model on your test data.
# Import plot_confusion_matrix# Visualize your confusion matrixWell done! In this lab, you created a confusion matrix from scratch, then explored how to use a new function to visualize confusion matrices nicely!