Nightscout exporter to InfluxDB
You need at least go version 1.17.
go build
You can test with ./ns-exporterthe output should be:
total treatments parsed:  0
total devicestatuses parsed:  0
total writen:  0
docker build -t ns-exporter .
or with M1/M2 Apple machine use
docker build --platform linux/amd64 -t ns-exporter .
test with
docker run -d ns-exporter:latest
So the ns-exporter docker image should now be available on the local machine where you built it. If you did not do all above on a VM you have to upload the image to Docker hub.
 docker login
 docker tag ns-exporter:latest <yourDockerhubAccount>/ns-exporter:latest
 docker push <yourDockerhubAccount>/ns-exporter:latest
You have to start with Grafana and Influx container as you have to configure the Influx DB and Grafana before you can deploy the ns-exporter container as it needs the token that you created on Influx DB.
So you can use docker-compose.yml but you have to delete the service for ns-exporter in the first deployment.
Make sure not to forget the 2 volume specs, which are on the same level as the services for grafana and influx.
You can also look at my ns-setup compose file and use the Grafana and Influx Service parts if you used Justmaras ns-setup with traefik and so on. This is complete yml that puts 2 NS sites, 1 mongo, 1 traefik, 1 grafana, 1 Influx and 1 ns-exporter on one VM. When all is running without mistakes you can also push 3.000 entries (NS_EXPORTER_LIMIT=3000) from mongo to Influx (more than a week of data). However you will shortly push through the CPU ceiling of the E2 micro on GCC.
Thats the reason I gave Grafana and Influx a subdomain in FreeDNS, so that I can access the webinterfaces. The initial Login for Grafana is admin:admin. Influx is a little more user friendly to start it initially. In Influx DB you have to name the Bucket 'ns'. You also have to create an API Token, which you need for Grafana to access the Influx DB and also as a paramater to deploy the ns-exporter Docker container. Follow the explanation to use Grafana with Influx DB, I use Flux as querry language.
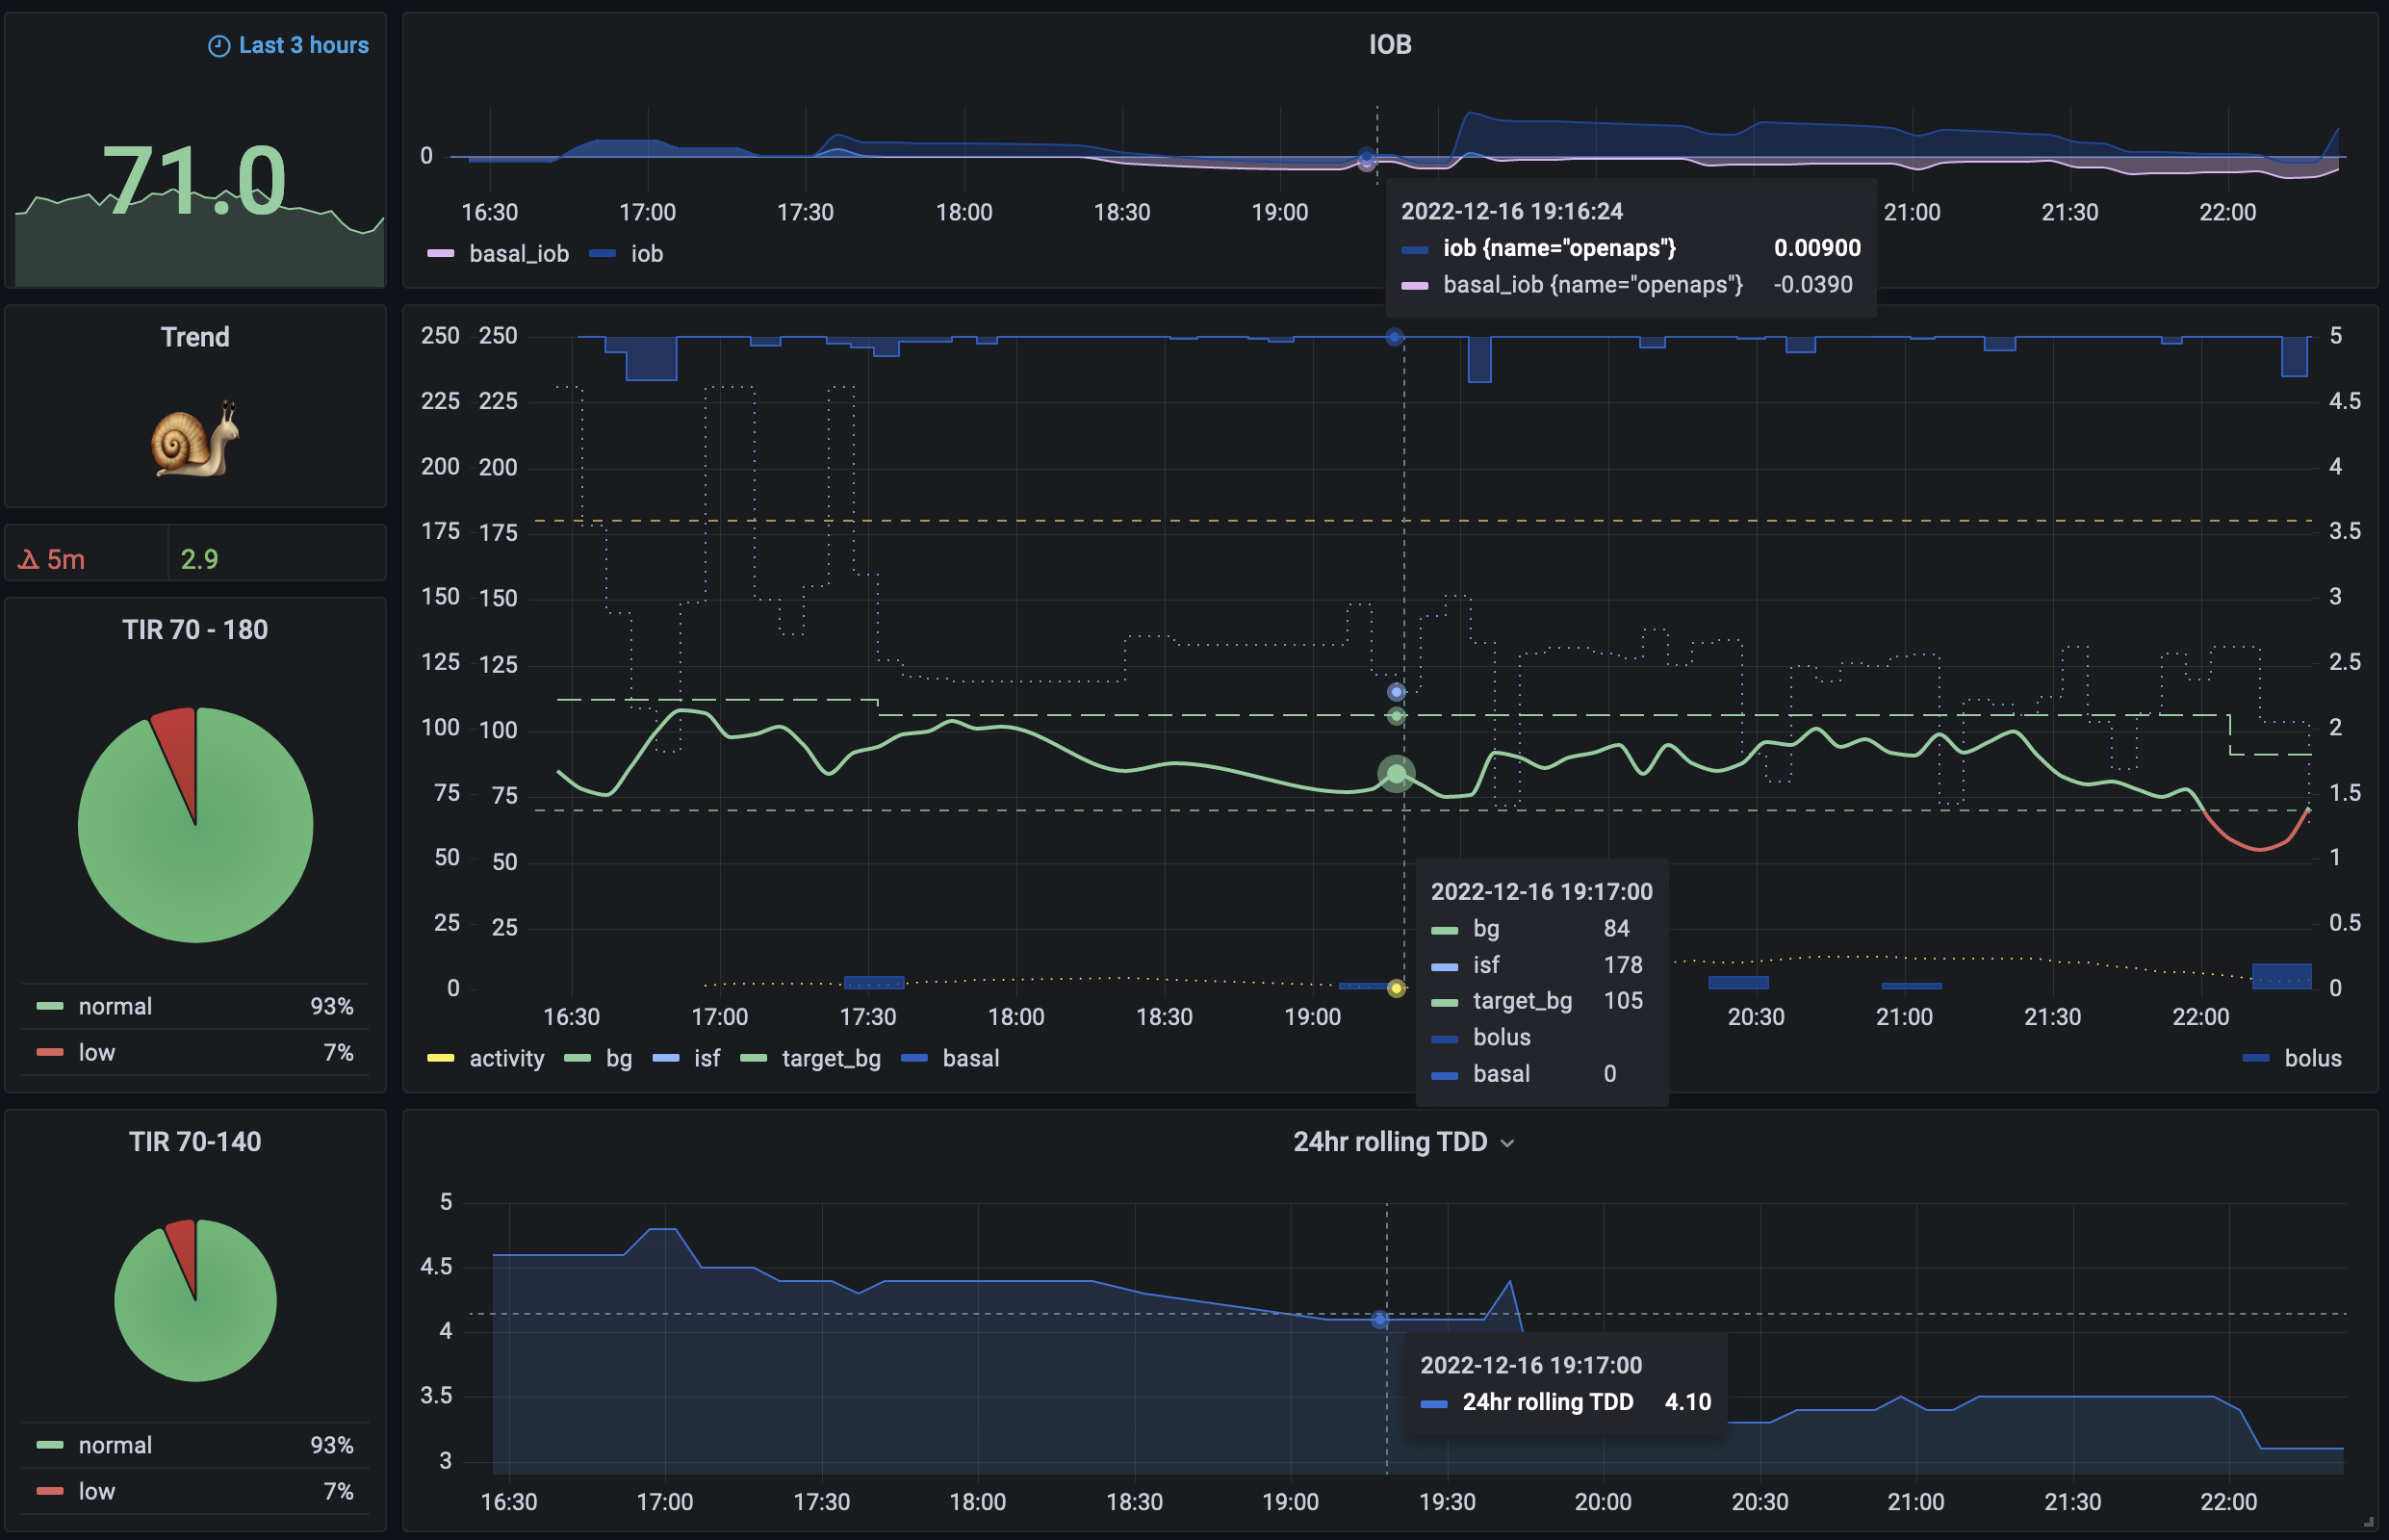
In Grafana you can import the sample dashboard, that you can tweak: grafana.json. Mine is in mg/dL, at Justmara's repo you find one in mmol/L. I have also taken justmaras latest and adopted it for FAX with additional variables, like rolling 24hr TDD and all autoISF adjustments (which I havent put in). But the ns-explorer build is adjusted to transfer all those to Influx.
So now you can configure the token for Influx DB in the ns-exporter variable in docker-compose.yml and deploy the last container. I did connect to mongo directly so did not configure the nightscout variables. You can check in Influx whether data is arriving, if all is fine it just takes a couple of seconds before the ns bucket fills with data.
arguments:
mongo-uri       - MongoDb uri to download from
mongo-db        - MongoDb database name
ns-uri          - Nightscout server url to download from
ns-token        - Nigthscout server API Authorization Token
limit           - number of records to read per request
skip            - number of records to skip from beginning (`skip=100 take=50` means 'take records from 101 to 150')
influx-uri      - InfluxDb uri to download from
influx-token    - InfluxDb access token
influx-org      - (optional, default = 'ns') InfluxDb organization to use
influx-bucket   - (optional, default = 'ns') InfluxDb bucket to use
influx-user-tag - (optional, default = 'unknown') InfluxDb 'user' tag value to be added to every record - to be able to store multiple users data in single bucket
arguments also can be provided via env with NS_EXPORTER_ prefix:
NS_EXPORTER_MONGO_URI=
NS_EXPORTER_MONGO_DB=
NS_EXPORTER_NS_URI=
NS_EXPORTER_NS_TOKEN=
NS_EXPORTER_LIMIT=
NS_EXPORTER_SKIP=
NS_EXPORTER_INFLUX_URI=
NS_EXPORTER_INFLUX_TOKEN=
NS_EXPORTER_INFLUX_ORG=
NS_EXPORTER_INFLUX_BUCKET=
NS_EXPORTER_INFLUX_USER_TAG=
So you can choose the data source: direct MongoDB or Nightscout REST API. Supplying required set of parameters will trigger related consumer. You can even supply both and get from both sources :)
For NS API access you need provide security token. For security reason it is better to go to 'Admin tools' and create special token for NS-Exporter only instead of using admin security key. Since exporter only requires read access, creating role with two permissions will be enough:
- api:treatments:read
- api:devicestatus:read
I'm using Grafana dashboard for viewing data. To setup grafana with InfluxDB you need to follow InfluxDB's instructions.
The sample dashboard can be imported from grafana.json. It uses both InfluxQL and Flux datasources for different panels. Some can be omitted, some can be reworker based on other InfluxDB datasource query type.
Anyway they're provided as samples, for educational purpose :)

