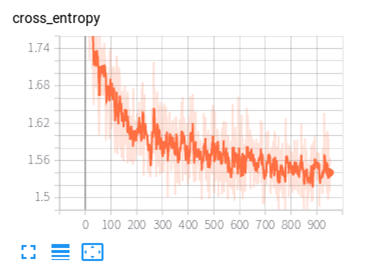
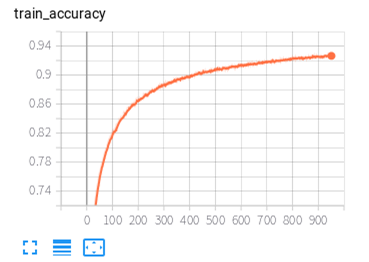
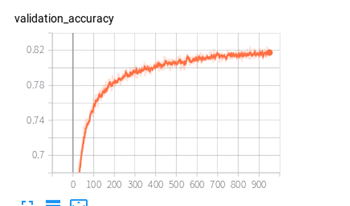
optimizer: SGD, momentum = 0.9, lr = 0.0005
epochs = 900
batch_size = 256
cross entropy: 0.8189
Training accuracy: 92.44%
Validation accuracy: 81.89%
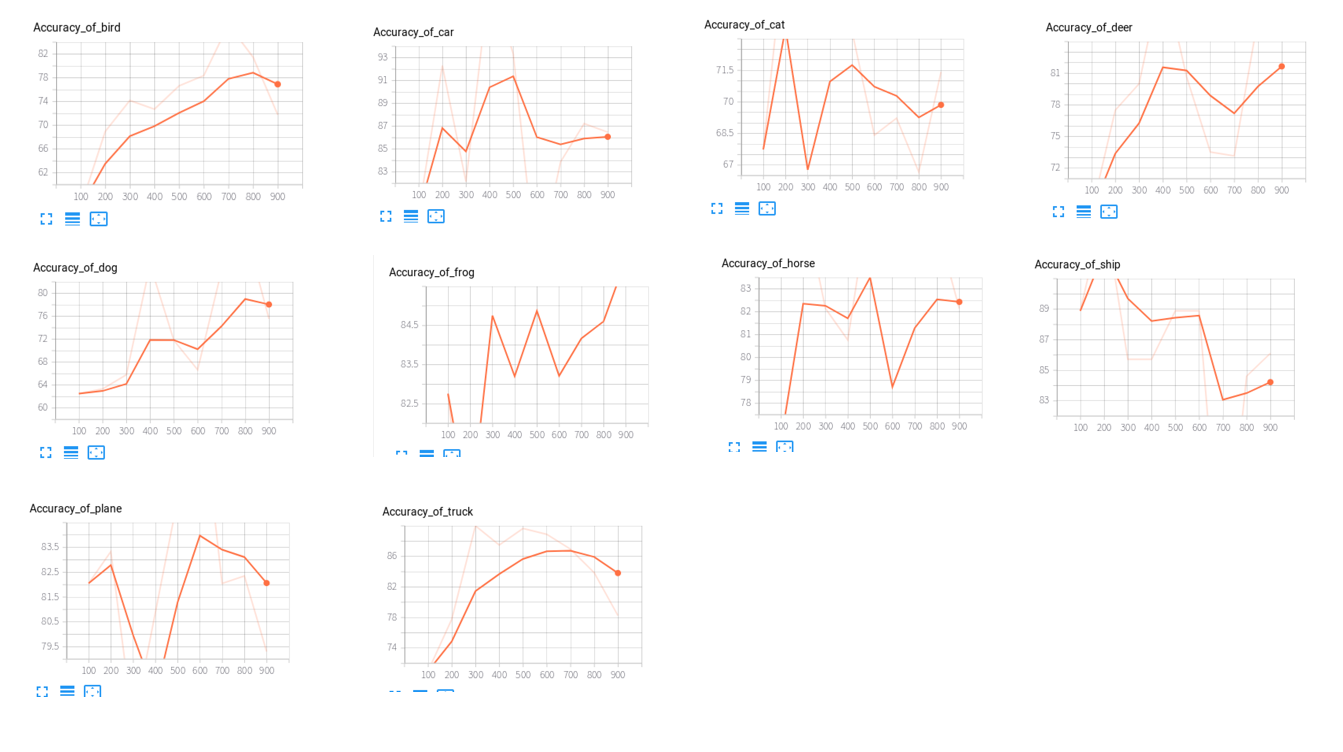
Accuracy of bird: 71.79%
Accuracy of car: 86.49%
Accuracy of cat: 71.43%
Accuracy of deer: 86.67%
Accuracy of dog: 75.56%
Accuracy of frog: 90.32%
Accuracy of horse: 82.14%
Accuracy of plane: 79.31%
Accuracy of ship: 86.11%
Accuracy of trunk: 78.26%
conv1, kernel_size = 7*7, stride = 2
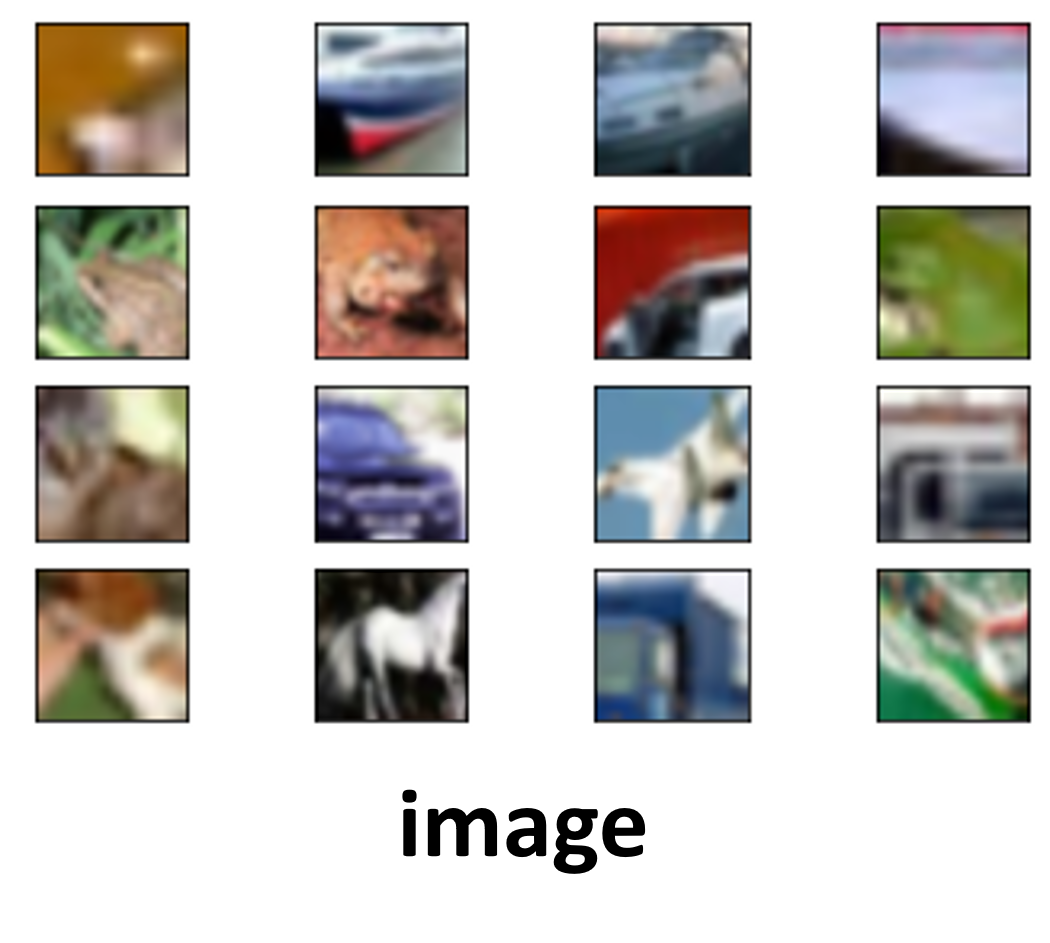
Original image
Feature maps and its reconstruction
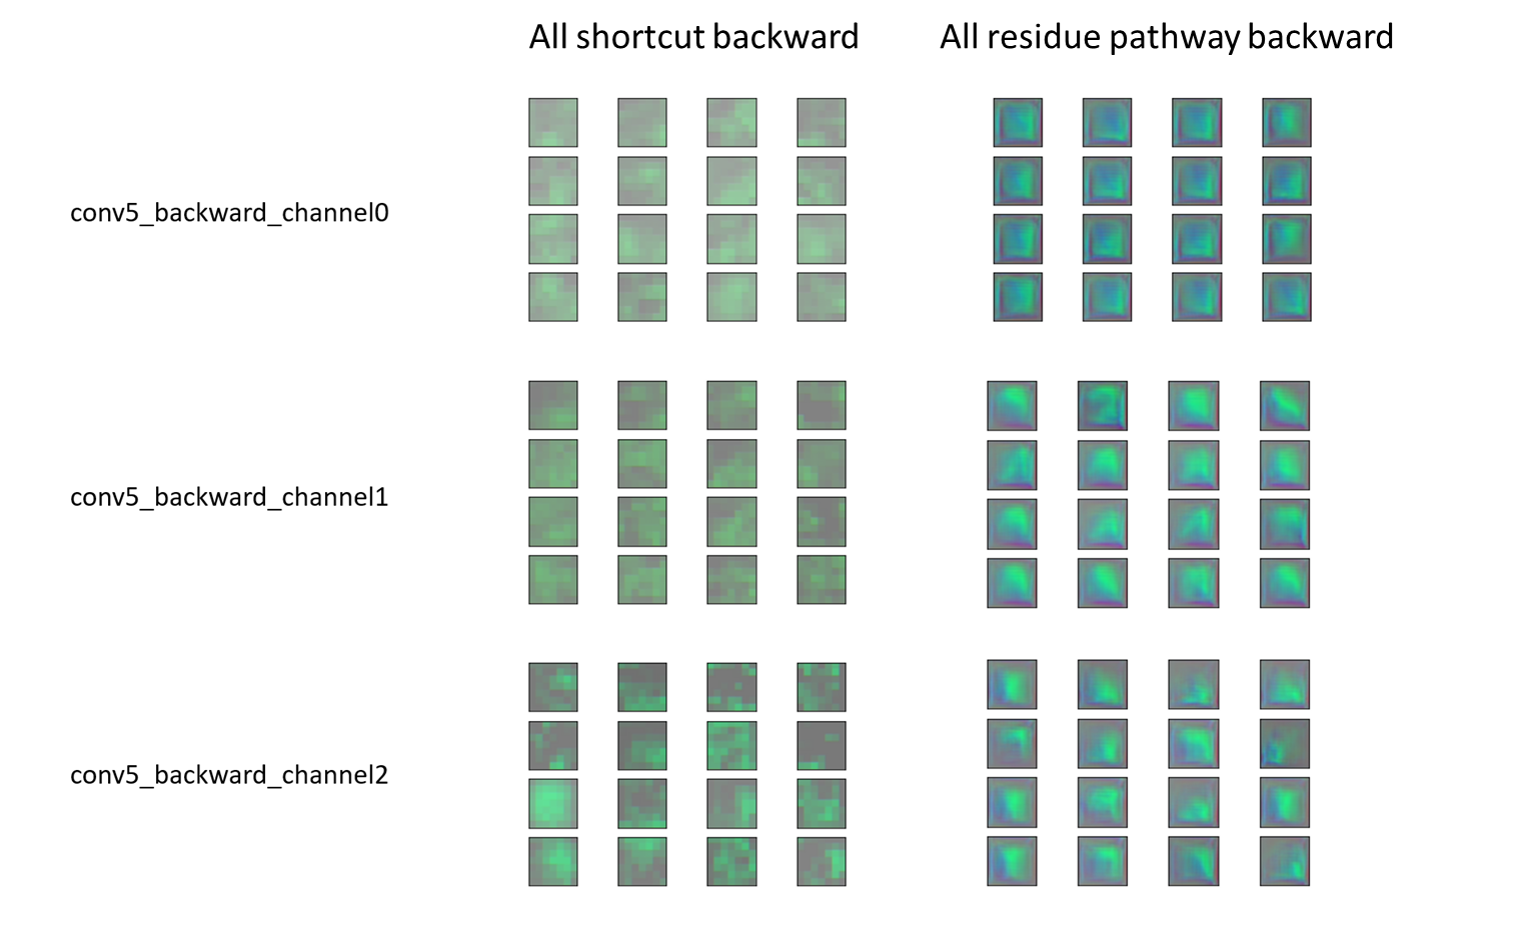
"Backward" means taking the a certain residue blocks' output and doing the reversing manipulation. For convolutional layer, the reversing manipulation is the deconvolutional layer with same kernel value; for maxpooling, the reversing manipulation is unpooling. So the backward is the reconstruction pattern of the activation of a certain residue block.
It is interesting that for a residue block, there is two path to reconstruct the image, by shortcut or by residue pathway(several deconvolutional operations). In the picture above, conv1_backward and conv2_backward just follow the residue pathway, and the reconstruction still keep something of the original image. But as for the conv5_x block, I make a comparison between these two result with conv5_x blocks which is quite deep in the resnet.
The result show that if we just follow the residue pathway, the reconstructions seem making no sense. However, if we just follow the shortcut, it seems that there are still some pattern remaining, although they are very blurred due to the information loss during the forward of resnet.
And there is another way to reconstruct the image. Using a certain feature maps as label, we set a parameter with size [1,3,224,224], and use it as resnet's input. By this way, we can obtain an output with the same size as the label. Calculating the sum square error, and backprop it to optimize the parameter to convergence. Finally we can get a reconstruction.
Here is the visualization.
- spend about 24 hours or more
- The course is good, and it's one of the only two courses that I don't quit, because I can have some real inspiration from your questions in classes, which can never be gotten in MOOC. But the lesson on Oct. 14th sucks, 'cause it is too fundamental and common in other MOOC. I think the discussion is the only thing values in the off-line courses.
- The assignment is challenging, and I really enjoy it.
- Maybe we can sometimes discuss about the newest paper, and its insight(why the method works, how can the author come up with this).
resnet.py
[1] https://pytorch.org/docs/stable/_modules/torchvision/models/resnet.html
[2] https://www.cnblogs.com/zf-blog/p/7792373.html
myconviz.py and utils.py
[1] https://github.com/grishasergei/conviz
[2] https://github.com/kvfrans/feature-visualization
[3] https://github.com/utkuozbulak/pytorch-cnn-visualizations
