student work in R for Foundations of Data Science
walkthrough:
code:
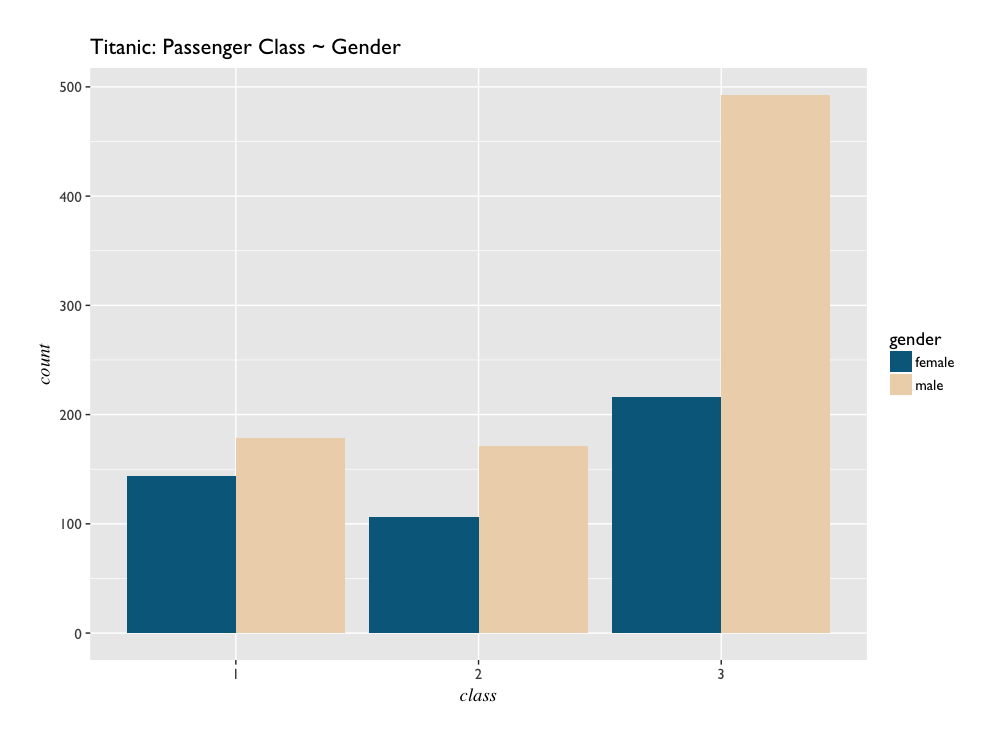
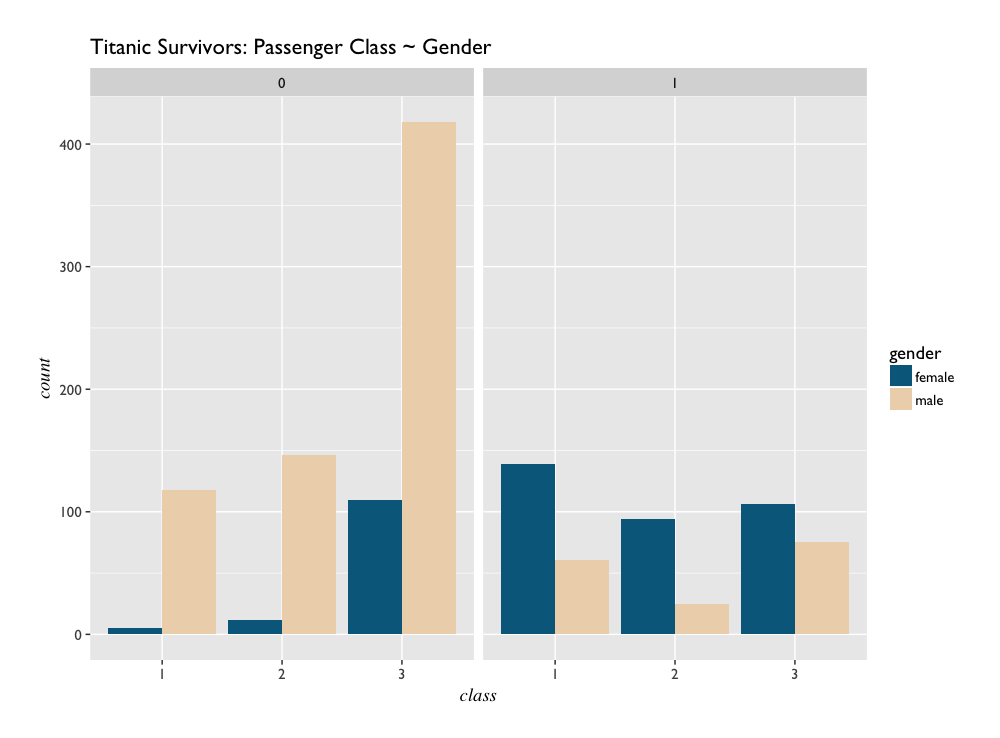
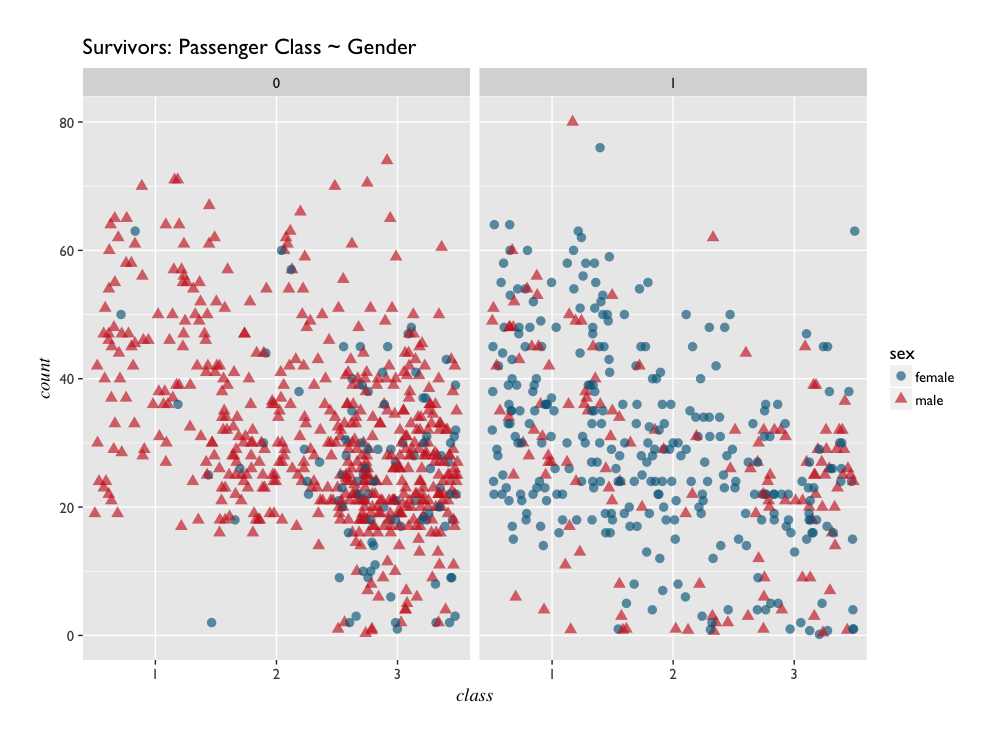
- Titanic - exploratory plots of variables from the Titanic dataset.
- CHIS - in depth plotting of variables from the California Health Intervew Survey. Includes faceted plots, contingency tables, chi-sqaure testing, and a generalized function for mosaic plots of variables.
data sources:
Life tended to end, for men travelling 3rd class.
What is CHIS?
"The California Health Interview Survey (CHIS) is the largest state health survey in the nation. It is a random-dial telephone survey that asks questions on a wide range of health topics. CHIS is conducted on a continuous basis allowing the survey to generate timely one-year estimates. CHIS provides representative data on all 58 counties in California and provides a detailed picture of the health and health care needs of California’s large and diverse population."
The above information was taken directly from the California Health Interview Survey website.
library(ggplot2)
library(Hmisc)
library(scales)

# load data -------------------------------------------------------------------

adult <- spss.get("data/ADULT.sav")

# Explore the dataset with summary and str
str(adult)
summary(adult)
adult$BM
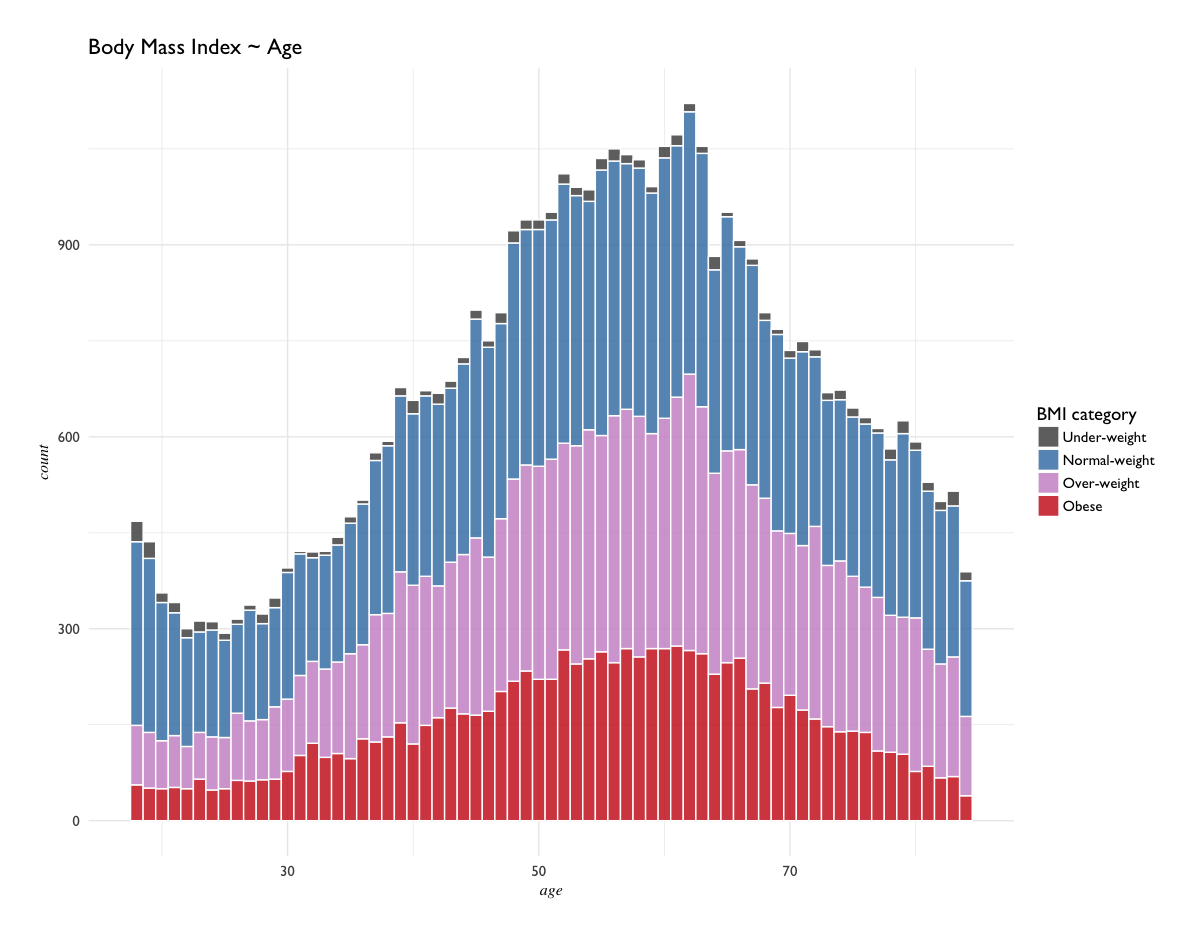
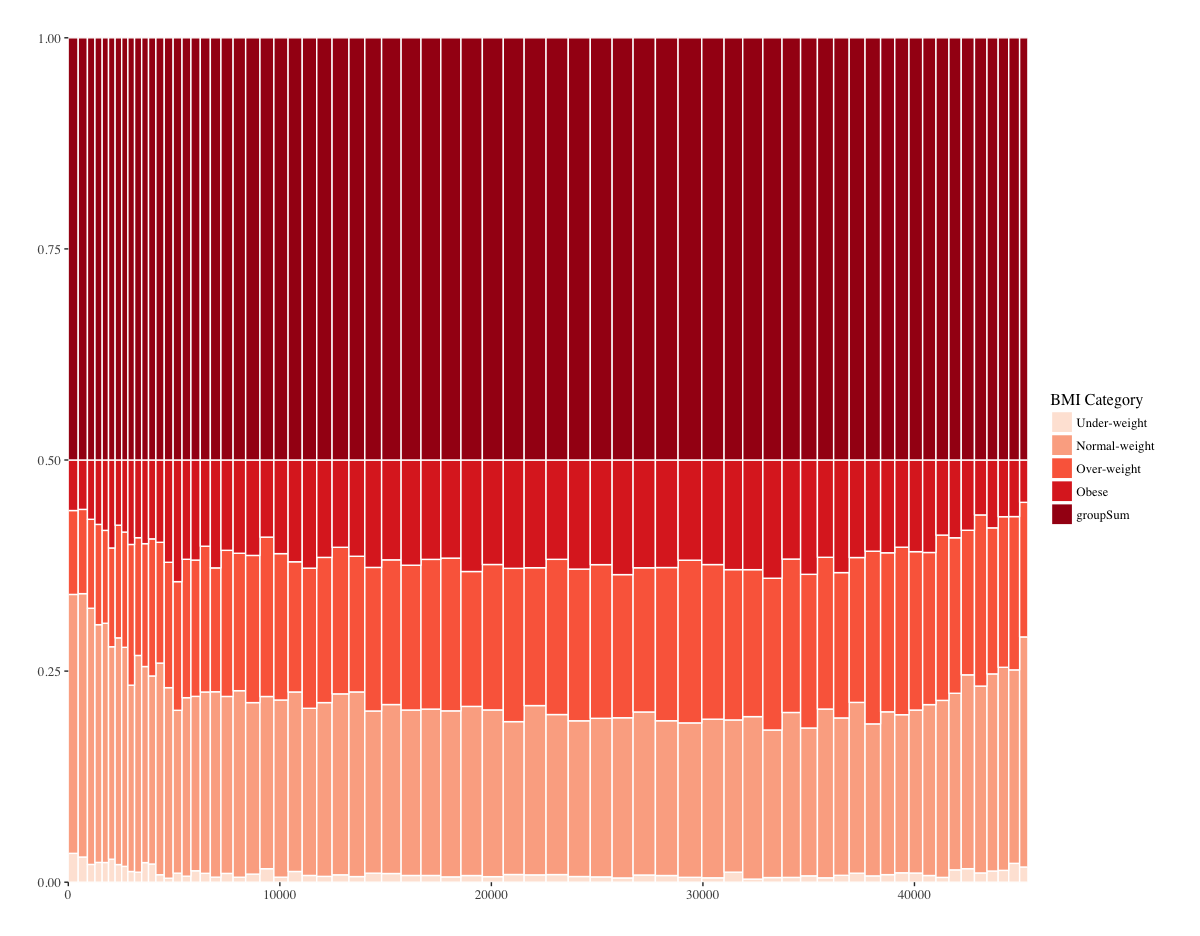
The dataset is a bit of a mess, but the main variables of concern for this exercise revolve around Body Mass Index (BMI) and Age. To save time and prevent myself from over-customizing exploratory plots, I've defined a general ggplot2 theme to use:
# Define a general theme:
# assigns GillSans to theme_minimal, makes axis titles italic set in Times.
pd.theme <- theme_minimal(base_size = 14, base_family = "GillSans") +
  theme(plot.margin = unit(c(0.5, 0.5, 0.5, 0.5), "cm"),
        axis.title = element_text(family = "Times", face = "italic", size = 12,
        margin(1, 1, 0, 0)))
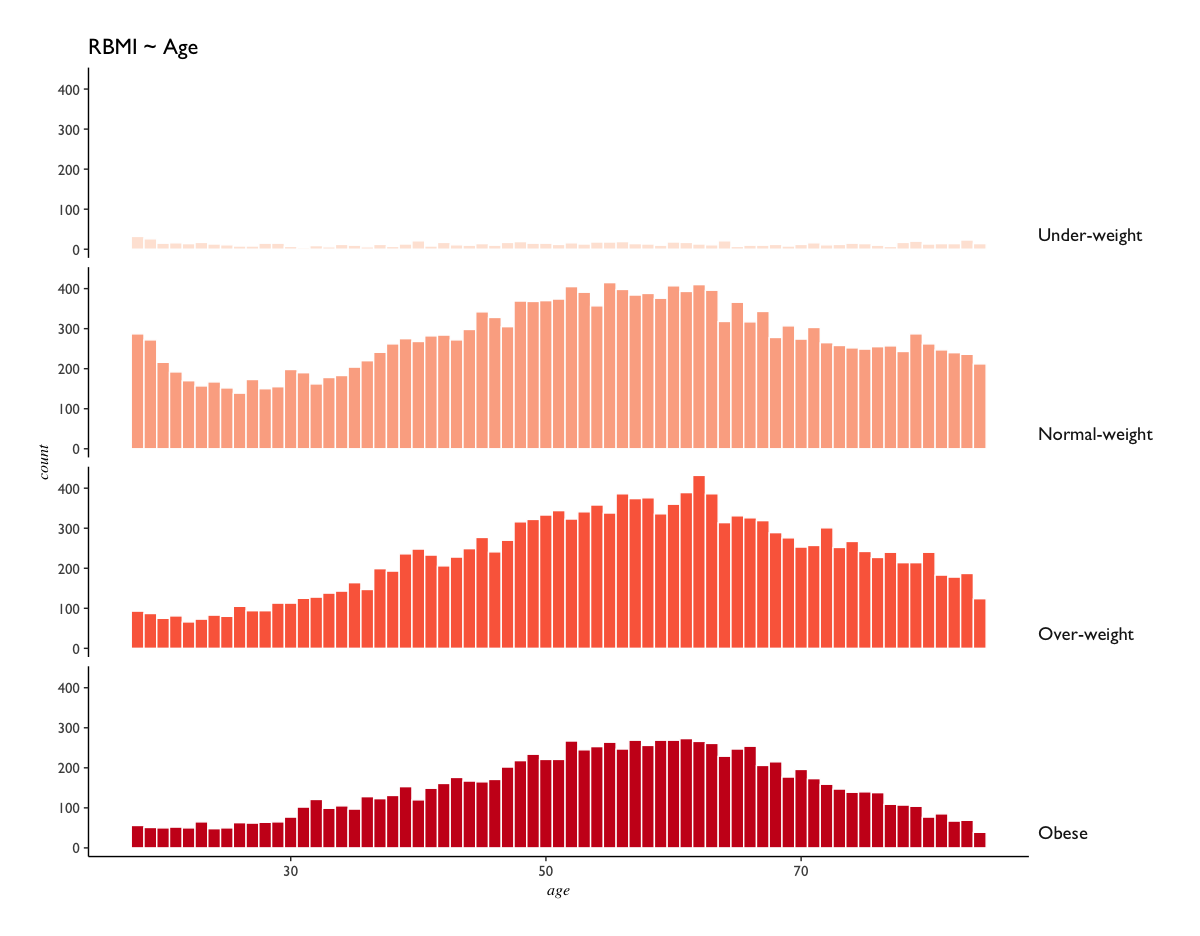
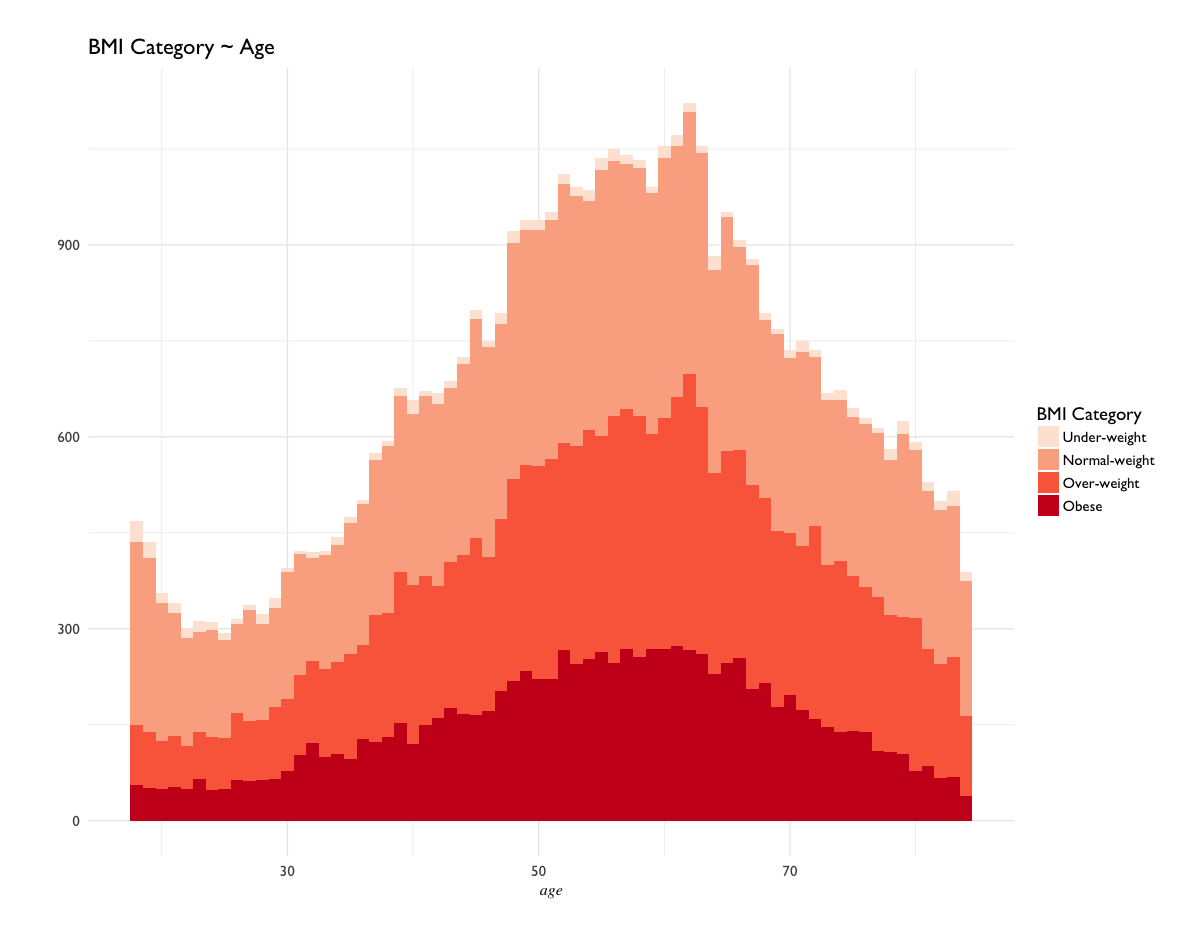
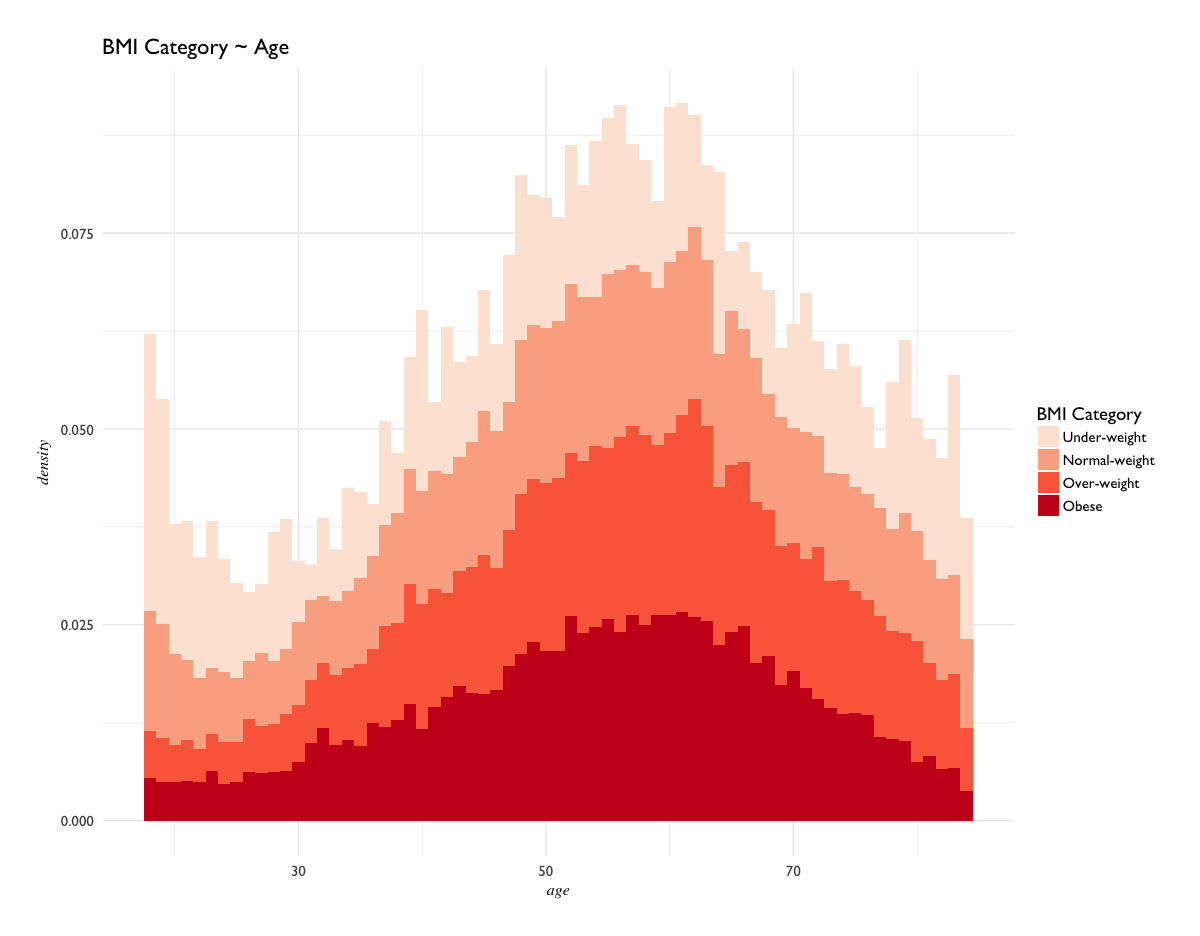
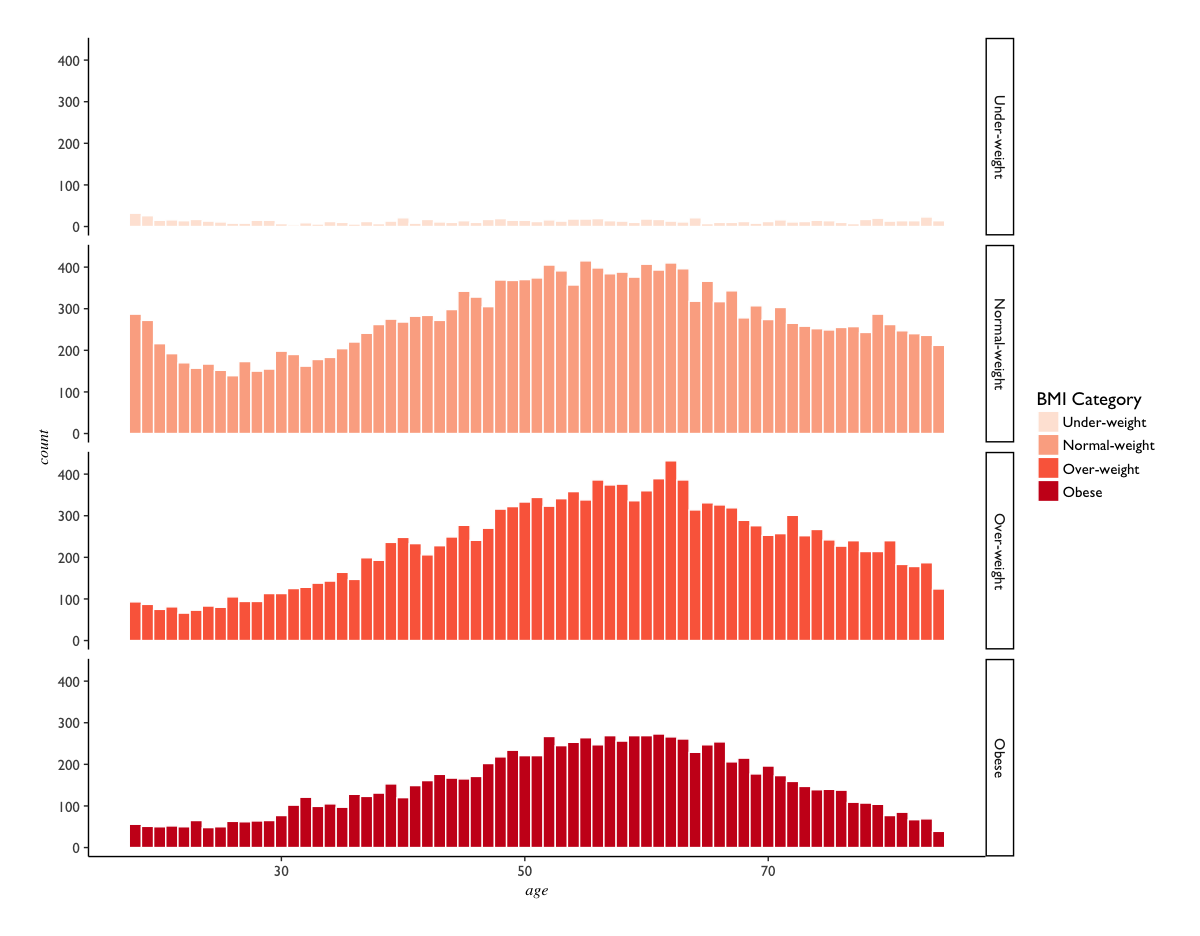
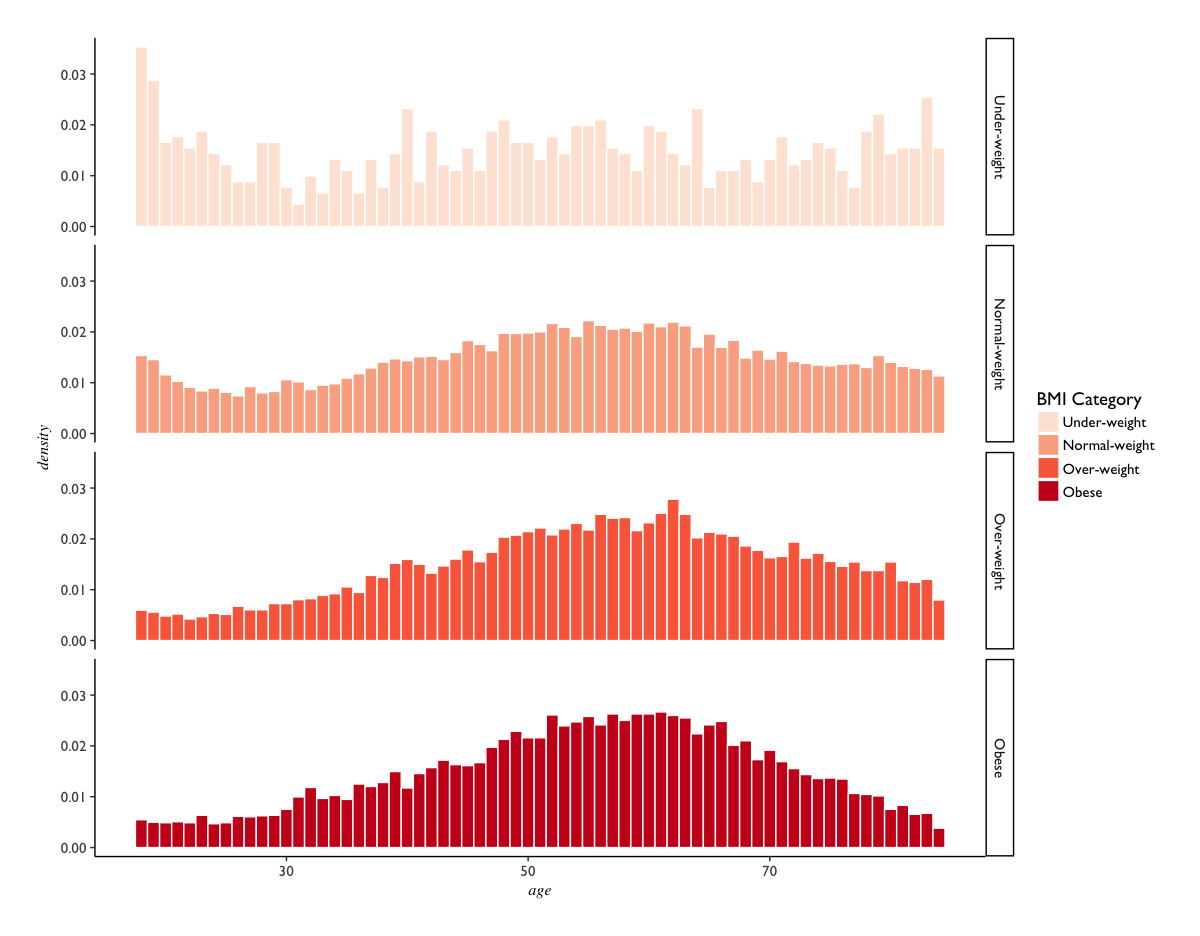
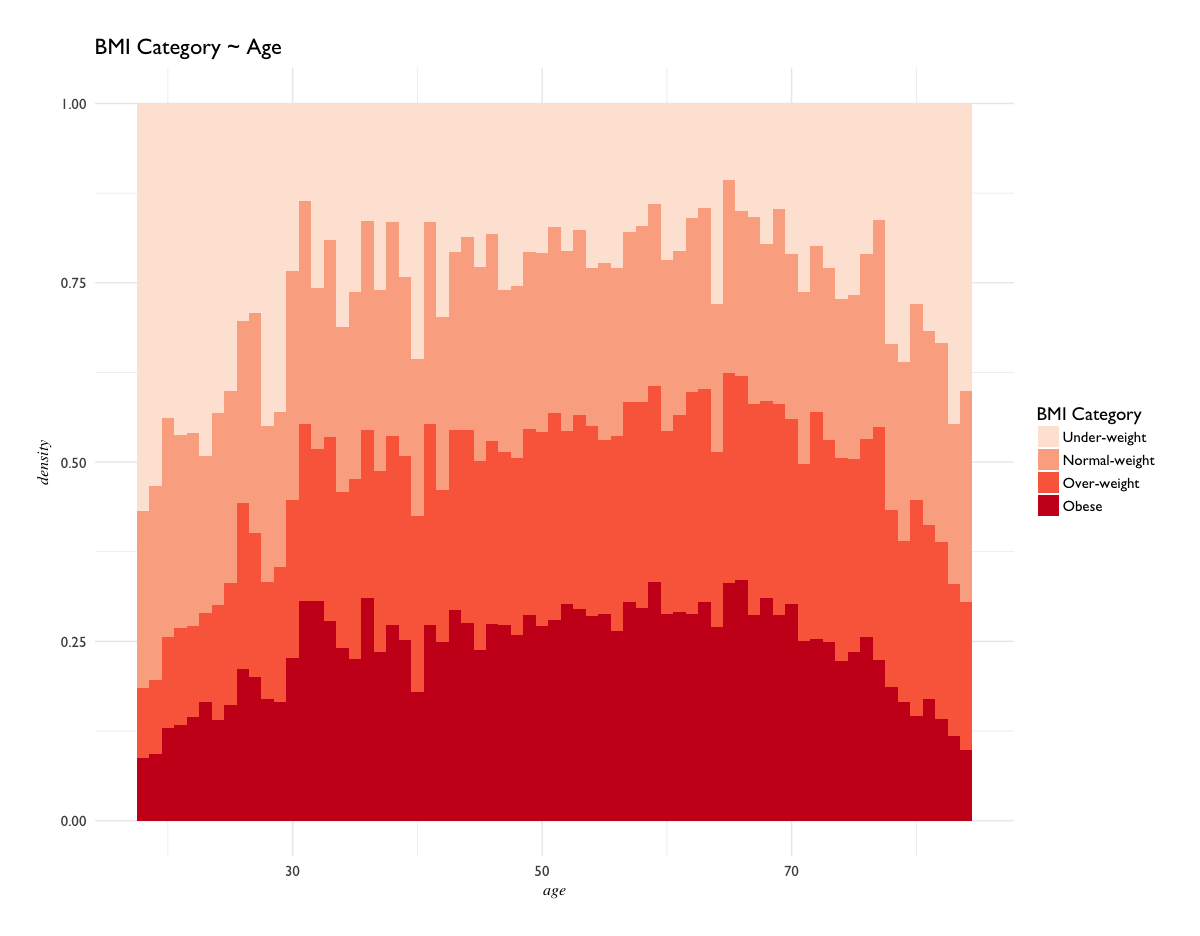
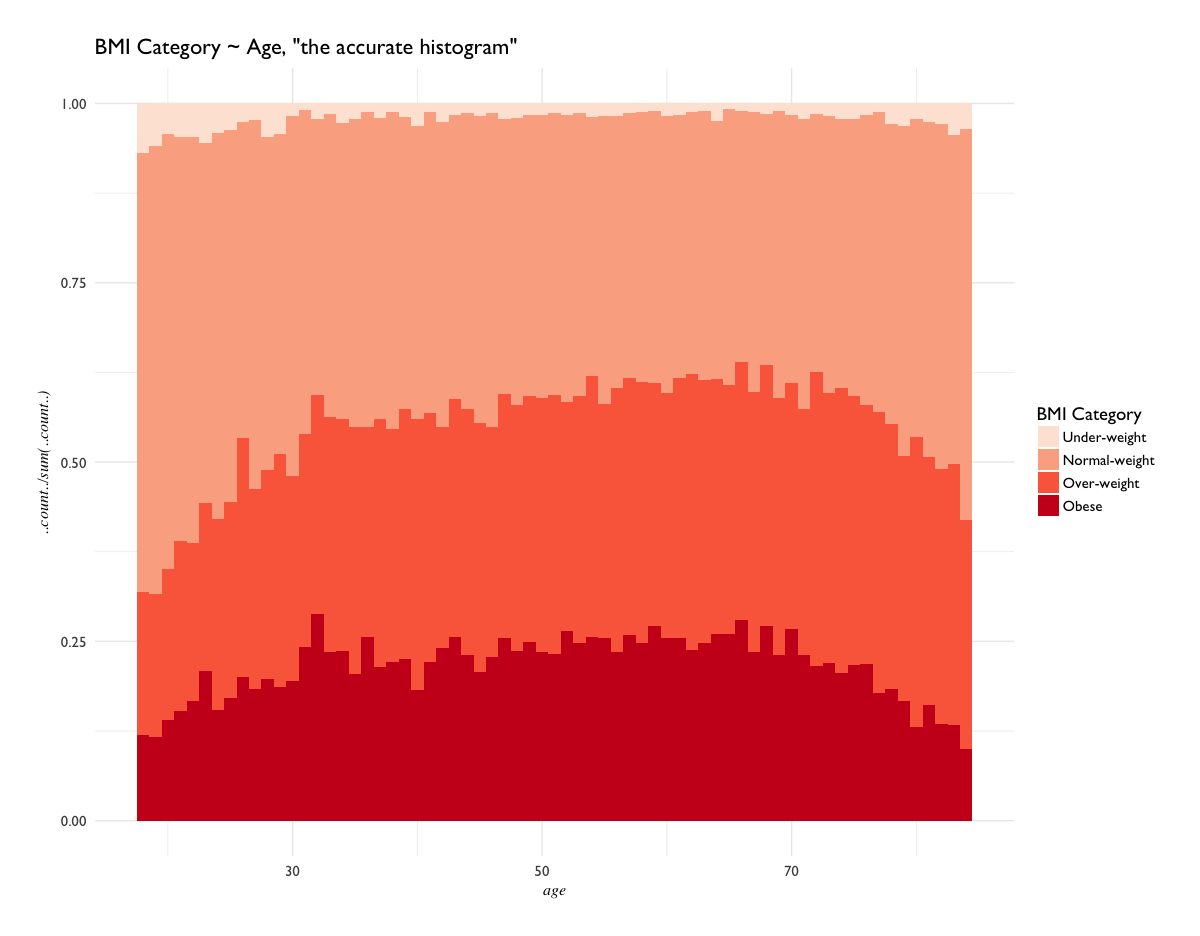
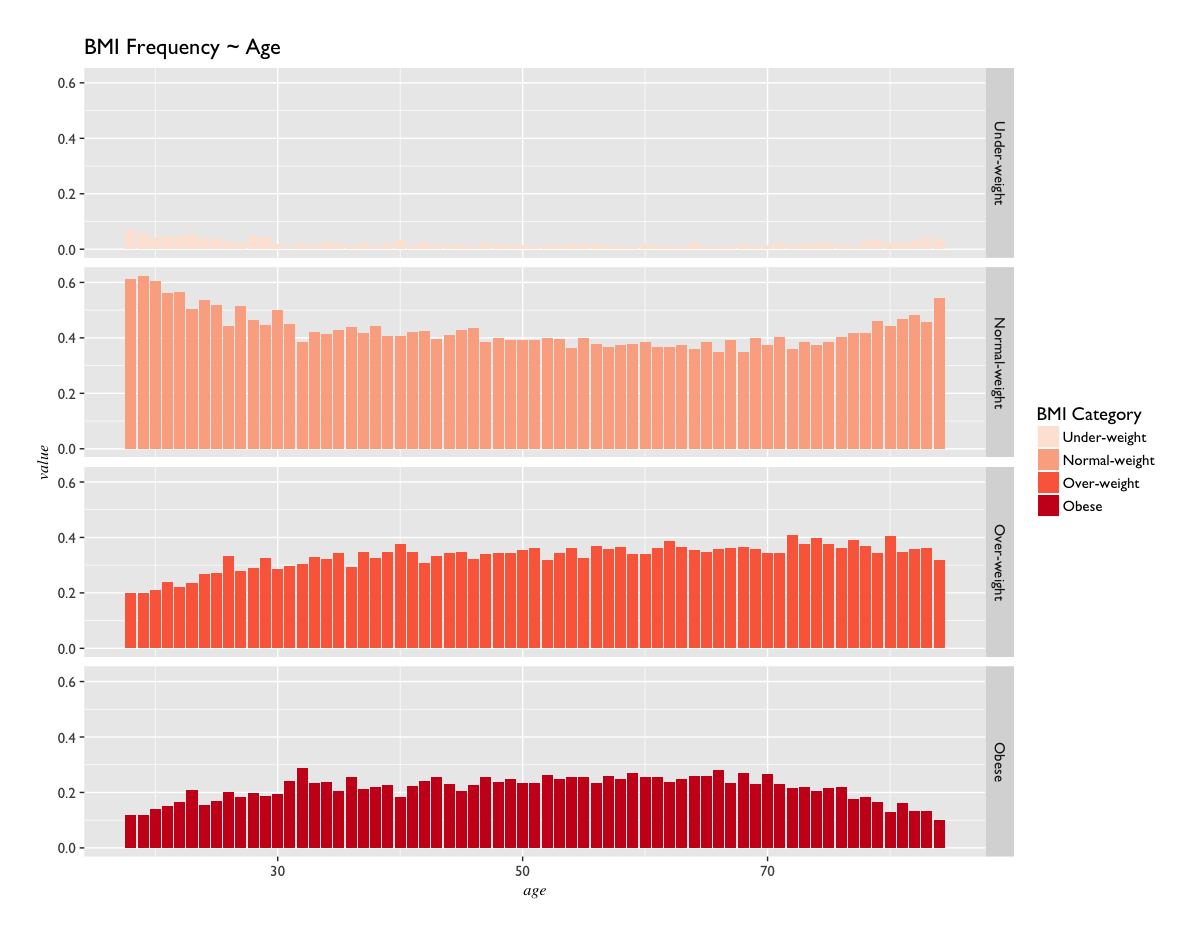
First we look at how Body Mass Index is distributed over Age.
Initial explorations:
Density:
Density, facetted:
An Accurate Histogram:
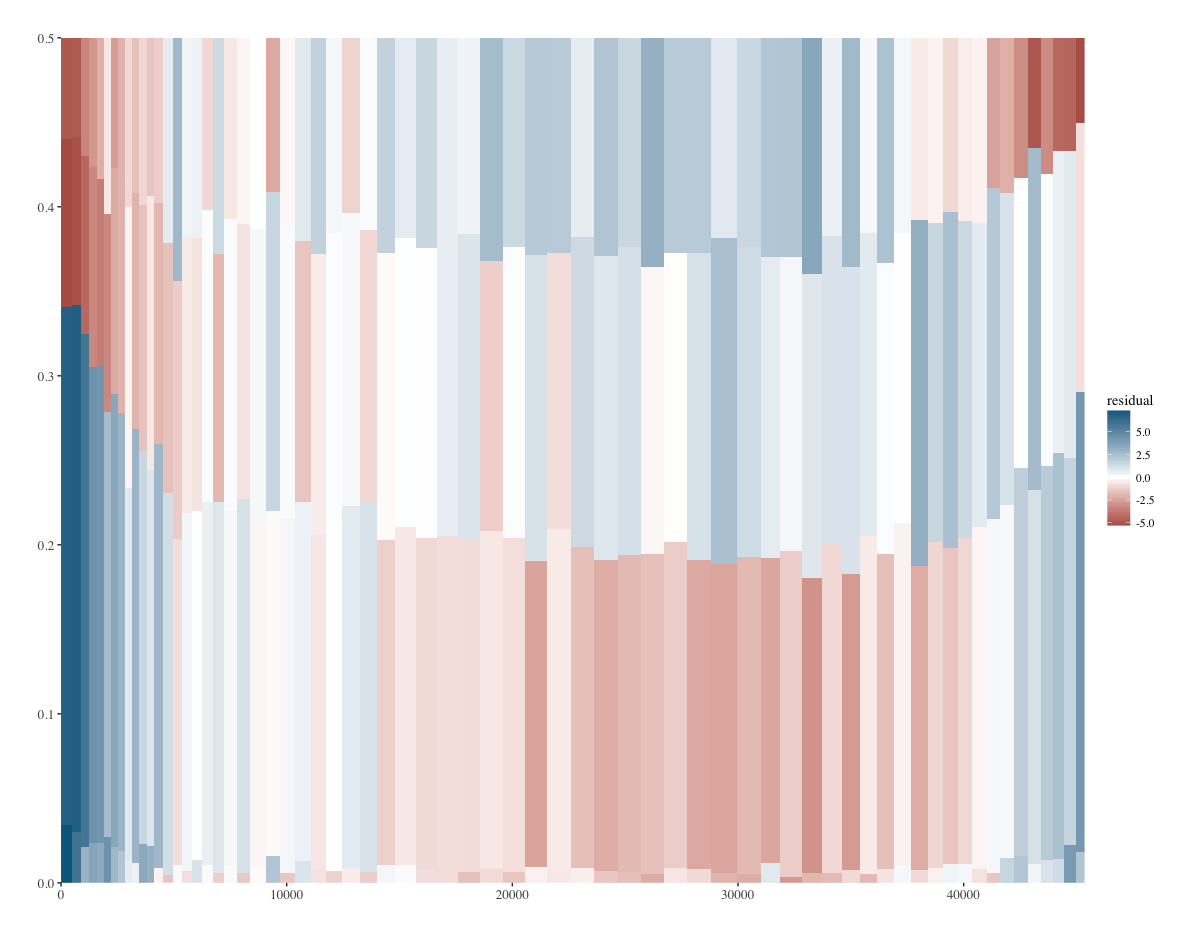
Contingency table:
Chi-Sq table:
