Excel Heat Maps
A Python program for creating Excel percent matrices on how complete your data is.
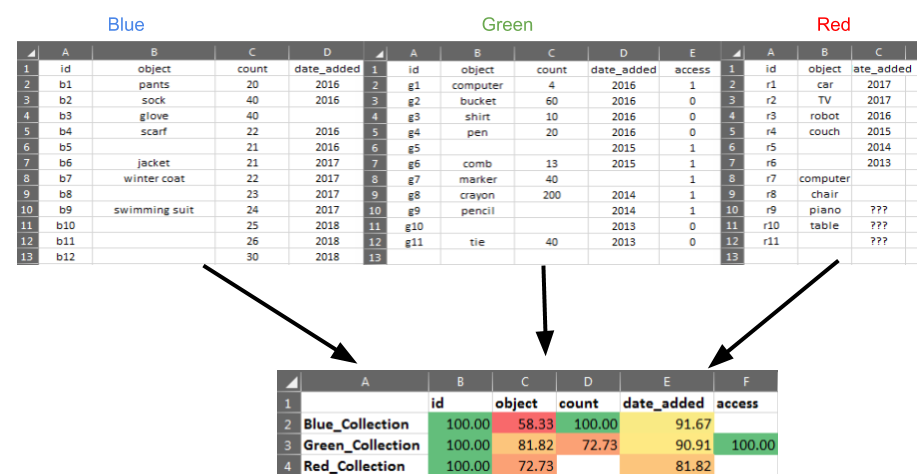
This program works by reading a set of Excel files, putting together a single report on how complete the data fields are in each, using conditional formatting in Excel for a data visual. An example is as follows:
Say you have Excel reports for metadata on three collections: red, green, and blue. Each report has its own metadata, and some collections are more complete than others:
The output report tells you the percentage of data that's filled in for each metadata element for each collection. If a metadata element is missing from a report, the output in the heat map will be a blank cell. Clicking on a cell will reveal the formula that determines the completion percentage (the ratio of filled in items over total items, e.g., 7/10).
How to run it:
Download the code, install the requirements (python -m pip install -r requirements.txt) inside the project directory, and place your
input files in the files/in directory.
A simple example of running the code is as follows:
from ExcelHeatMaps.combiner import ExcelFileCombiner
efc = ExcelFileCombiner()
efc.get_percent_matrix()
The output file should appear in the files/out directory.
